

Seasonally Soft September
September is a statistically soft month, not only for Bitcoin, but for most risk assets. Today we're going to investigate the BTC demand profile to see whether we can buck this soft-September trend.

G’day Folks,
Bitcoin continues to trade in a somewhat heavy manner, with the price selling off as far as $110k on Sunday, retesting the previous all-time-high break-out. We had a short term rally back up to $117k after Jerome Powell’s somewhat dovish speech at Jackson Hole, but the market has given it all back.
There’s no question, that the bulls just haven’t been able to establish much upside momentum in recent weeks.
Generally speaking, whenever I have seen the market trade in this manner, where short-term rallies are quickly faded, it is often a signal that the correction hasn’t run out of sellers just yet.
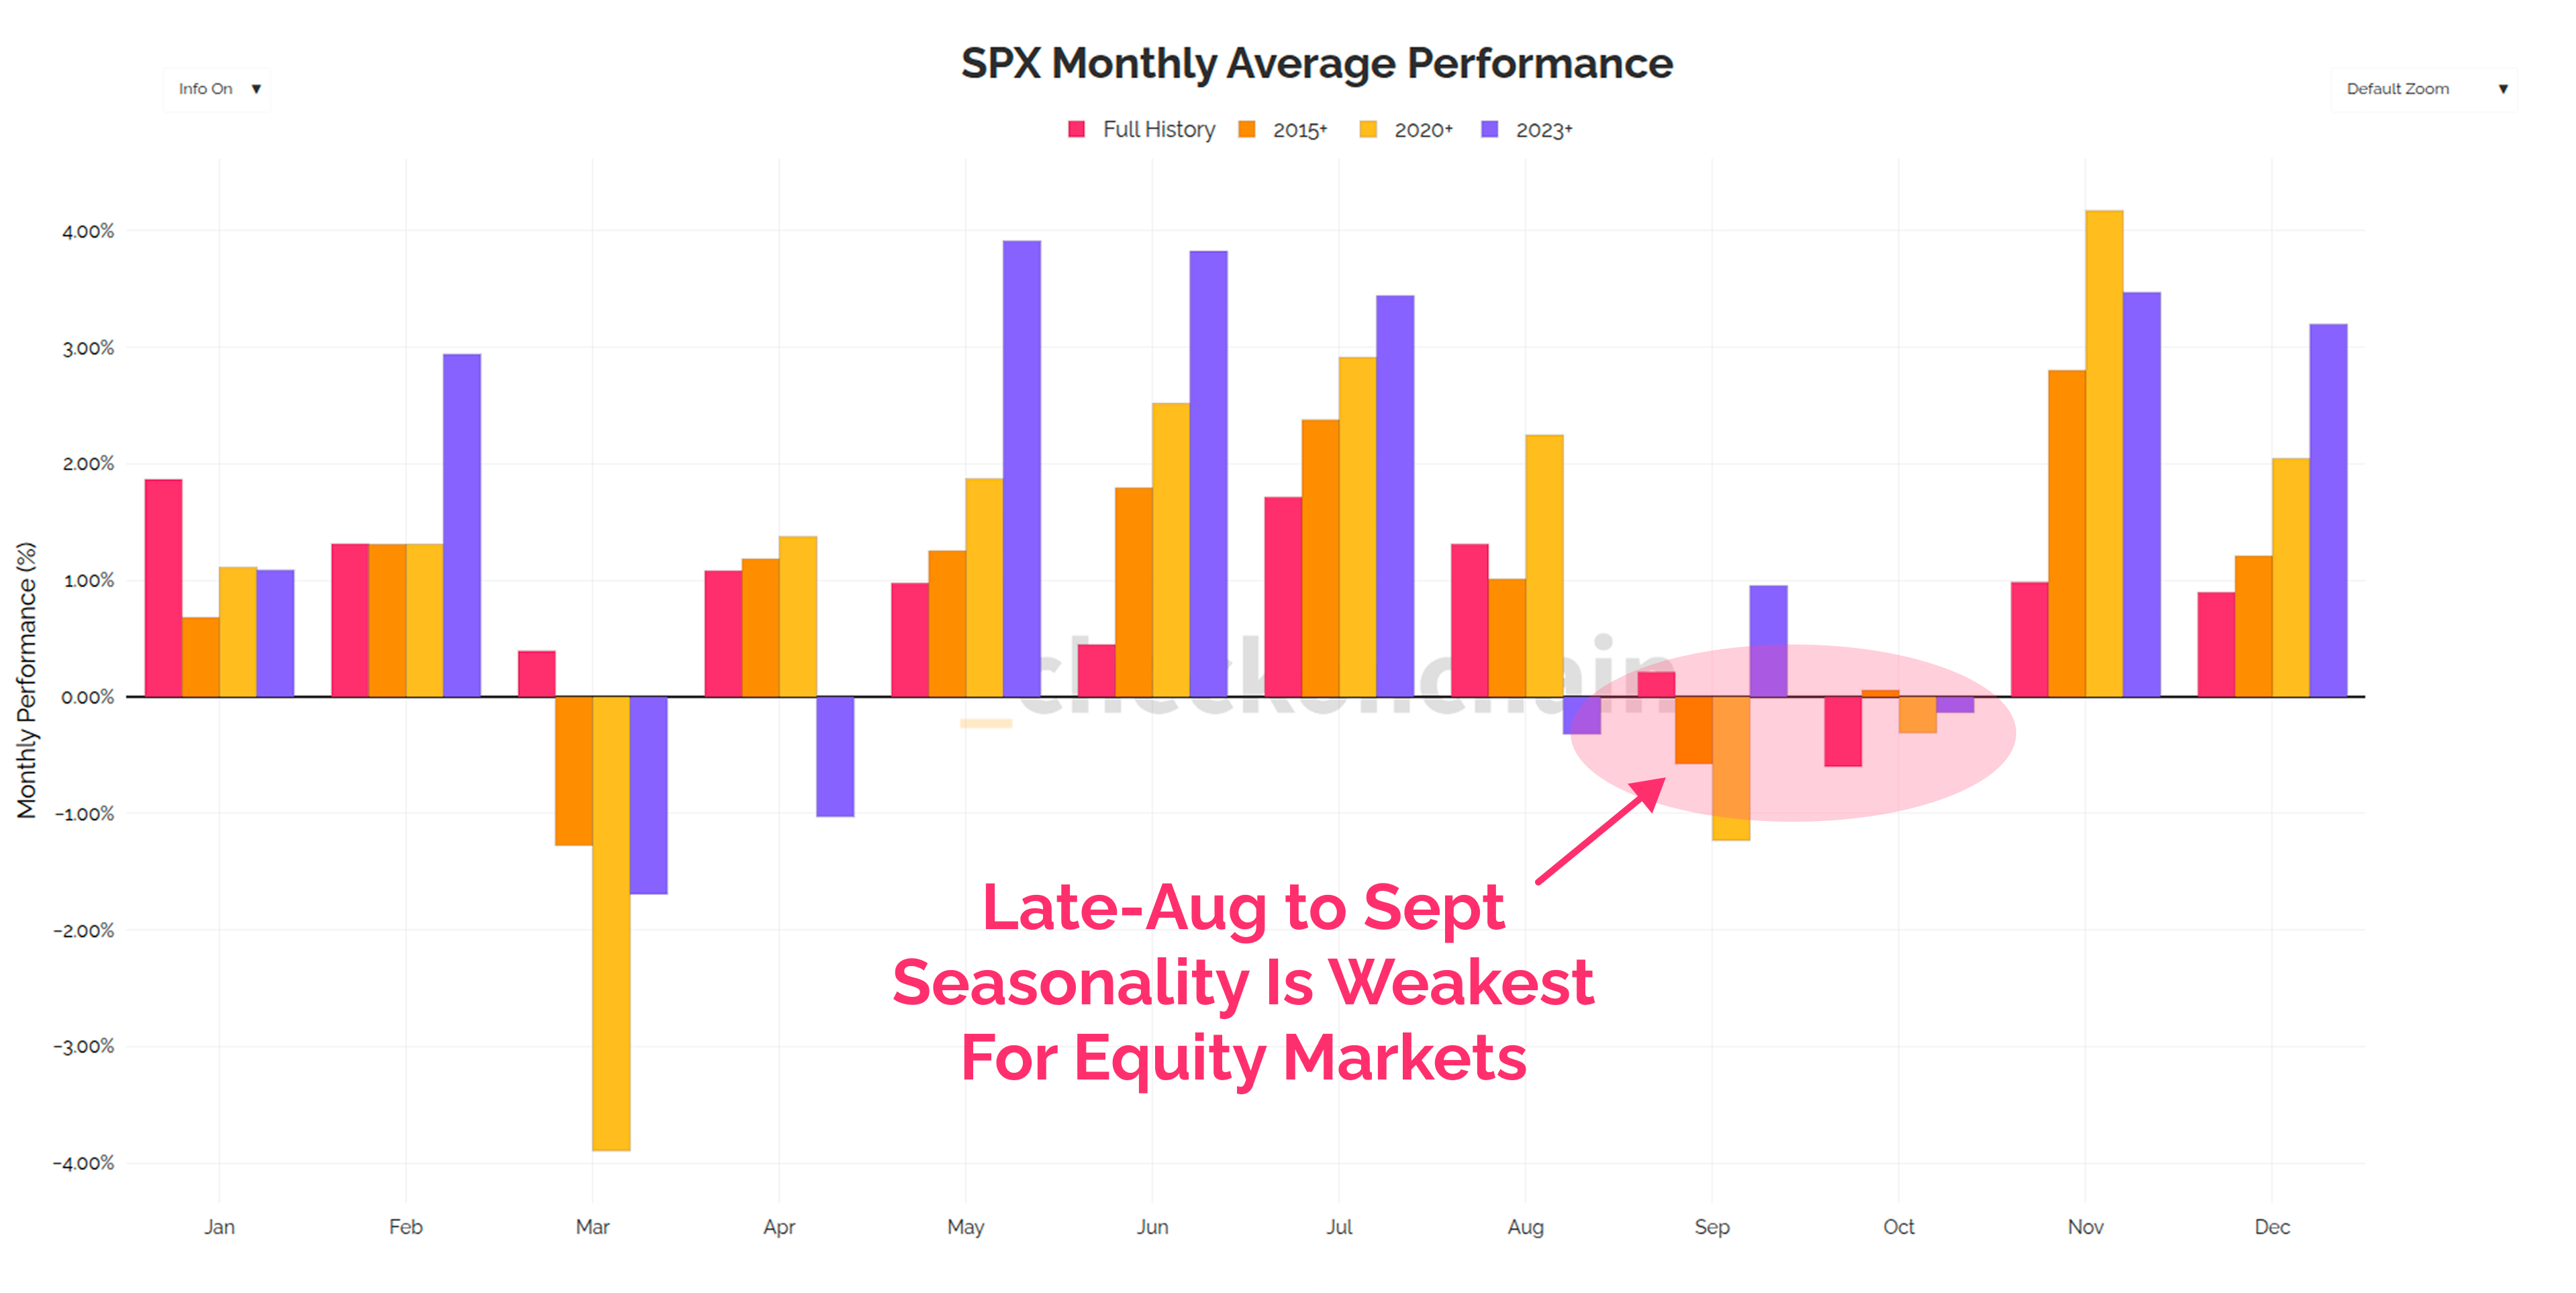
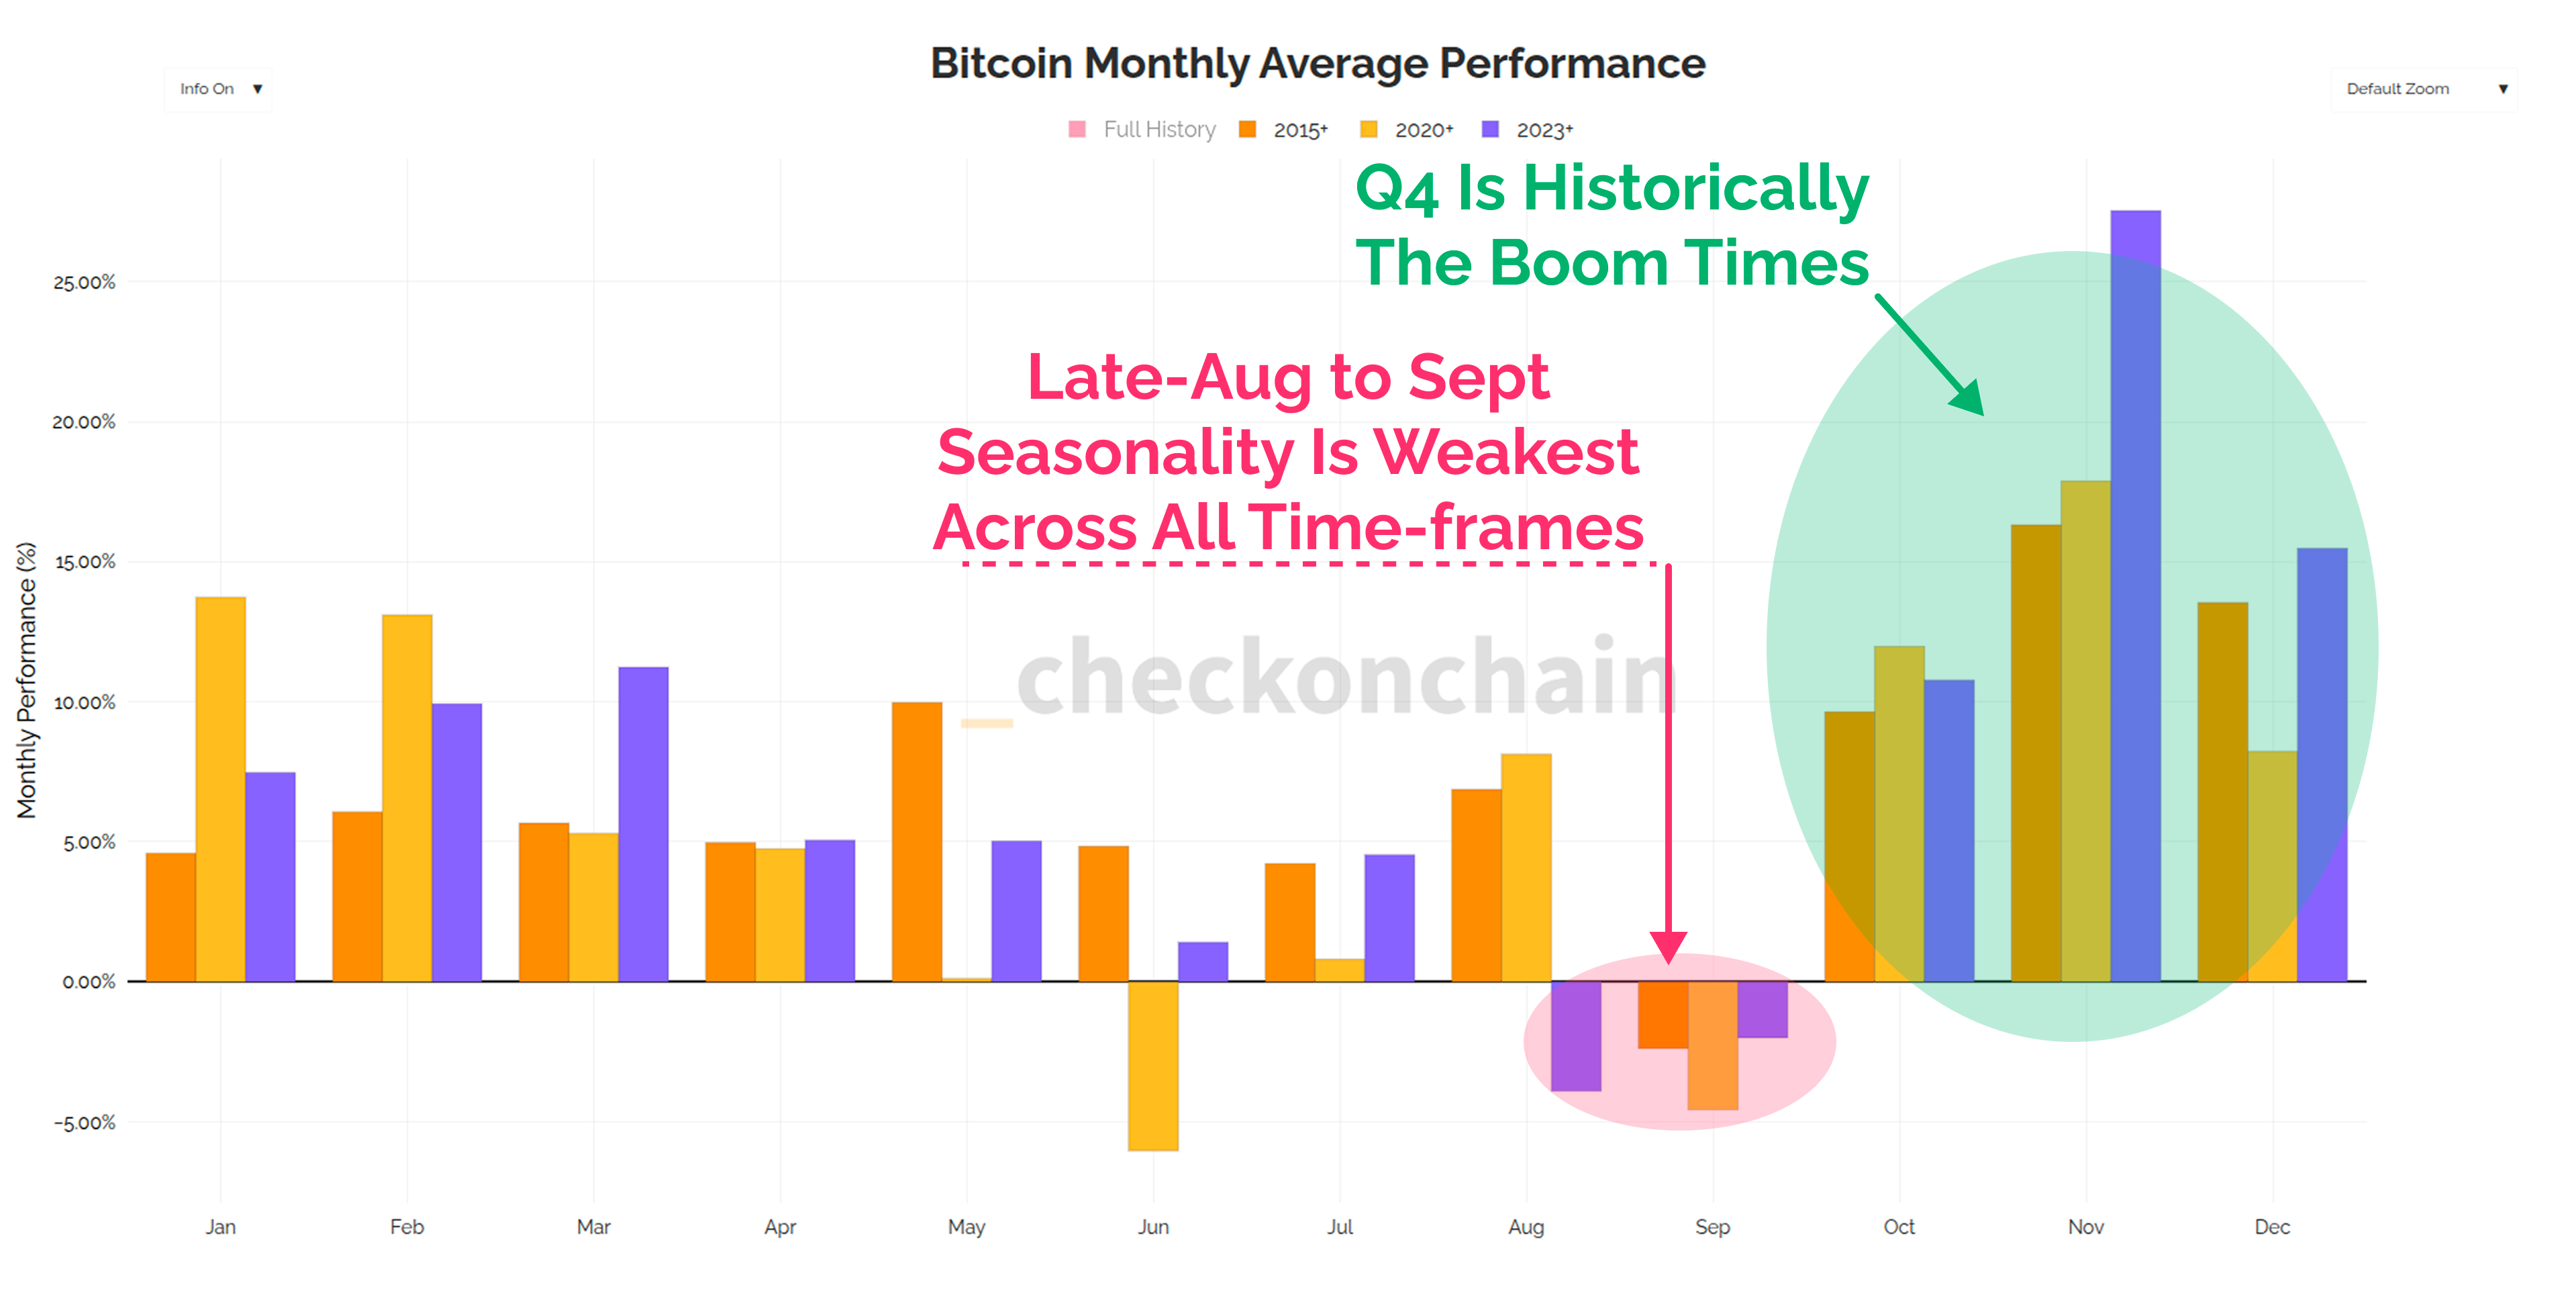
As Bitcoin becomes an asset which is increasingly traded by institutional investors, we can expect market seasonality to play an increasingly relevant role in how it trades. If we look at the average monthly performance for the S&P500, late-August and September clearly emerge as one of the weakest periods of the year.
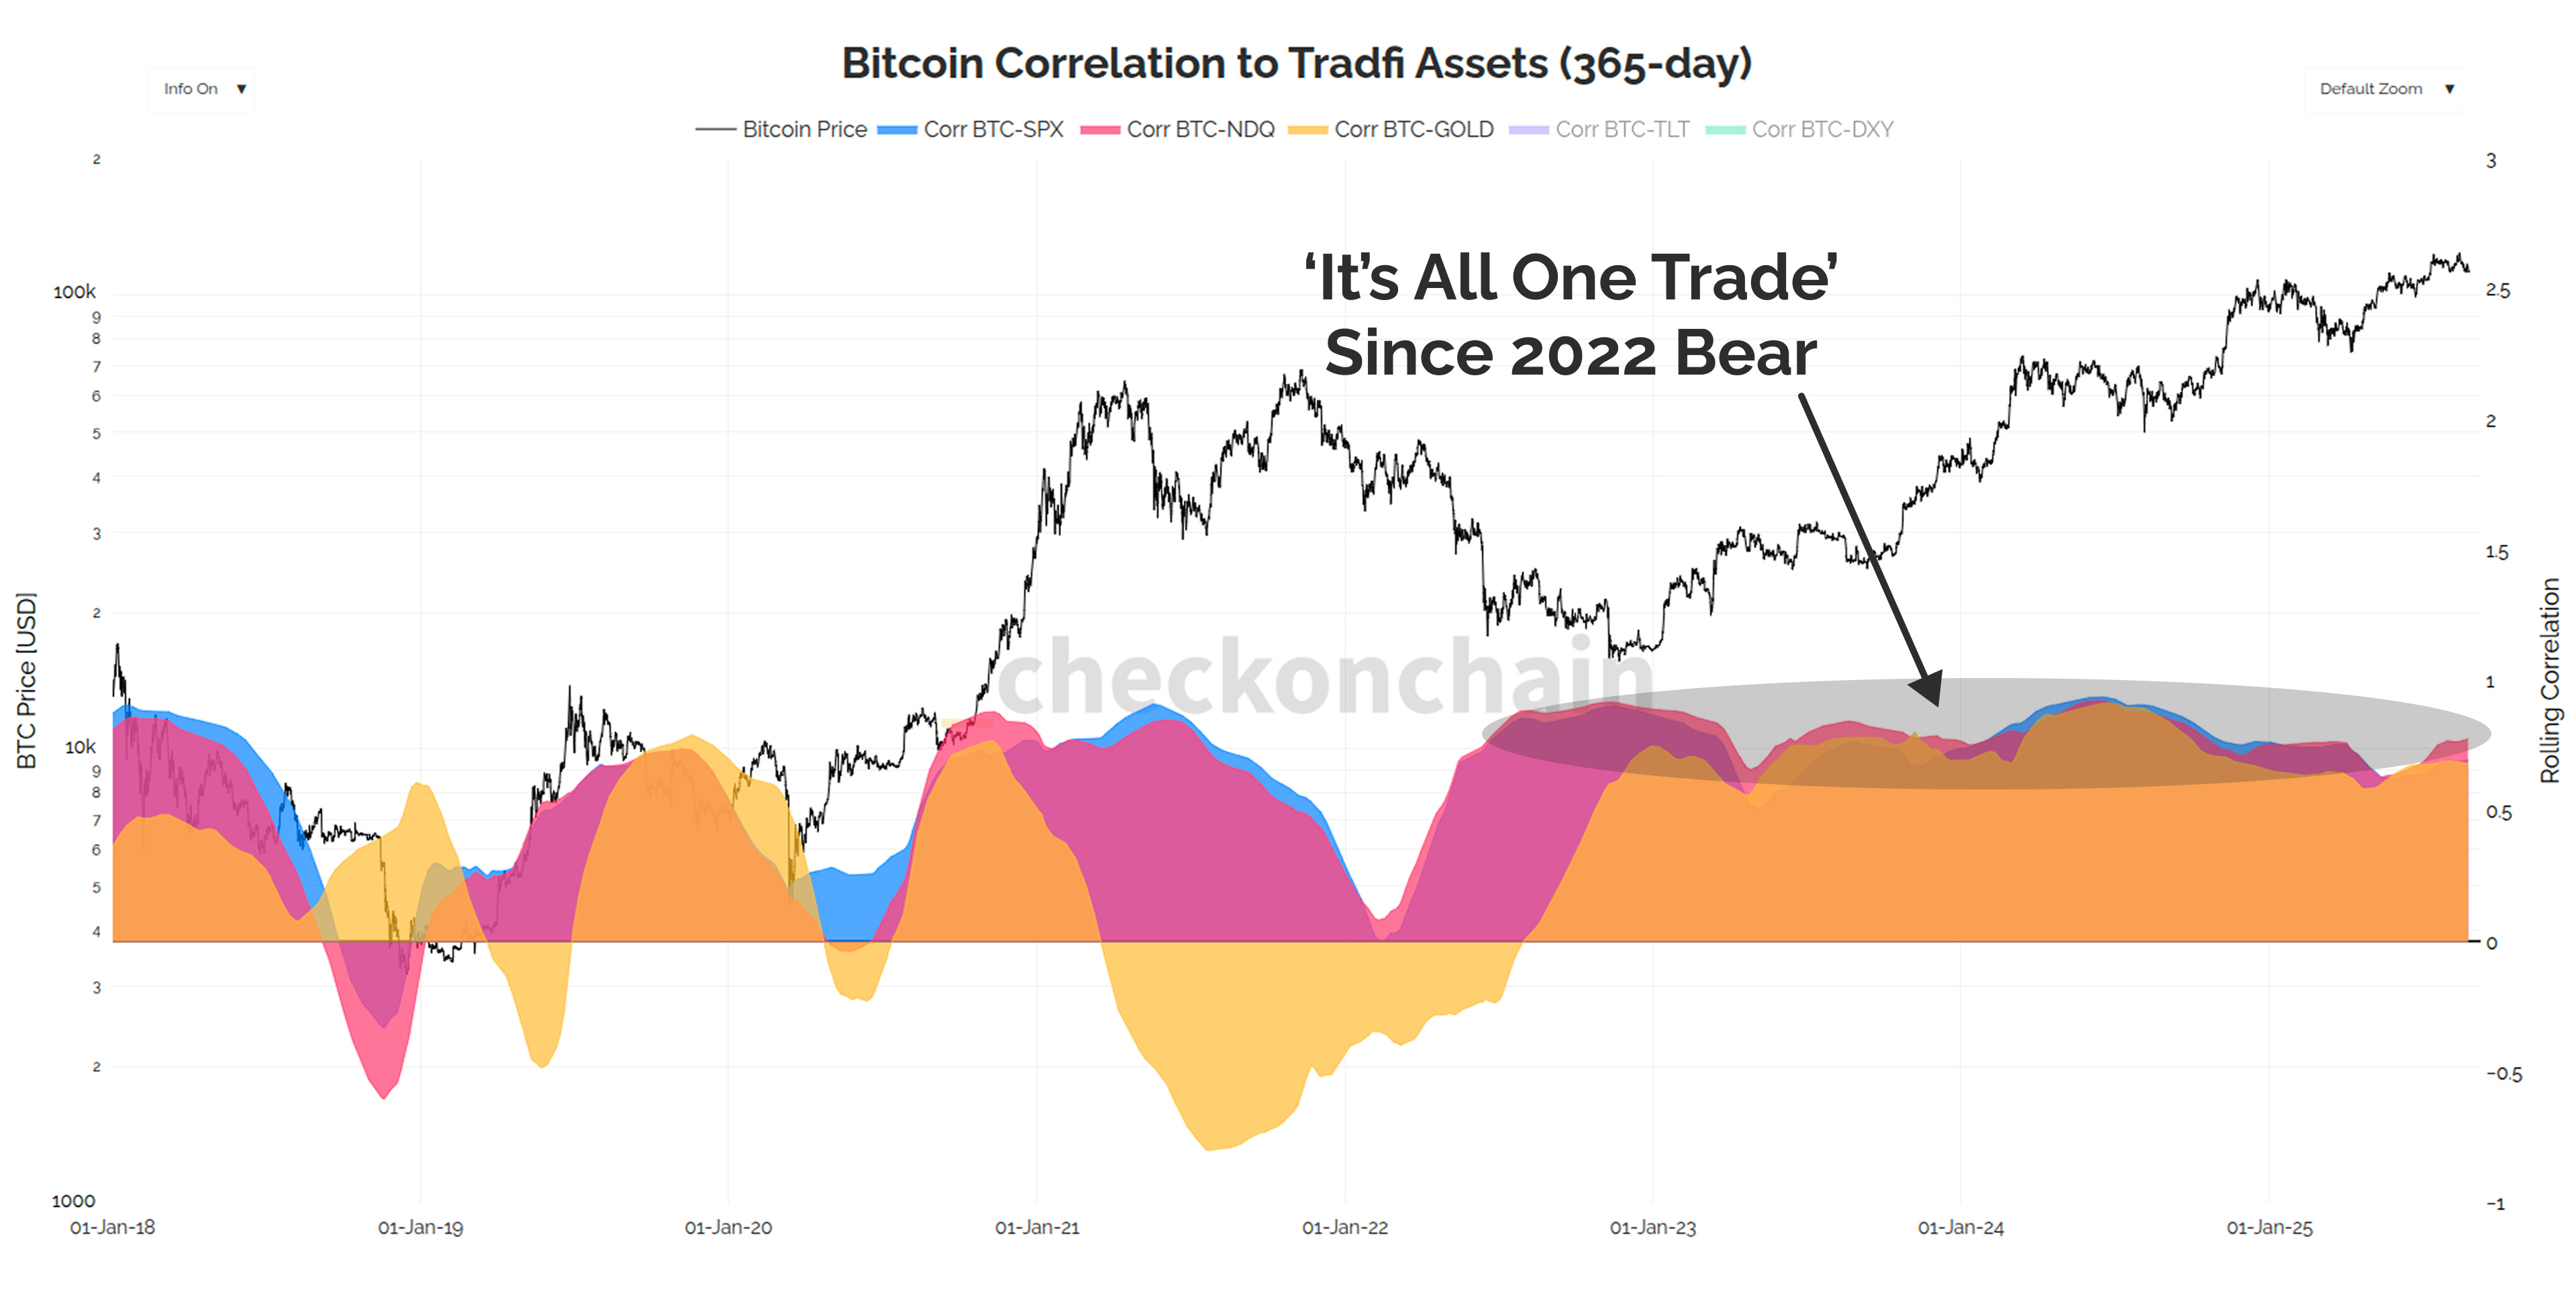
Since the 2022 bear market, the long-term correlation between Bitcoin, equities and gold have all been consistently higher than usual. In my eyes, this is a reflection of the idea that it is all one trade, where assets are being used as a tool to hedge fiat currency debasement risk.
If it is all one trade, and September is a historically weak month…perhaps September is going to be a weak month!?
In today’s report, I’m going to explore a variety of factors which I think are weighing on the Bitcoin price, ranging from:
The behaviour of Short-Term Holders.
Demand coming from from ETFs and Treasury Companies (or a lack thereof).
A read on how the options market is pricing in current downside risk.
The idea will be to make a read on whether a soft September is likely to play out, or if there is evidence we may buck the historical trend.
Premium Members will find the TL:DR summary, video update and the rest of the written post below.
Disclaimer: This article is general in nature, and is for informational, and entertainment purposes only, and it shall not be relied upon for any investment or financial decisions.
TL;DR
September is statistically the weakest month for Bitcoin, and also a weak month for equities and risk-assets.
Given the soft demand profile from the ETFs and Treasury Companies, it should be of no surprise if the next few weeks are soft as well.
The bid from Treasury Companies is likely to be very weak in the near term as mNAV compression continues, and the ETFs just had a meaningful outflow week of almost -$1.2B.
The leveraged long traders in futures markets are still longing the dips, and liquidating their accounts, and Short-Term Holders are starting to feel a little sensitive as prices trade lower.
However, despite all of that arguably bearish information, frankly, this is all fairly normal and arguably expected at this time of the year.
On a positive note, whilst September is usually soft, Q4 is statistically the most powerful seasonal period for Bitcoin.
The way I see it, is the most picture perfect few weeks ahead is a correction down to (and even an undercut of) the STH cost basis at $108k, which motivates the bears to lever up and go short…only to have a classic explosive Q4 all along.
Certainly not a prediction, but this remains my base case for the time being.
Full Premium Video
Summary Setup
Before we jump into the charts, it’s worth reviewing a few ideas we have covered in previous newsletter editions to set the scene:
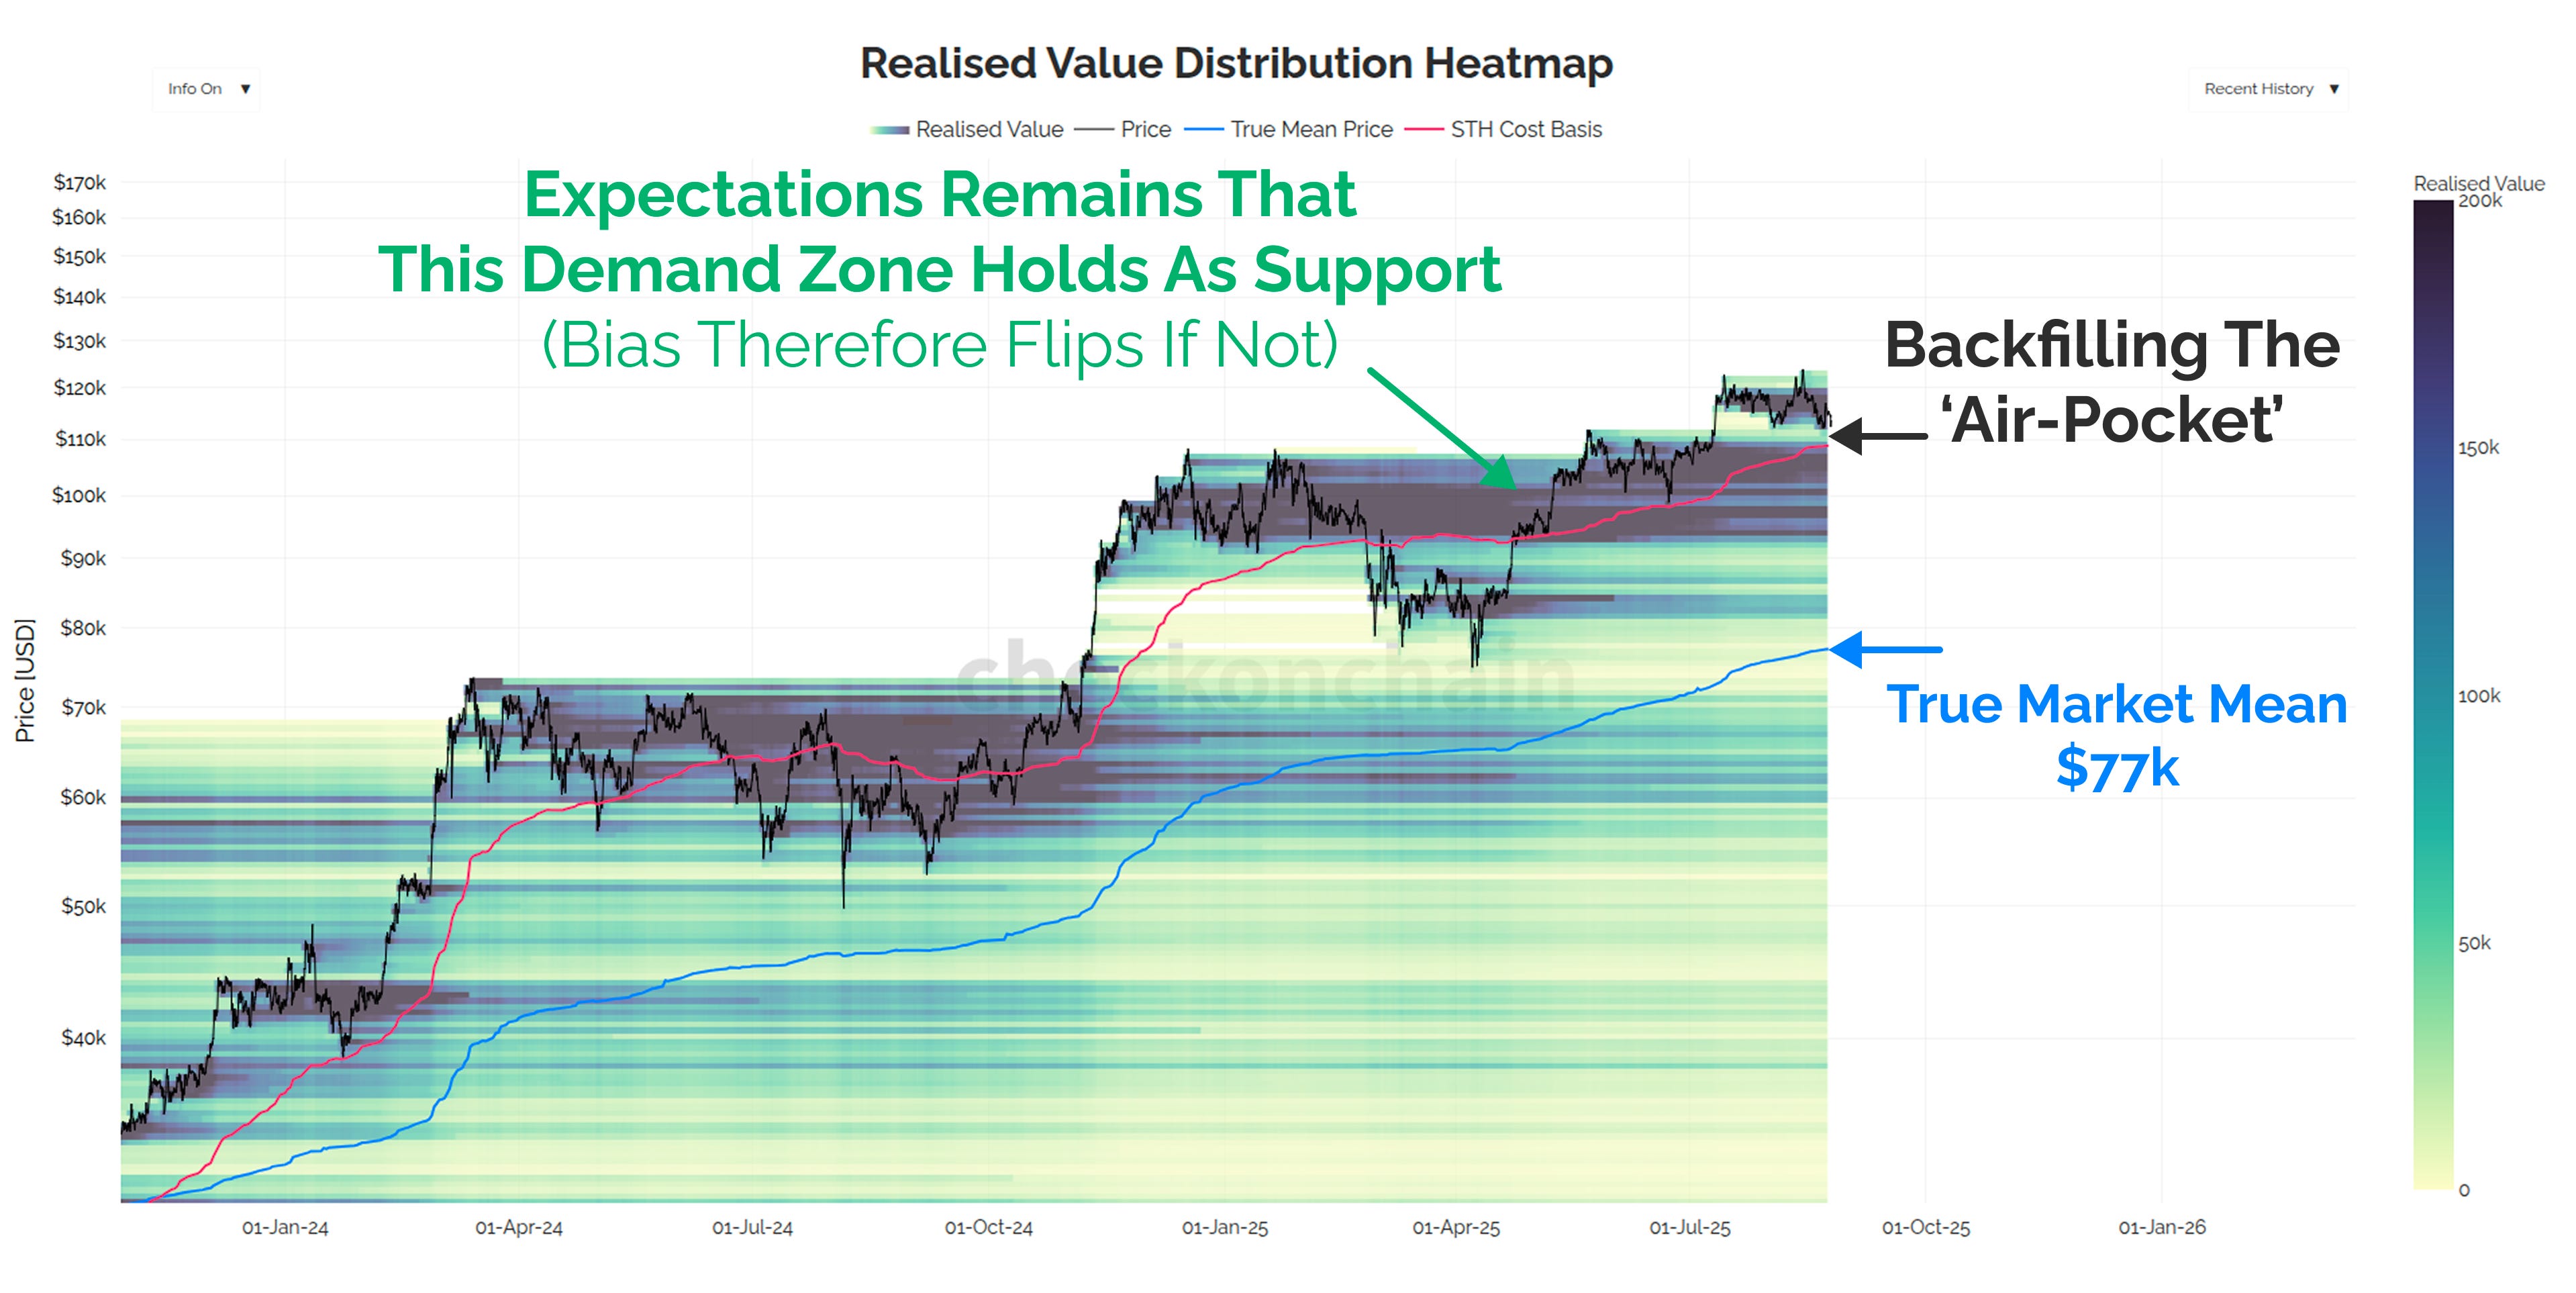
In Damage Report, I highlighted the ‘air-pocket’ between $116k and $110k, which for whatever reason, seems to be a magnet for the market to back-test. This is a pattern we have seen several times this cycle, and honestly, a retest of the ATH break-out level is far from unexpected.
In Time-In-The-Market, we saw that the classic 4yr cycle is almost up, and both of the prior cycles have peaked somewhere between 30 and 120-days from here.
In Soft Around The Edges, it became apparent that we just didn’t have the demand influx we wanted to see, especially coming from the ETFs and Treasury Companies.
I also flagged that we have a lot more degenerate long-side leverage in the market, and they keep trying to buy the dip (and subsequently proceed to liquidate their accounts).
Finally, in That’s Not A Dip, my read of the correction so far is that it doesn’t really have enough bear market characteristics for me to get too concerned at this stage. Unrealised losses are still very small, and I am still not seeing too much fear or panic in the data.
If I was to summarise my base case, it would be that the weakness we’re currently seeing is a combination of soft demand, and some technical factors like leveraged longs trying to catch falling knives.
We’re still trading above the STH cost basis at $108.8k, and that means both Check the Analyst, and Check the HODLer are allowed to remain structurally bullish.
Short-Term Holding Pattern
Now, from a more tactical near-term vantage point, I think it is likely we will have more weakness from here for a number of reasons.
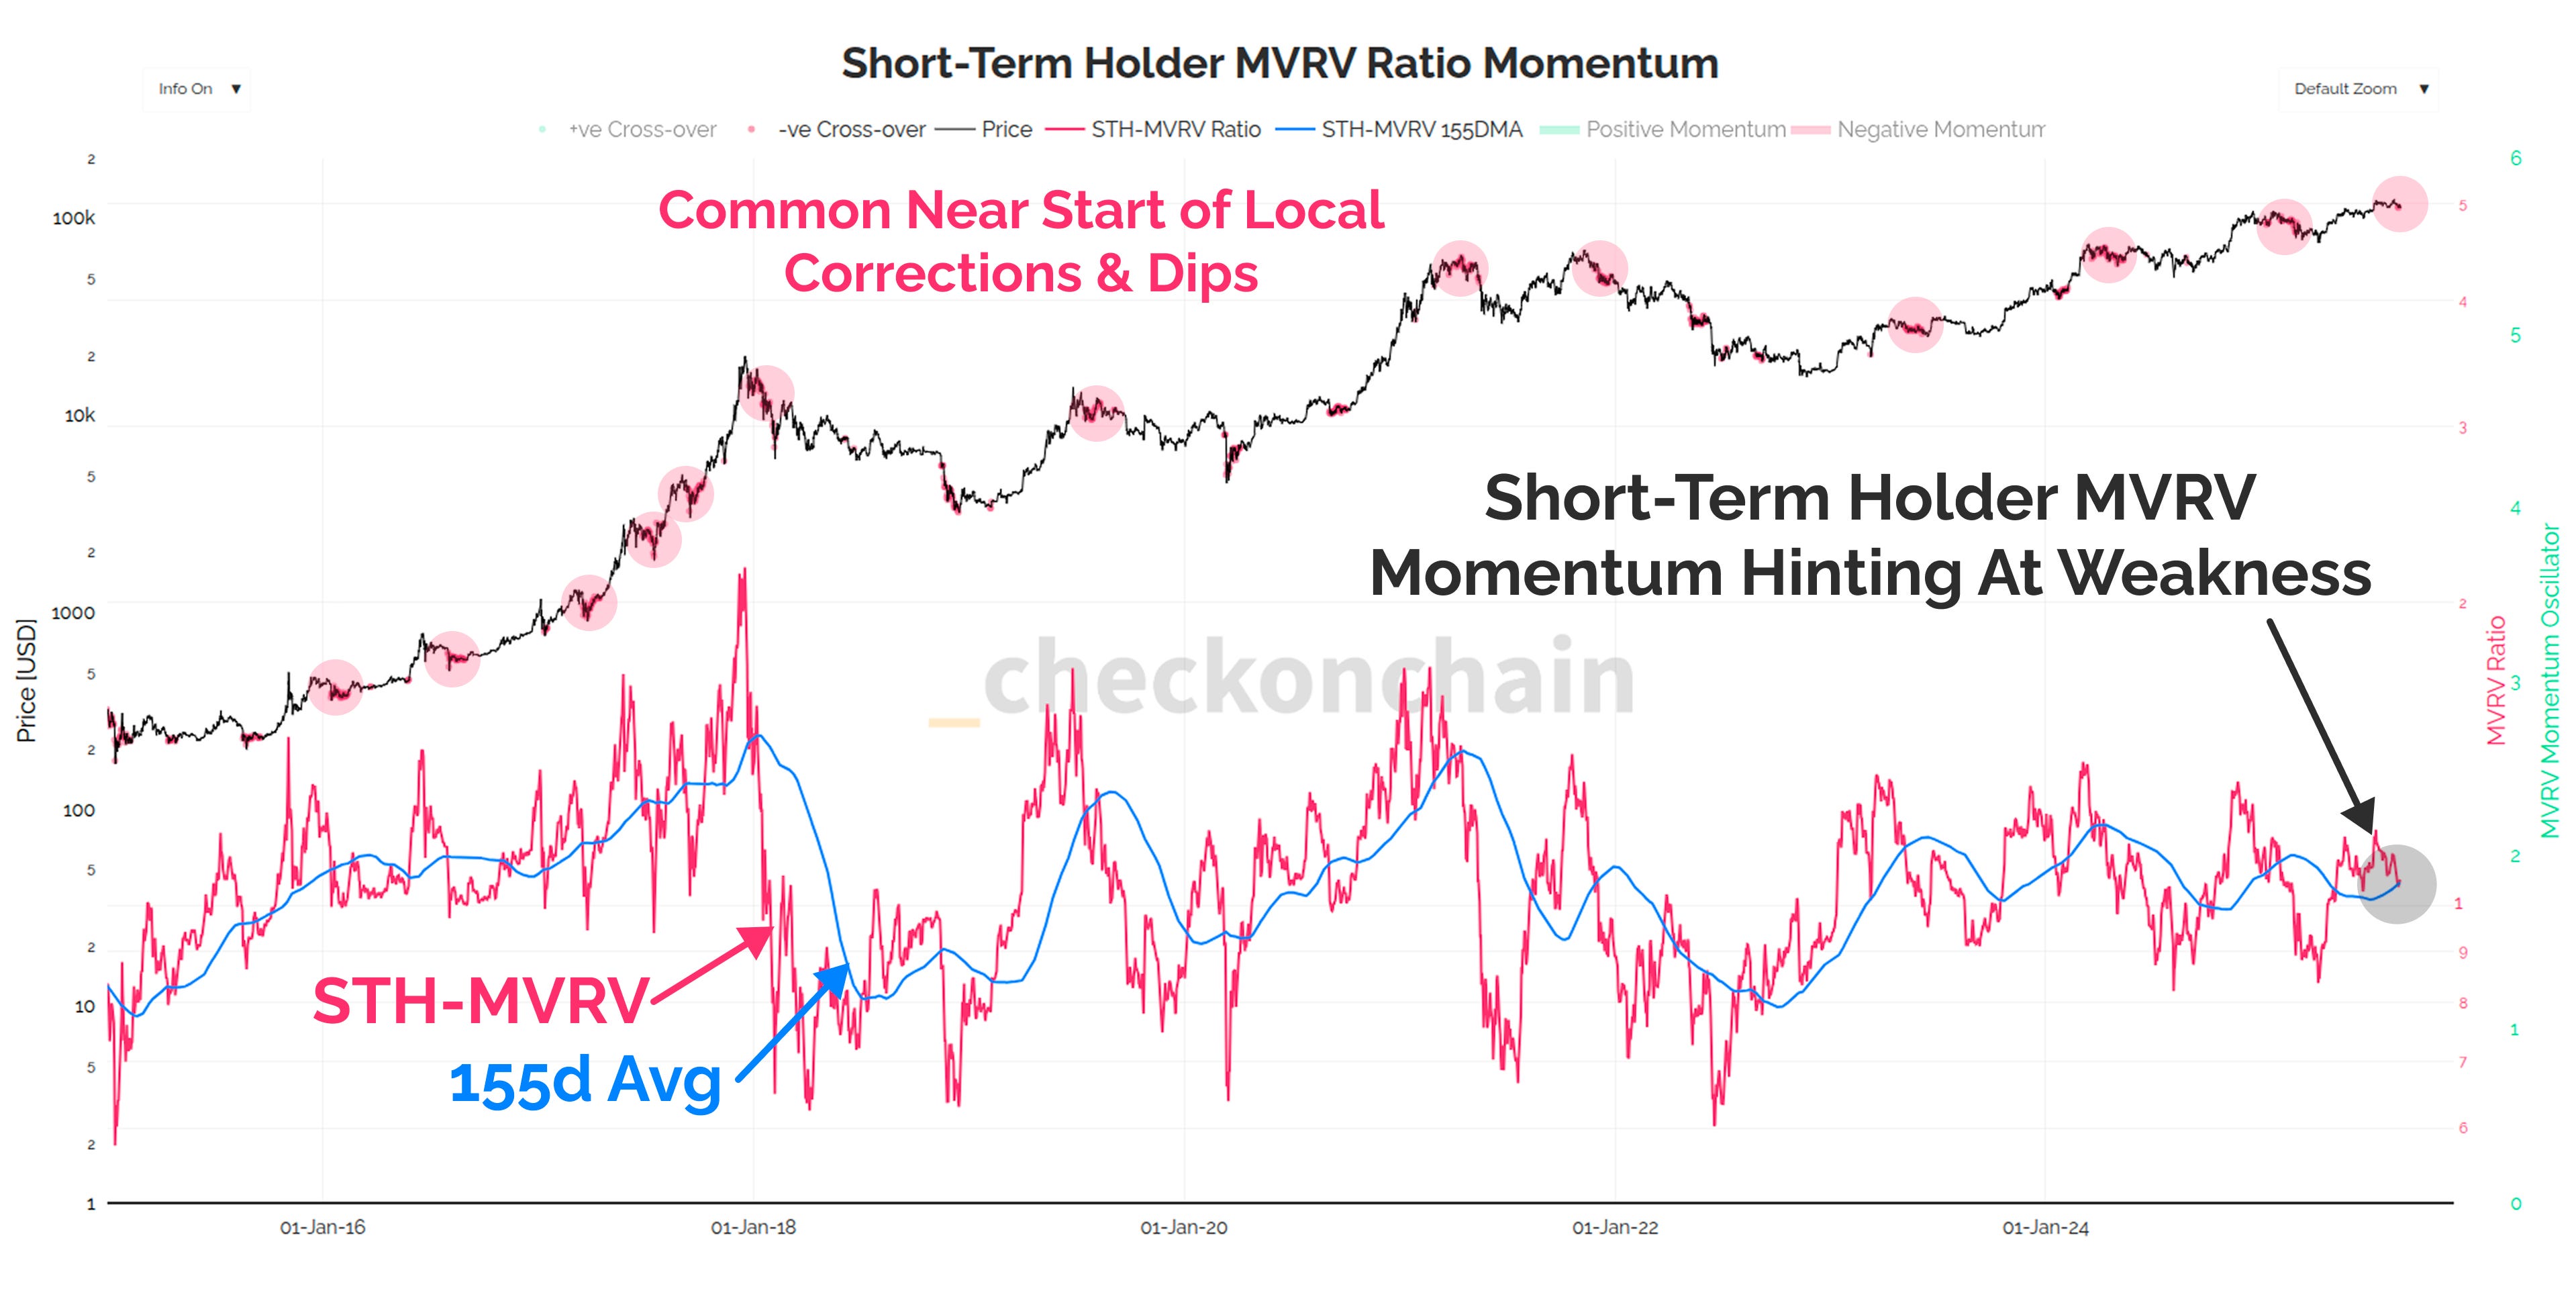
The first is that Short-Term Holder MVRV, representing their average unrealised profit multiple, is showing some noteworthy negative momentum.
Whenever STH-MVRV cuts below its 155-day average, it tends to precede a decent enough correction to be worth paying attention to.
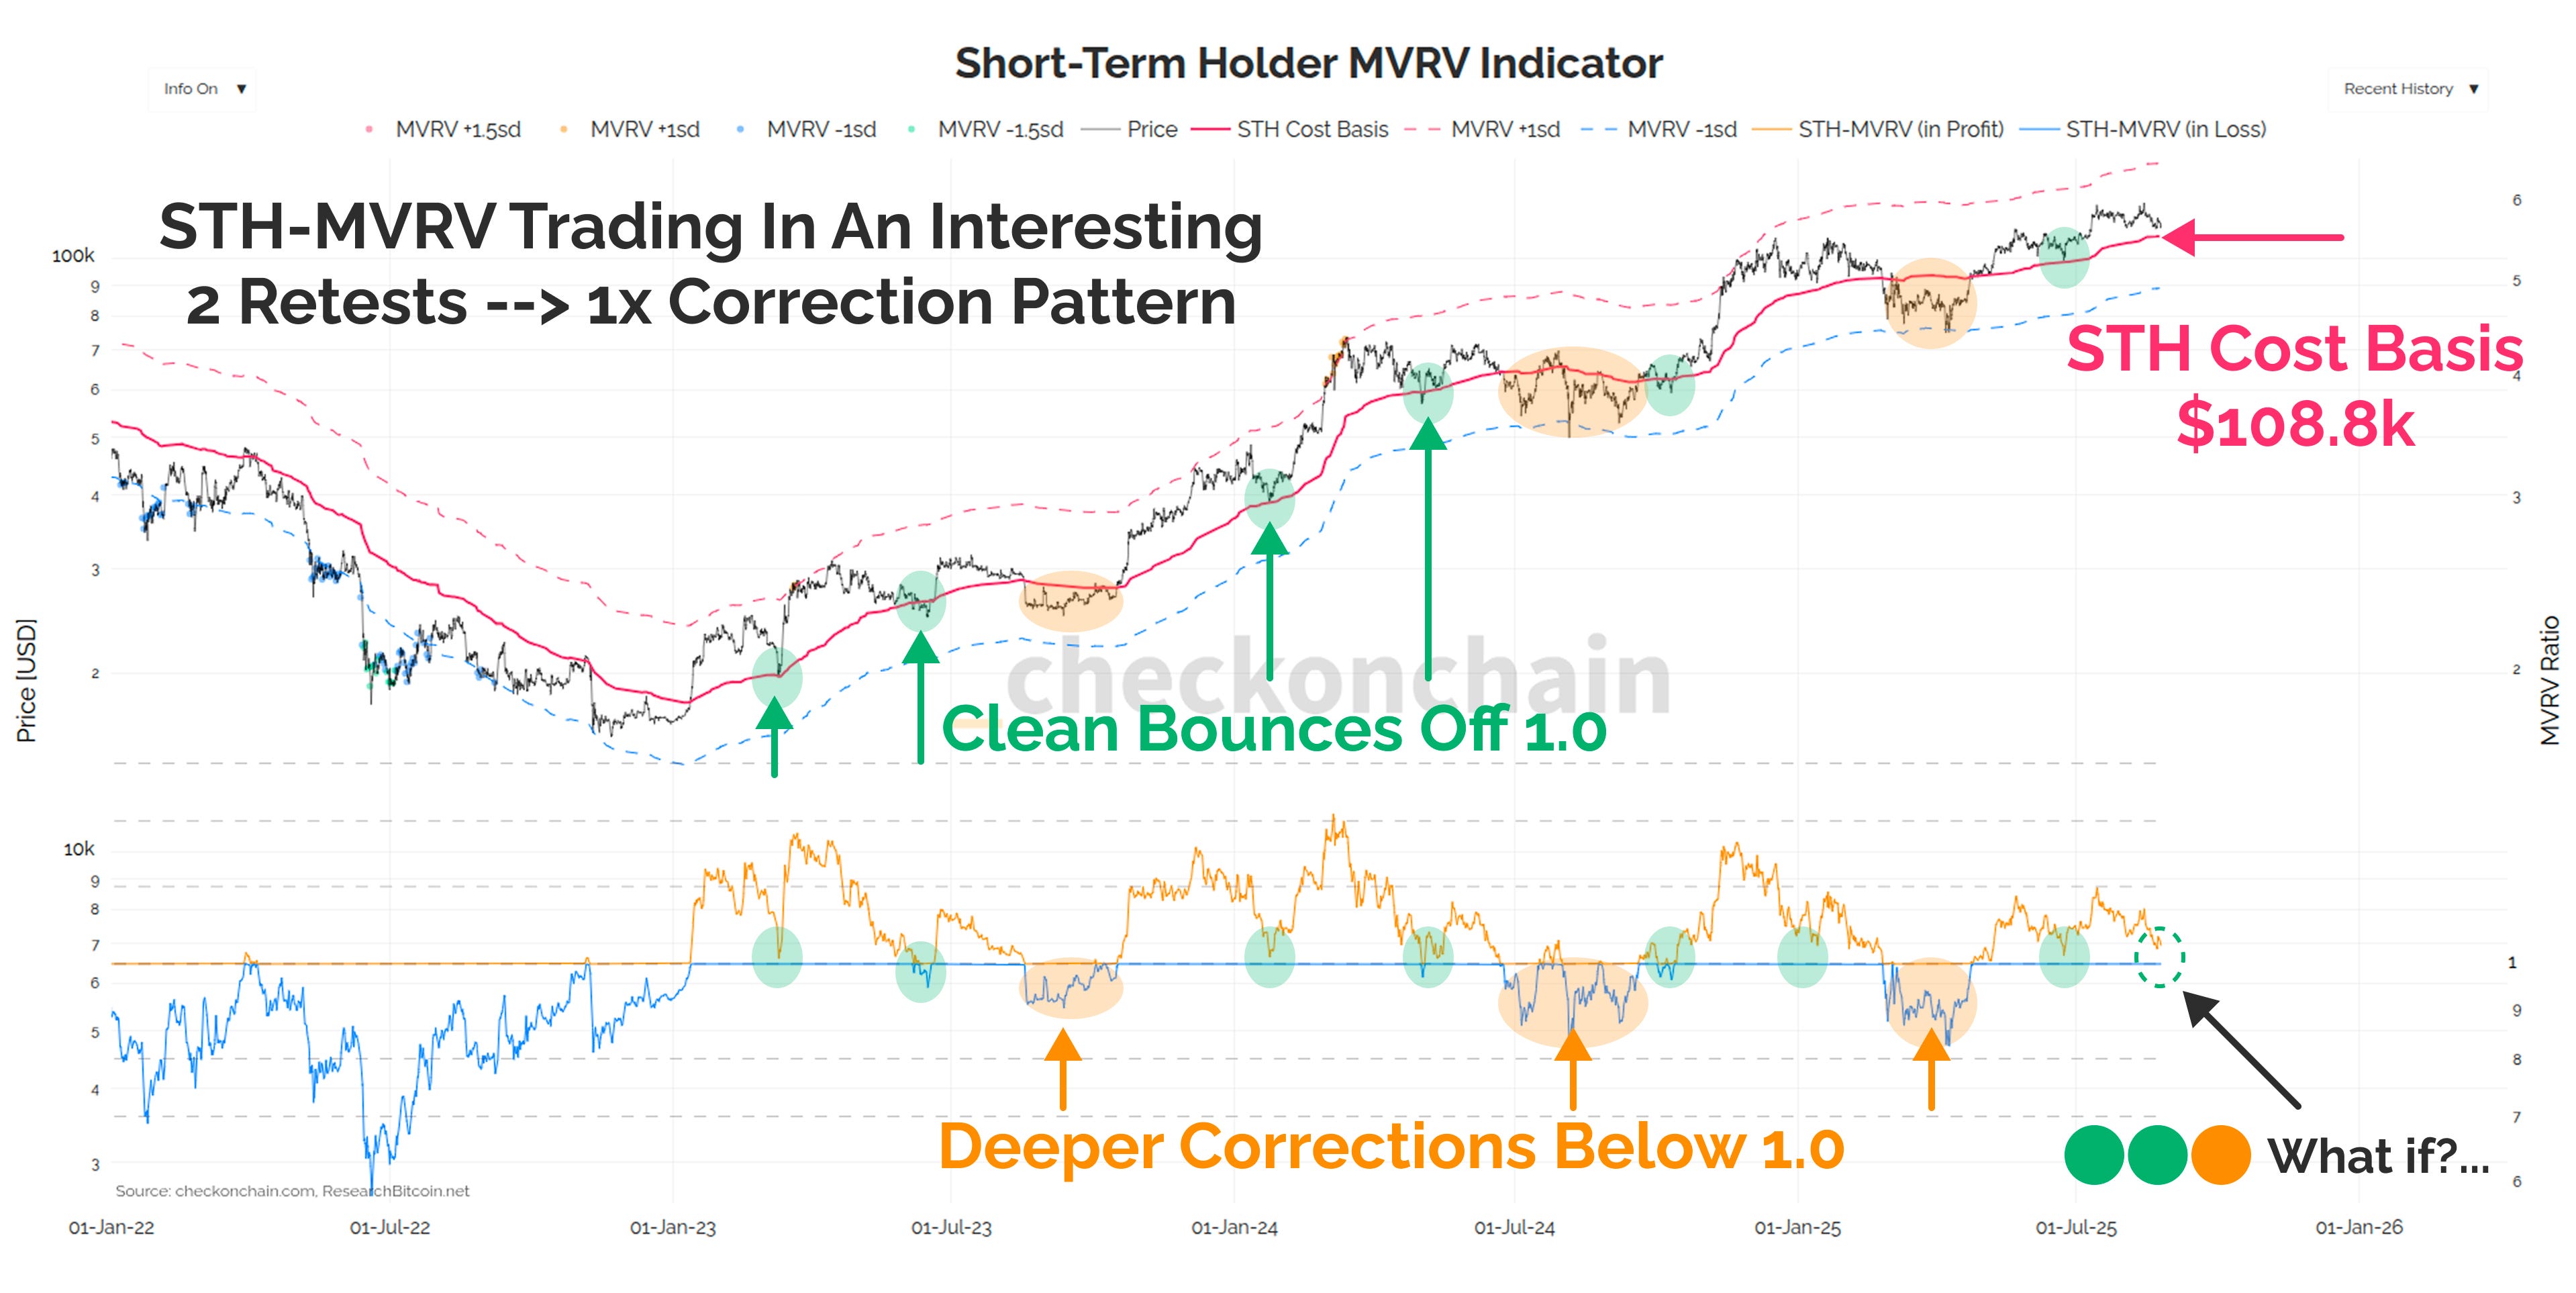
So far this cycle, we have seen an interesting pattern emerge in the way STH-MVRV trades. If we think of STH-MVRV as an oscillator describing how good (or bad) recent buyers are feeling, the sequence thus far has been:
The market starts trending higher, and corrects back to the STH cost basis, which provides almost immediate support 🟢.
We bounce, and the next rally starts to generate FOMO, so the second retest of the STH cost basis is immediately bought by momentum traders 🟢.
Finally, we hit a meaningful local peak, and momentum fades. We enter a period of chopsolidation, and dips tend to keep on dipping (albeit far shallower than in previous cycles). STH-MVRV finally trades below 1.0, but bottoms out around 0.8 (a -20% discount to the STH cost basis)🟠.
If we were to see this 🟢🟢🟠 pattern repeat, it would suggest a revisit to a the 108k zone, followed by a serious bounce higher into a more serious peak.
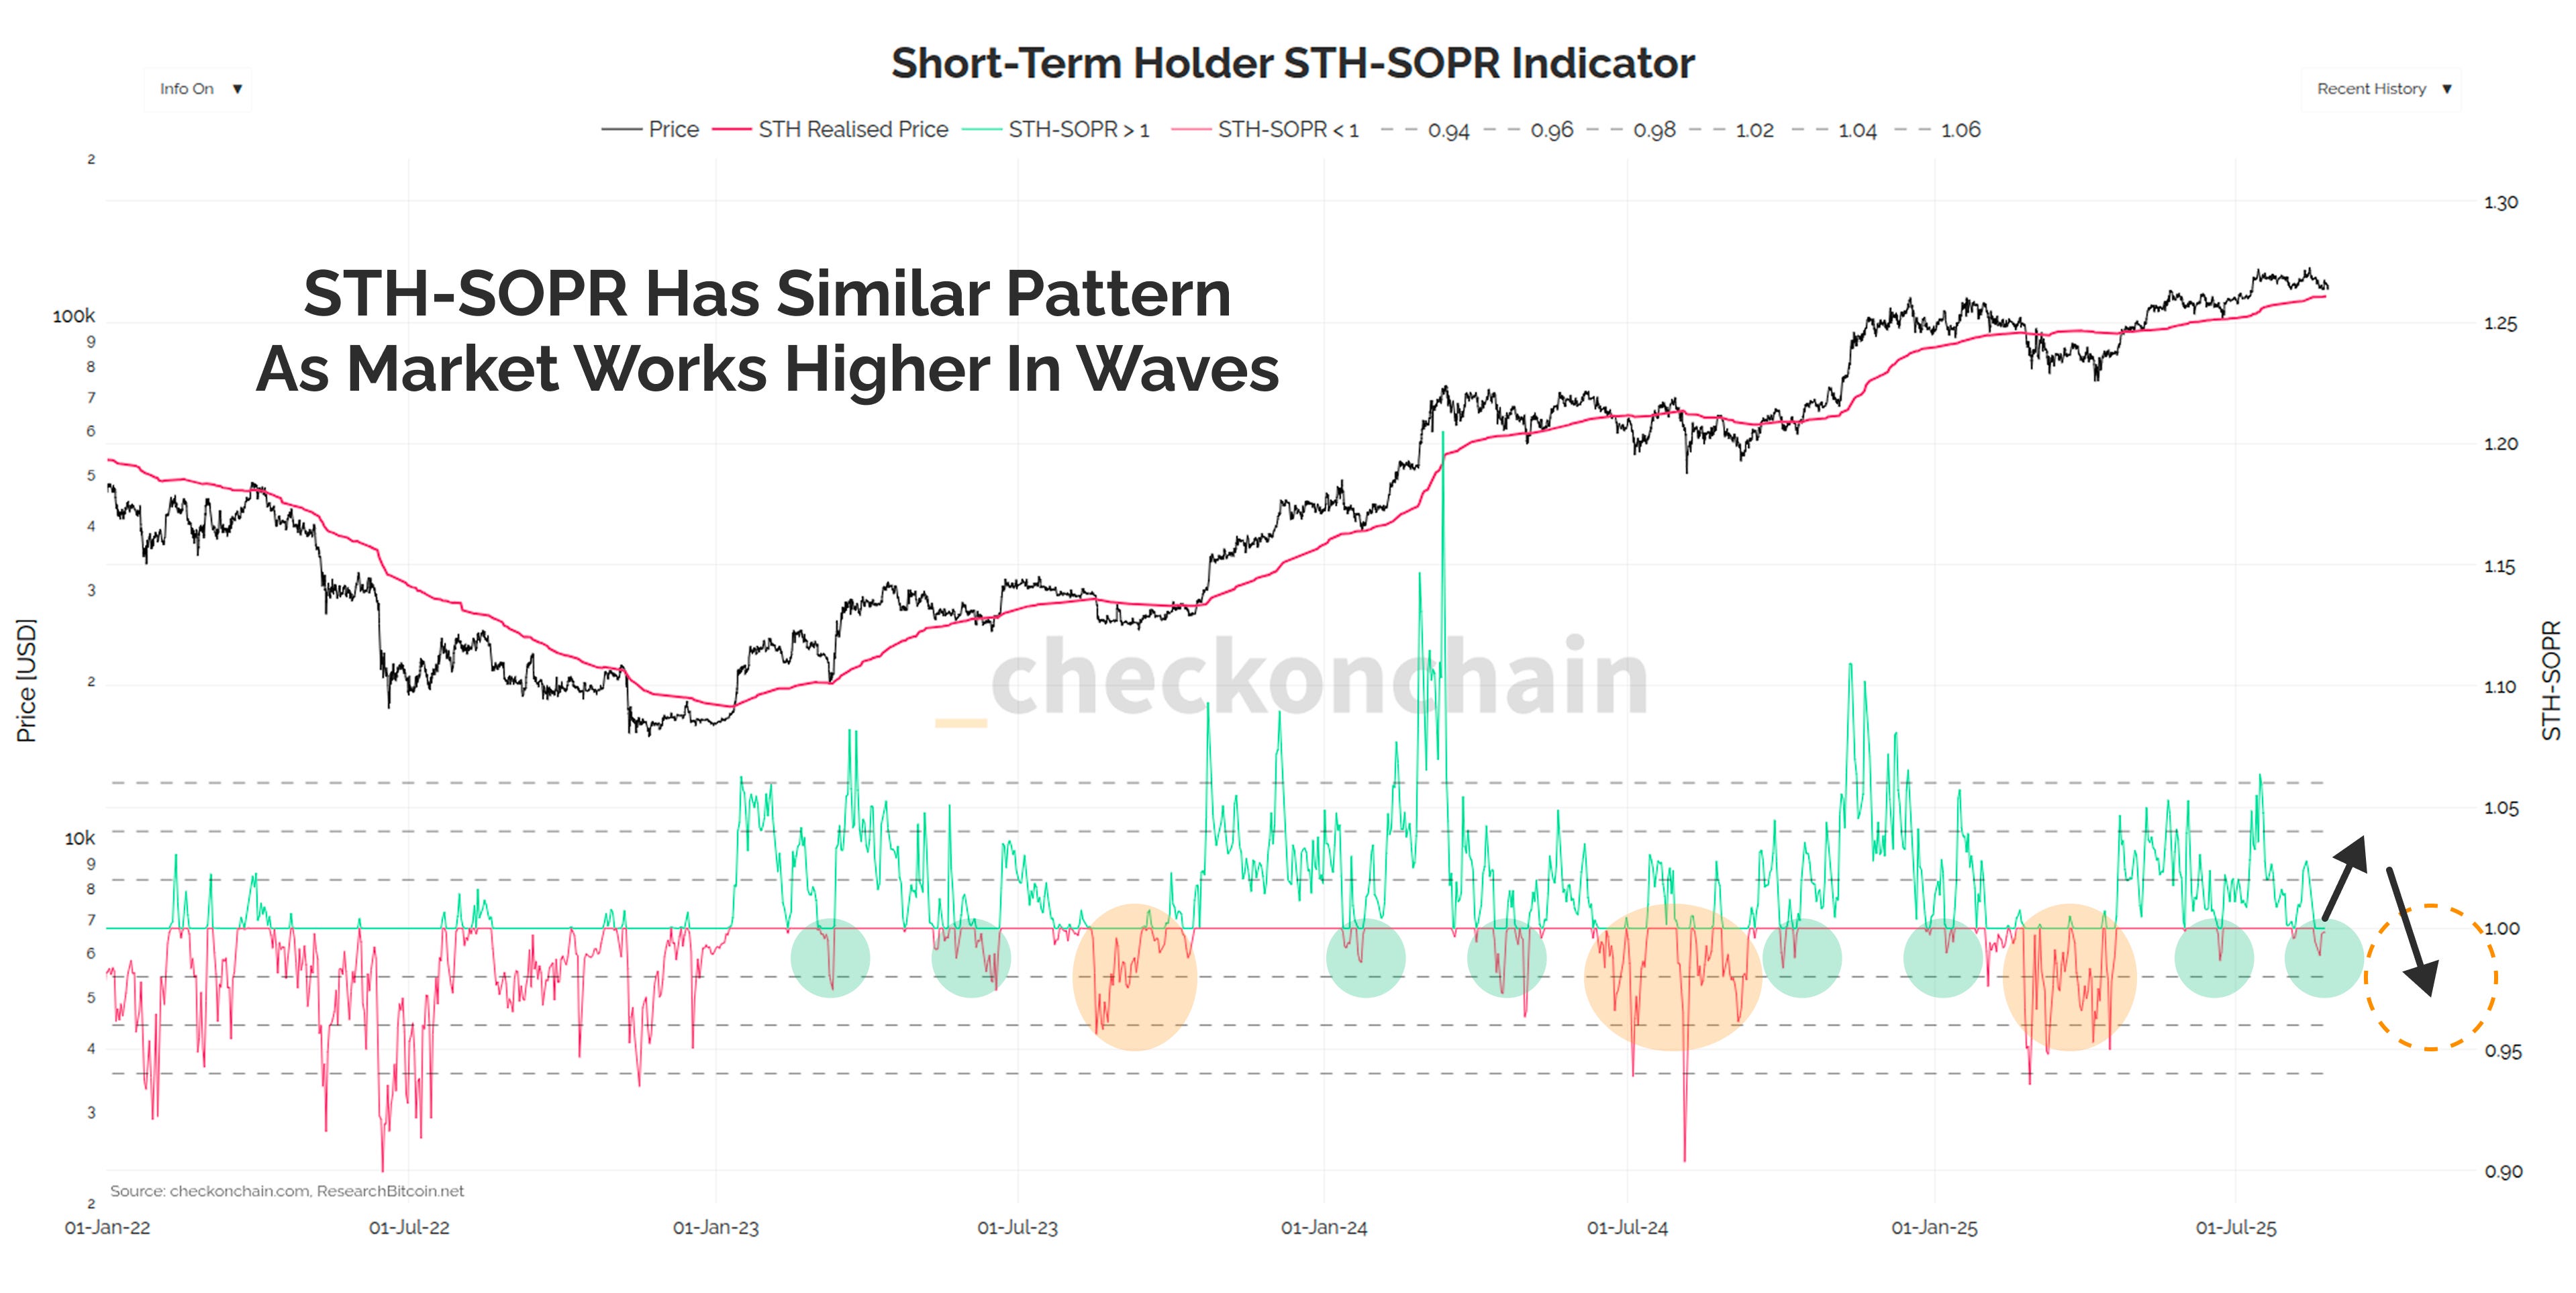
The sister metric, STH-SOPR, is trading in a very similar 🟢🟢🟠 pattern to MVRV. I have no doubt that folks who engage in technical analysis could draw parallels in this price pattern to some kind of Elliot wave, or other common price structure.
The key part is that human emotion, and thus demand tends to come in waves, and counter-trend corrections are actually an important element of any trending market.
In my mental model for the market, there are a few factors behind this:
Dips give traders opportunities to add to their winning position, and for HODLers to stack sats at a discount.
FOMO starts to kick in after folks miss the first and second moves higher, causing them to buy too much when the trend is nearing exhaustion.
At the bottom of 🟠-grade corrections, the bears start to get overconfident, and after liquidating three accounts trying to long the dip, they finally flip and start shorting the bottom.
Whilst corrections can be frustrating and take time to play out, Check the HODLer sees them as opportunities to be patient, and allow the market to find its level before making any lump sum decisions.
There is always a cohort of local top buyers who eventually capitulate near the bottom of a dip. Given we’re in price discovery, Short-Term Holders are the only ones who can possibly be underwater at this stage.
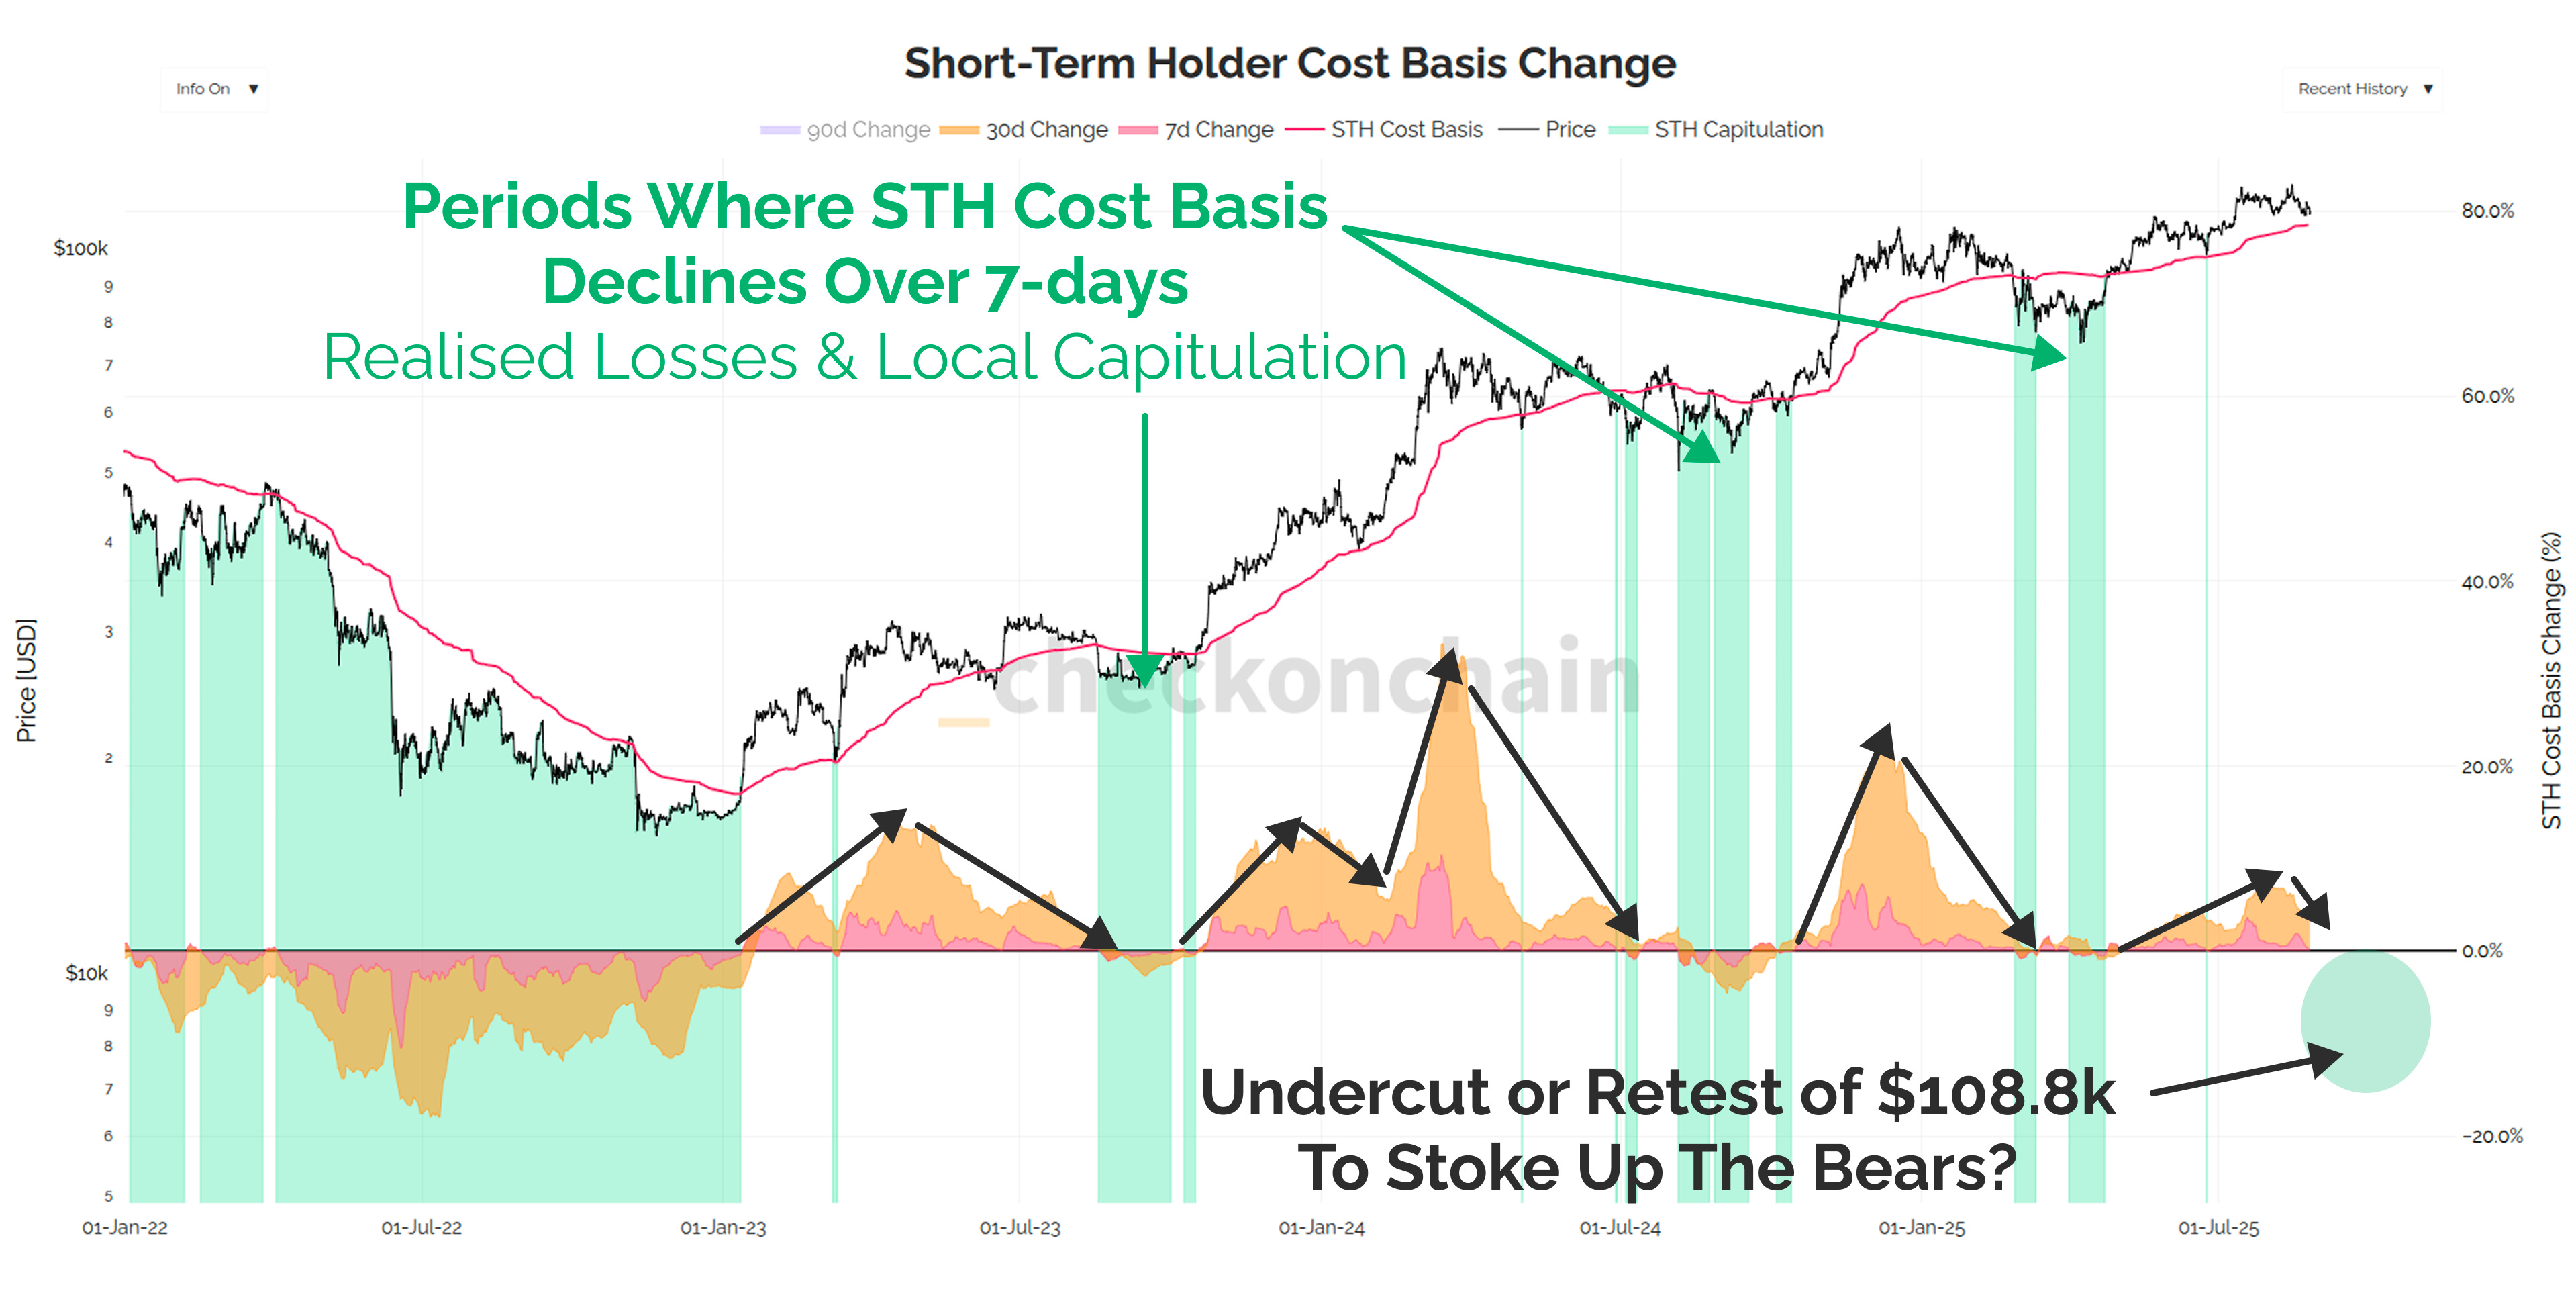
When the folks who bought the current ATH start to capitulate, STH-SOPR will trade well below 1.0, and the STH cost basis will likely experience a period of decline.
The chart below highlights in green when this STH cost basis decline occurs over a 7-day window, and is a tool Check the HODLer consults often when he’s looking to stack sats at a discount.
A picture perfect projection of the future, would be a dip down to ~$108k, at which point I think the bears will explode with joy, and start shorting the bottom. Local top buyers will capitulate in fear, believing the top is now well and truly in.
Until proven otherwise, this is the environment when Check the HODLer would be very willing to take a bite of the cherry, because all of this is well within the expected scope for a bull market correction.
If this happens, $108k may well not be the bottom of this correction, but it is the first threshold for the decisions Check the HODLer is making in advance, and will execute irrespective of whatever else the market is doing at the time.
Speculators Still Catching Falling Knives
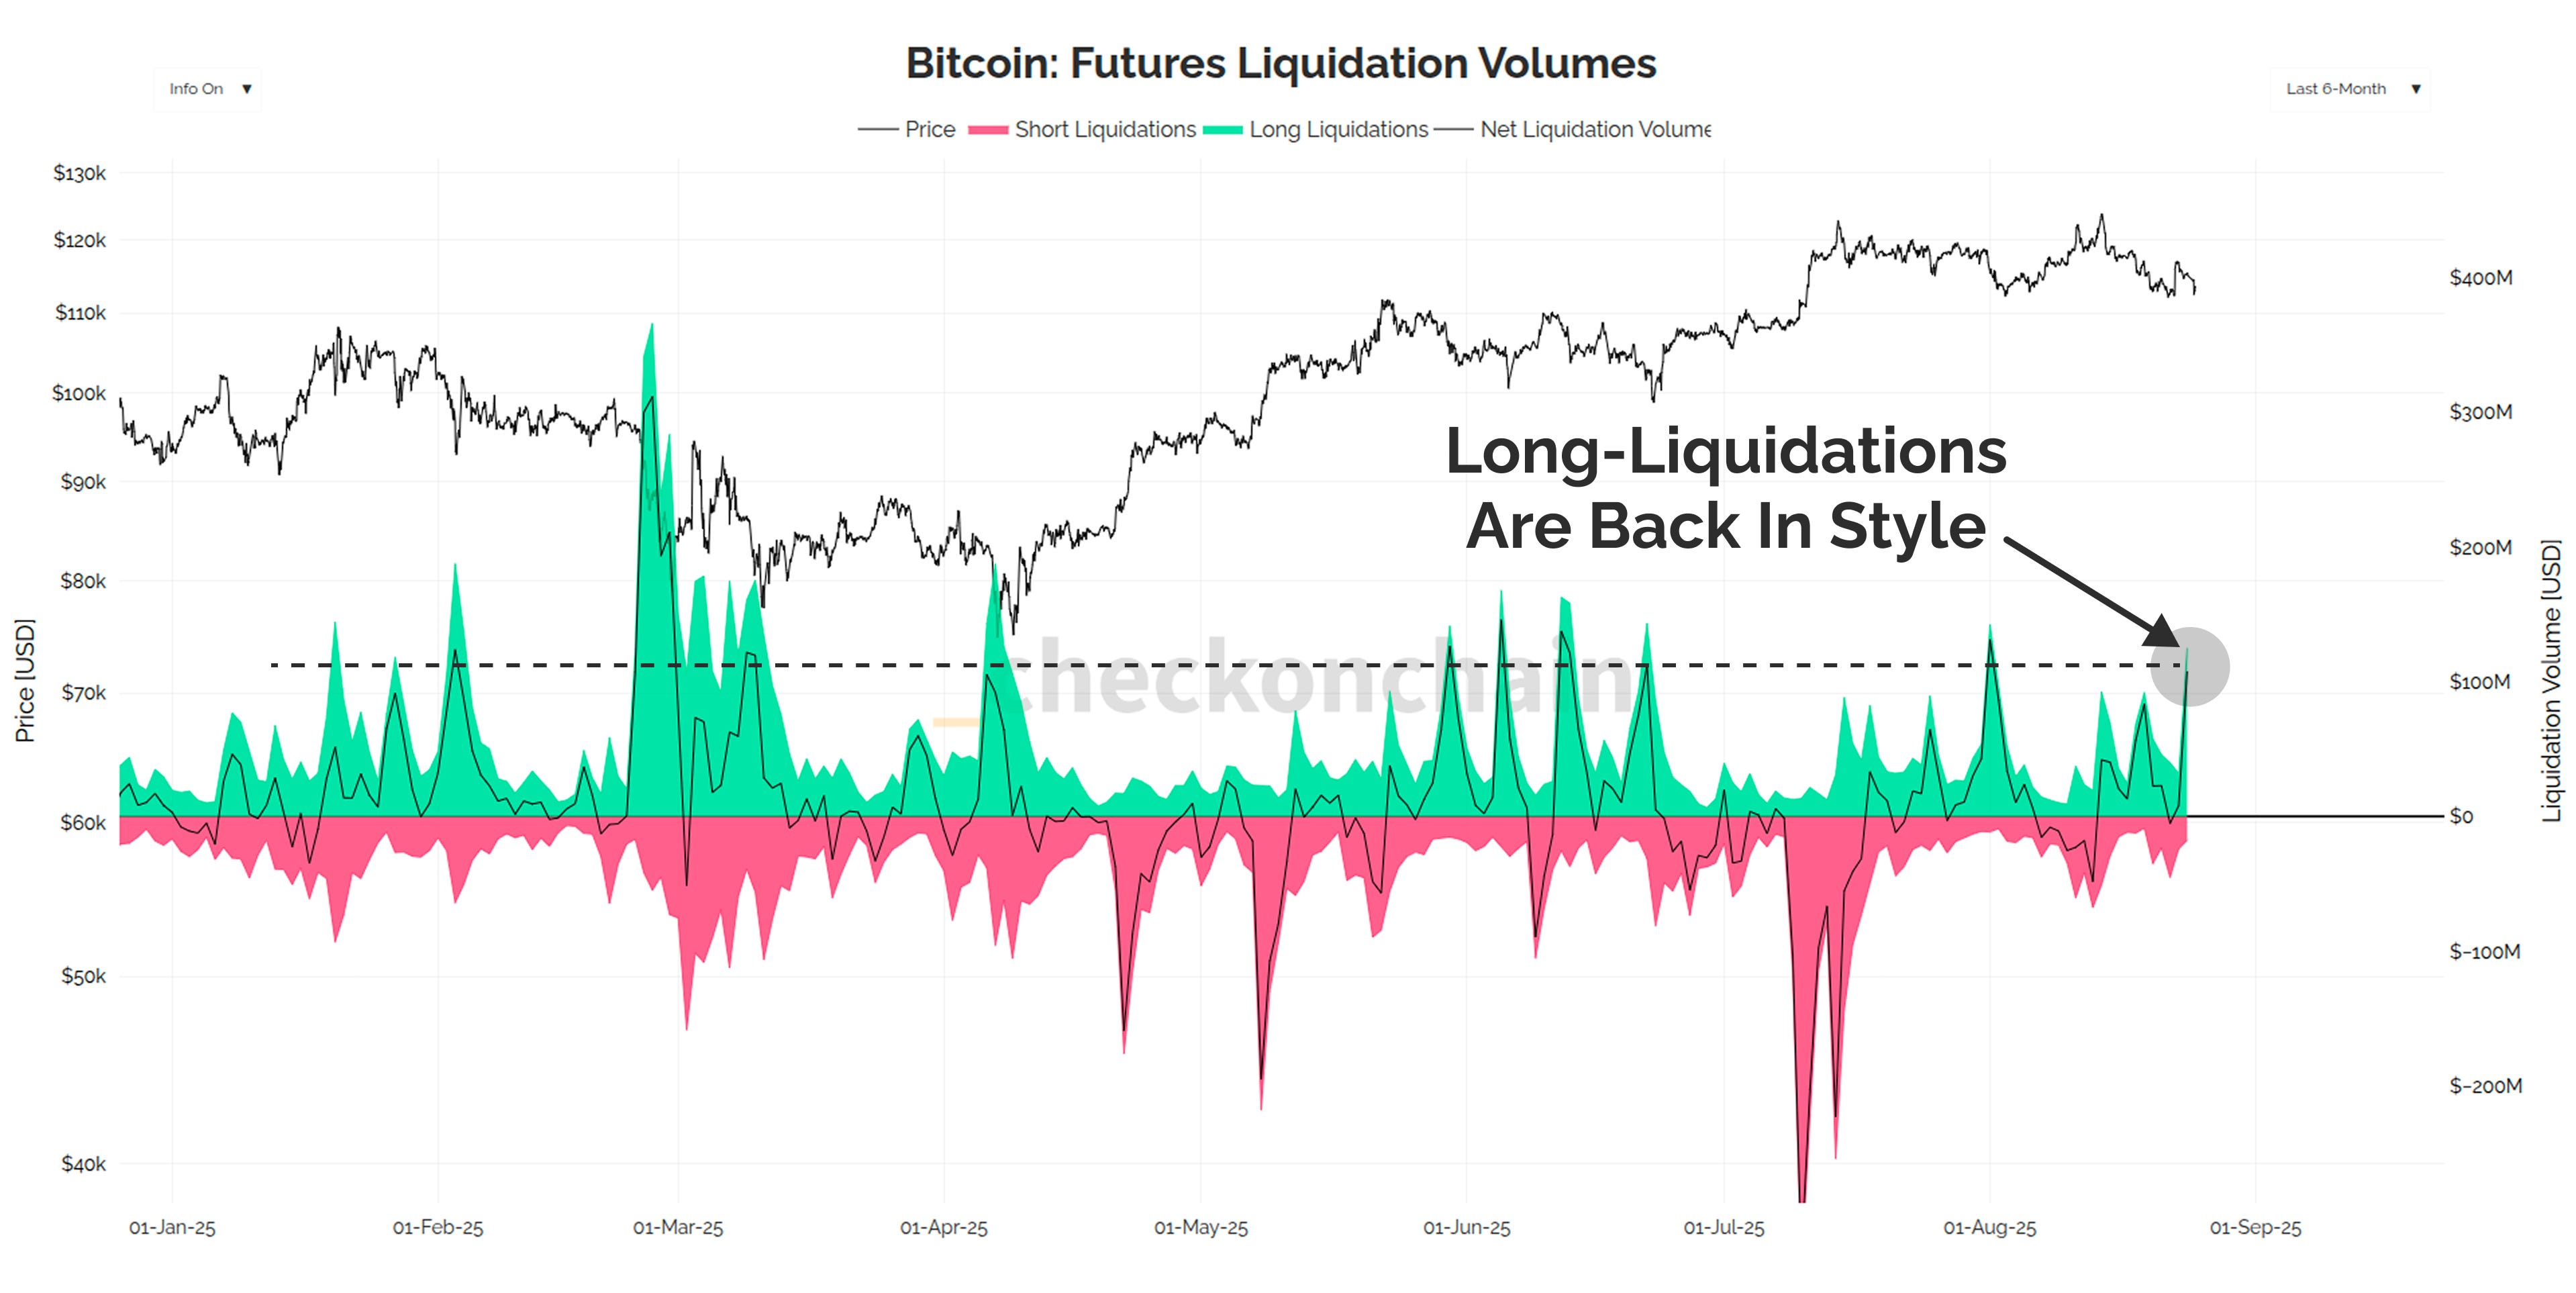
Speculators and traders in futures markets are still trying to long the bottom, and long-side liquidations are spiking higher as a result.
When the degenerate gamblers are still bullish enough to long the bottom, it usually means we haven’t taken out enough stop losses just yet.
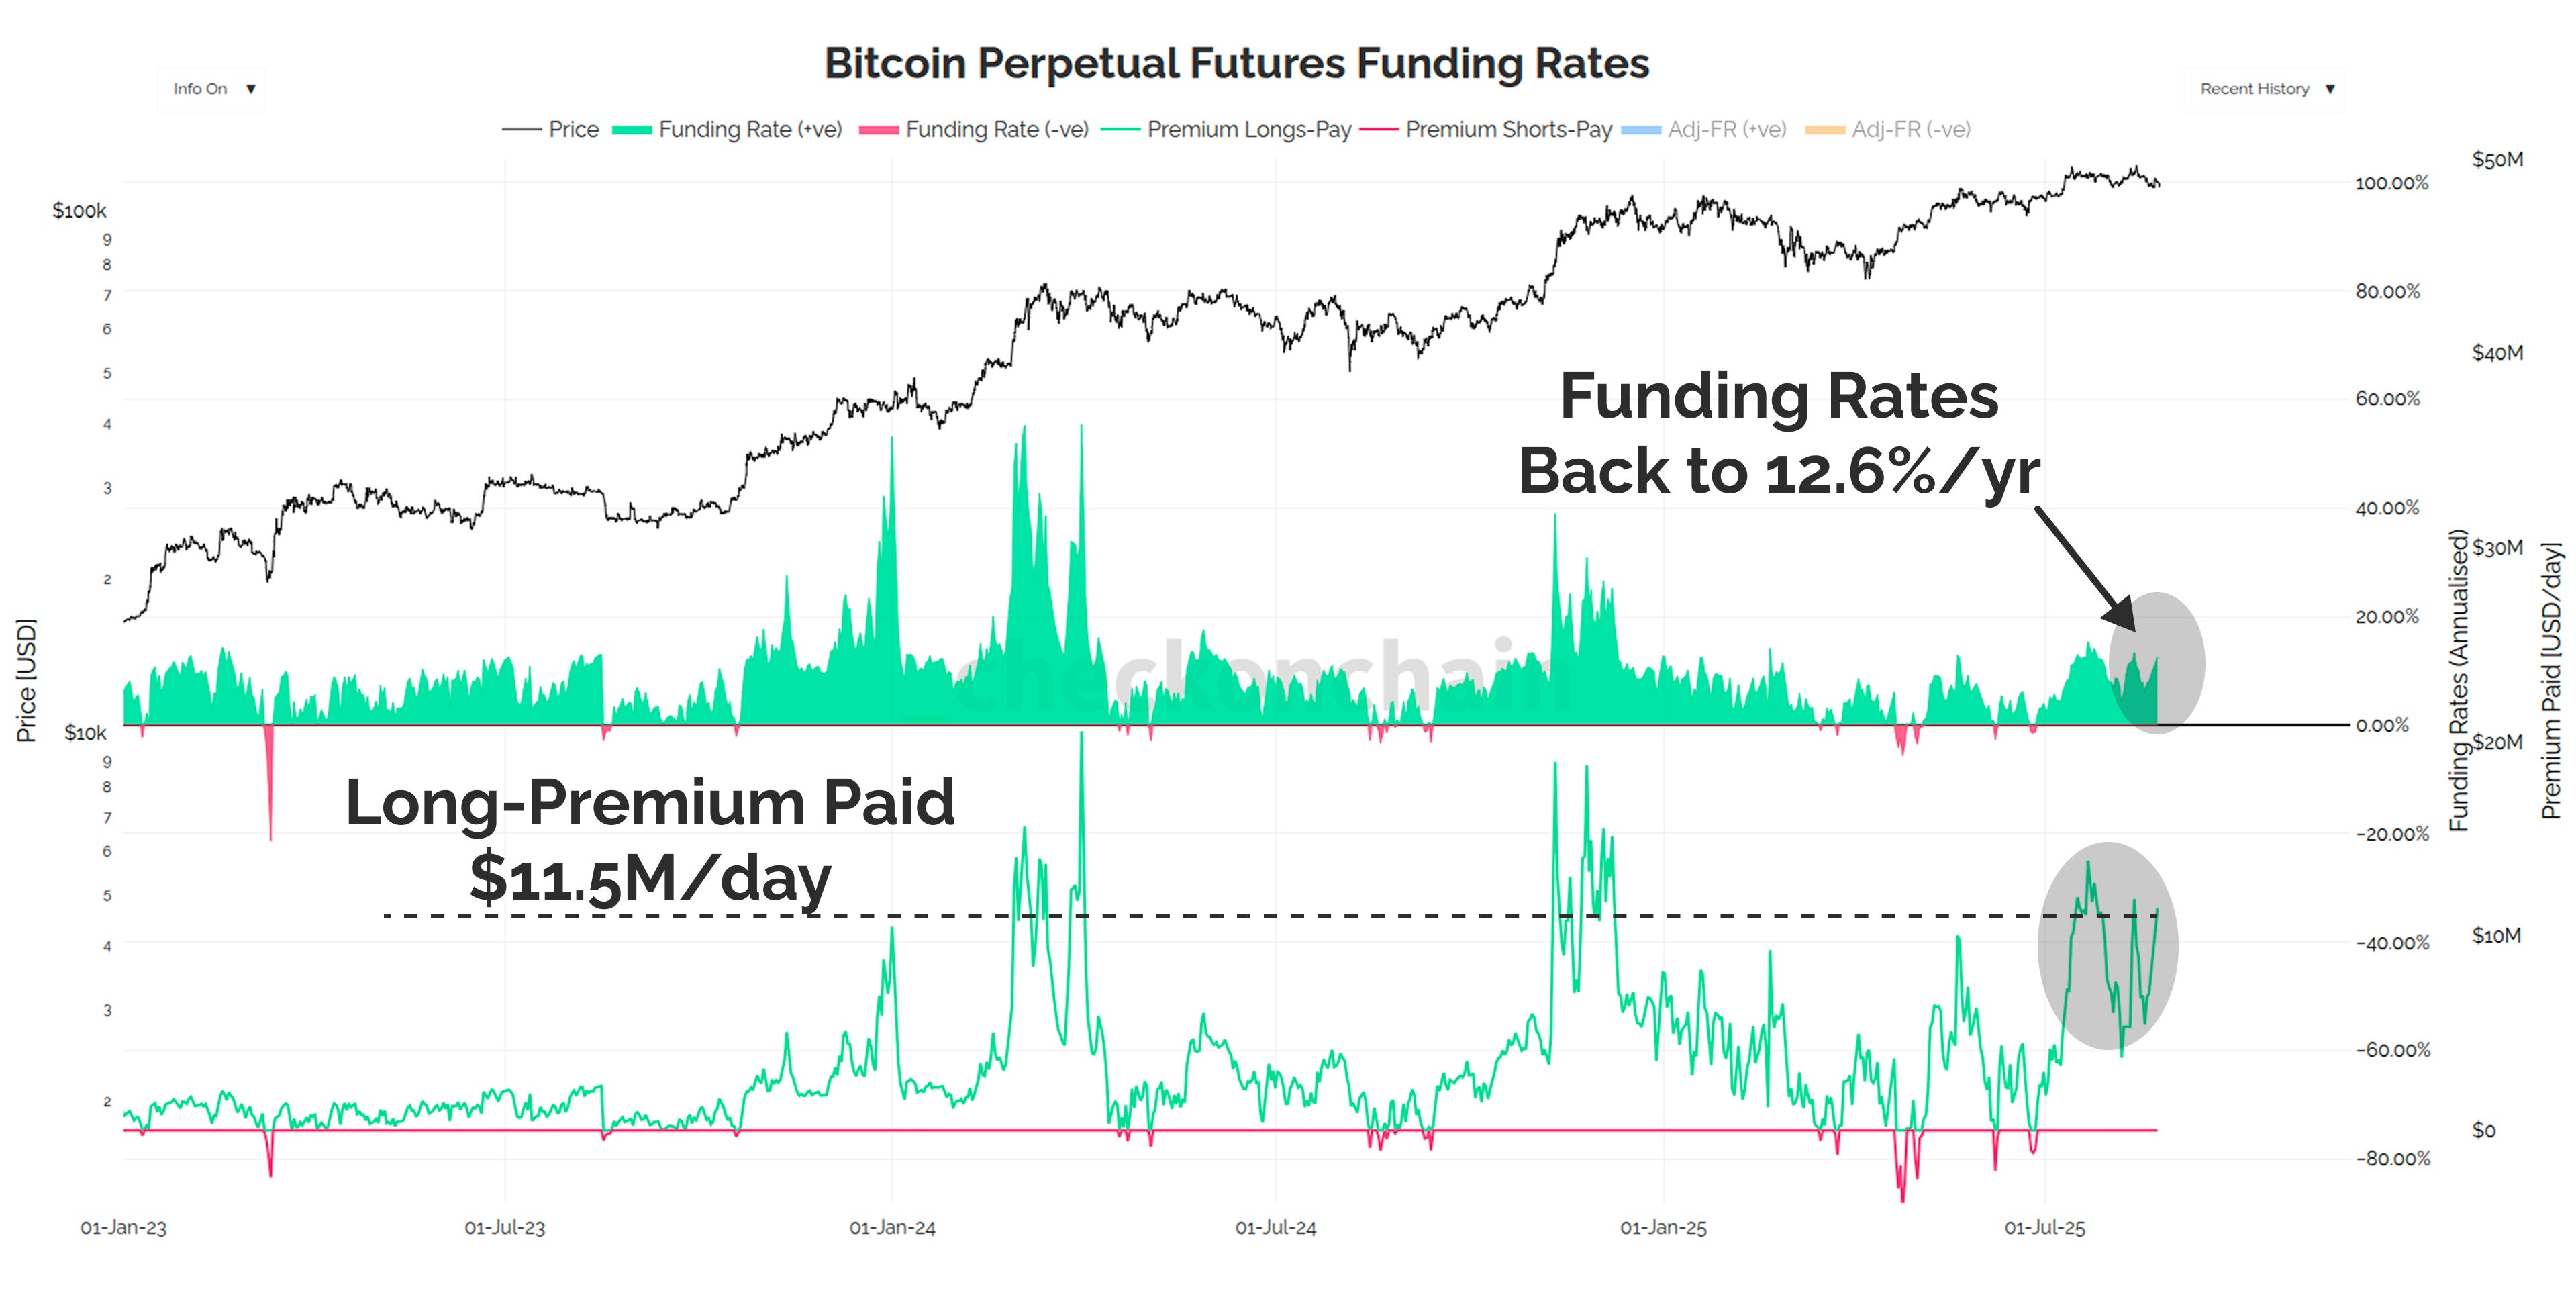
Funding rates have also ripped higher again this week, hitting a relatively high 12.6%/yr, despite the price trading lower. When we weight this by the nearly ATH of $85B in open futures contracts, the premium being paid by longs is back near local highs of $11.5M/day.
There is still too much long-sided leverage in the market for my liking, and I suspect there could be a meaningful wash-out on the road ahead.
My solution for now, is to be patient, and allow this process to run its course.
ETF Flows Stall Out
Some of this long-side leverage might be justified if the demand picture was searing hot, but right now, it just isn’t.
The ETFs saw a pretty sizeable $1.17B in outflows last week, which is the largest since the Tariff Tantrum kicked off back in March.
Whilst outflows of this scale may be concerning at face value, we’re yet to see an extended period of aggressive ETF outflows. One outflow week doesn’t make a trend, and personally, I am impressed that the Bitcoin market regularly absorbs billions dollars of sell-side without visiting Hades below.
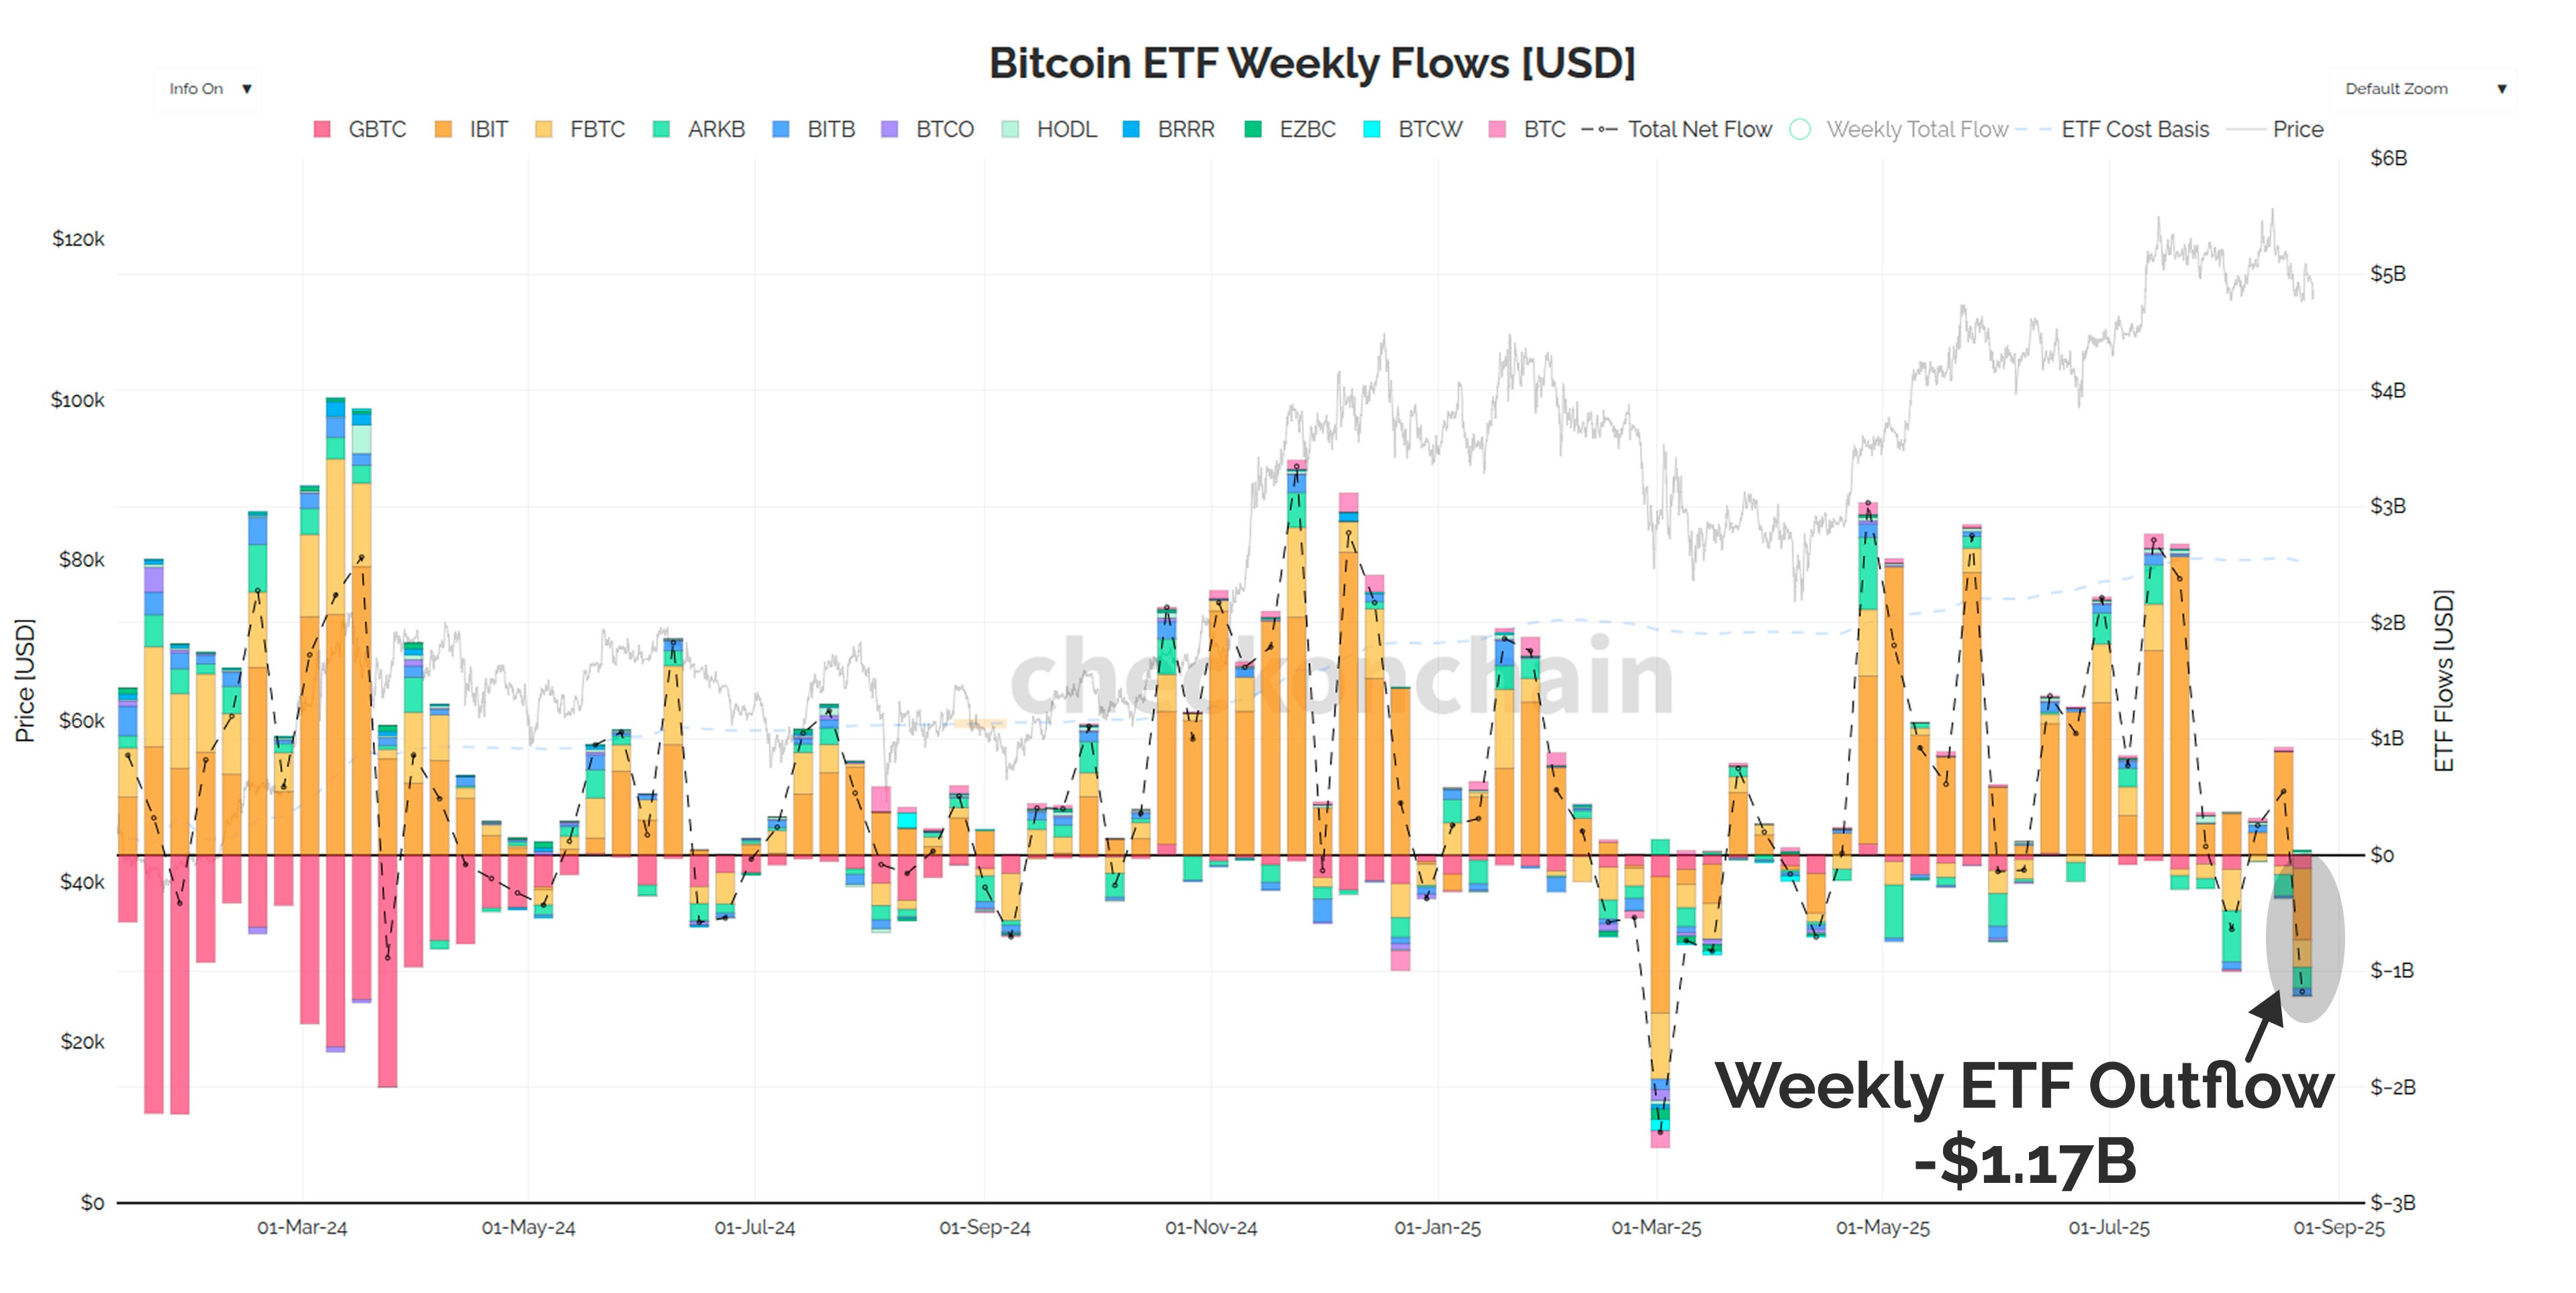
August has been a fairly soft month for the ETFs, and the cumulative inflows have now been flat since late-July. Unsurprisingly, the price has gone sideways over this period.
Note also how similar the cumulative inflow curve is in black, compared to the inflow profile of IBIT in orange.
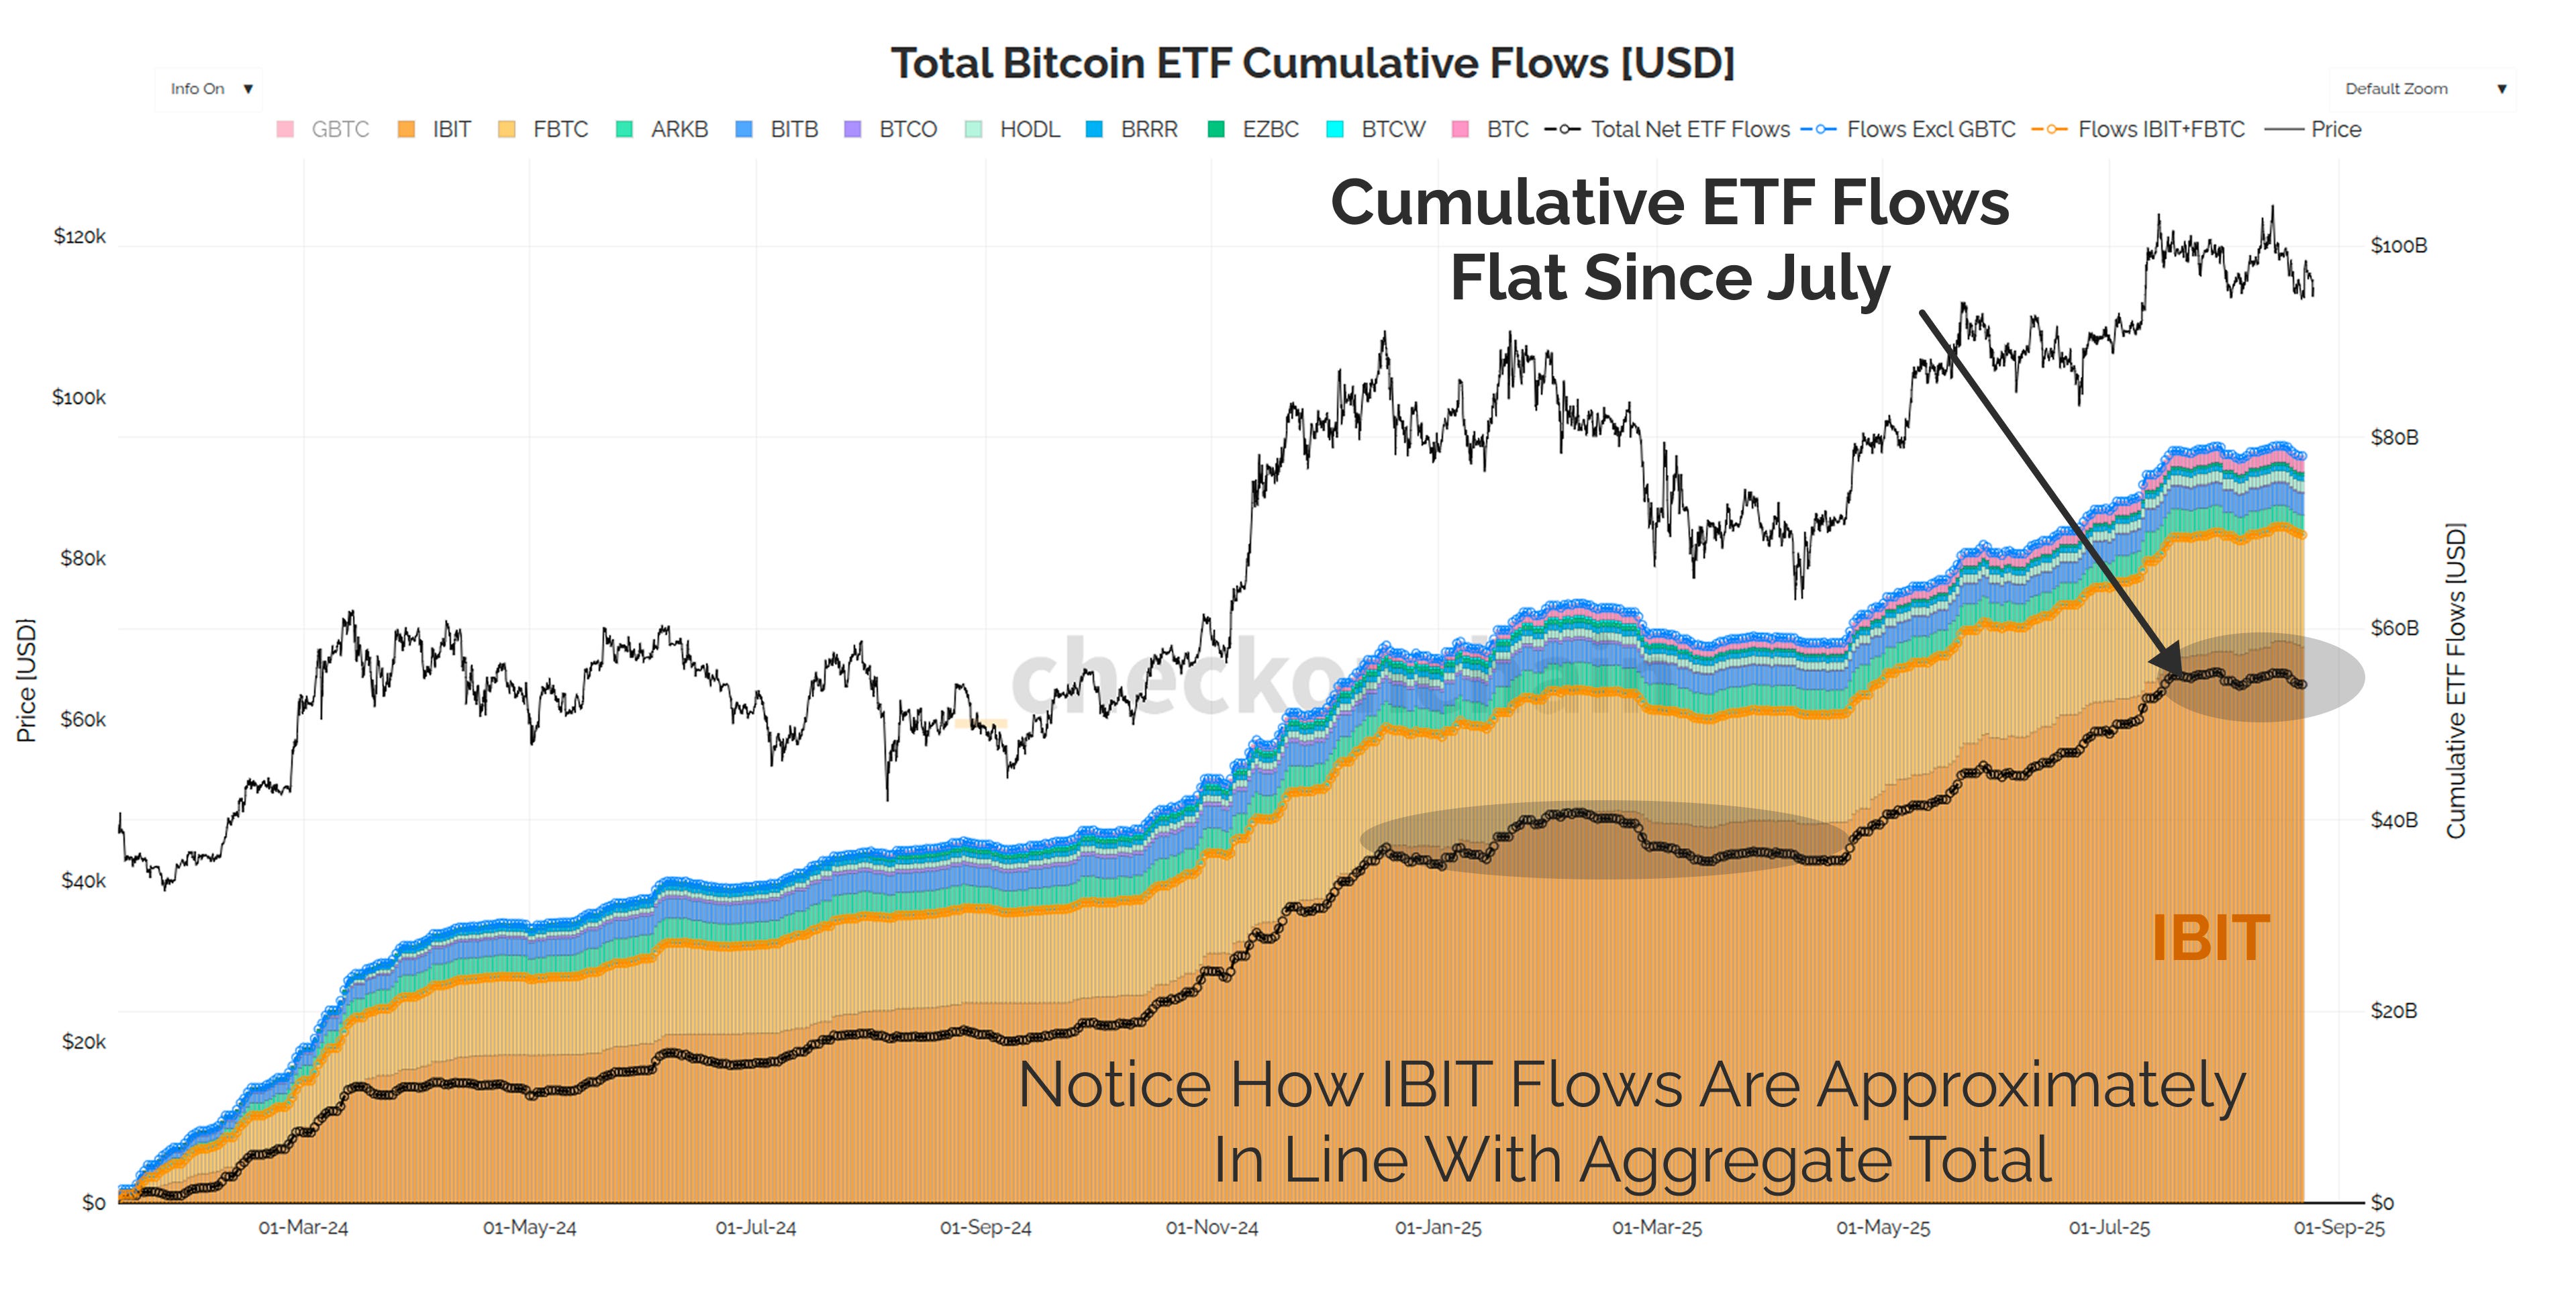
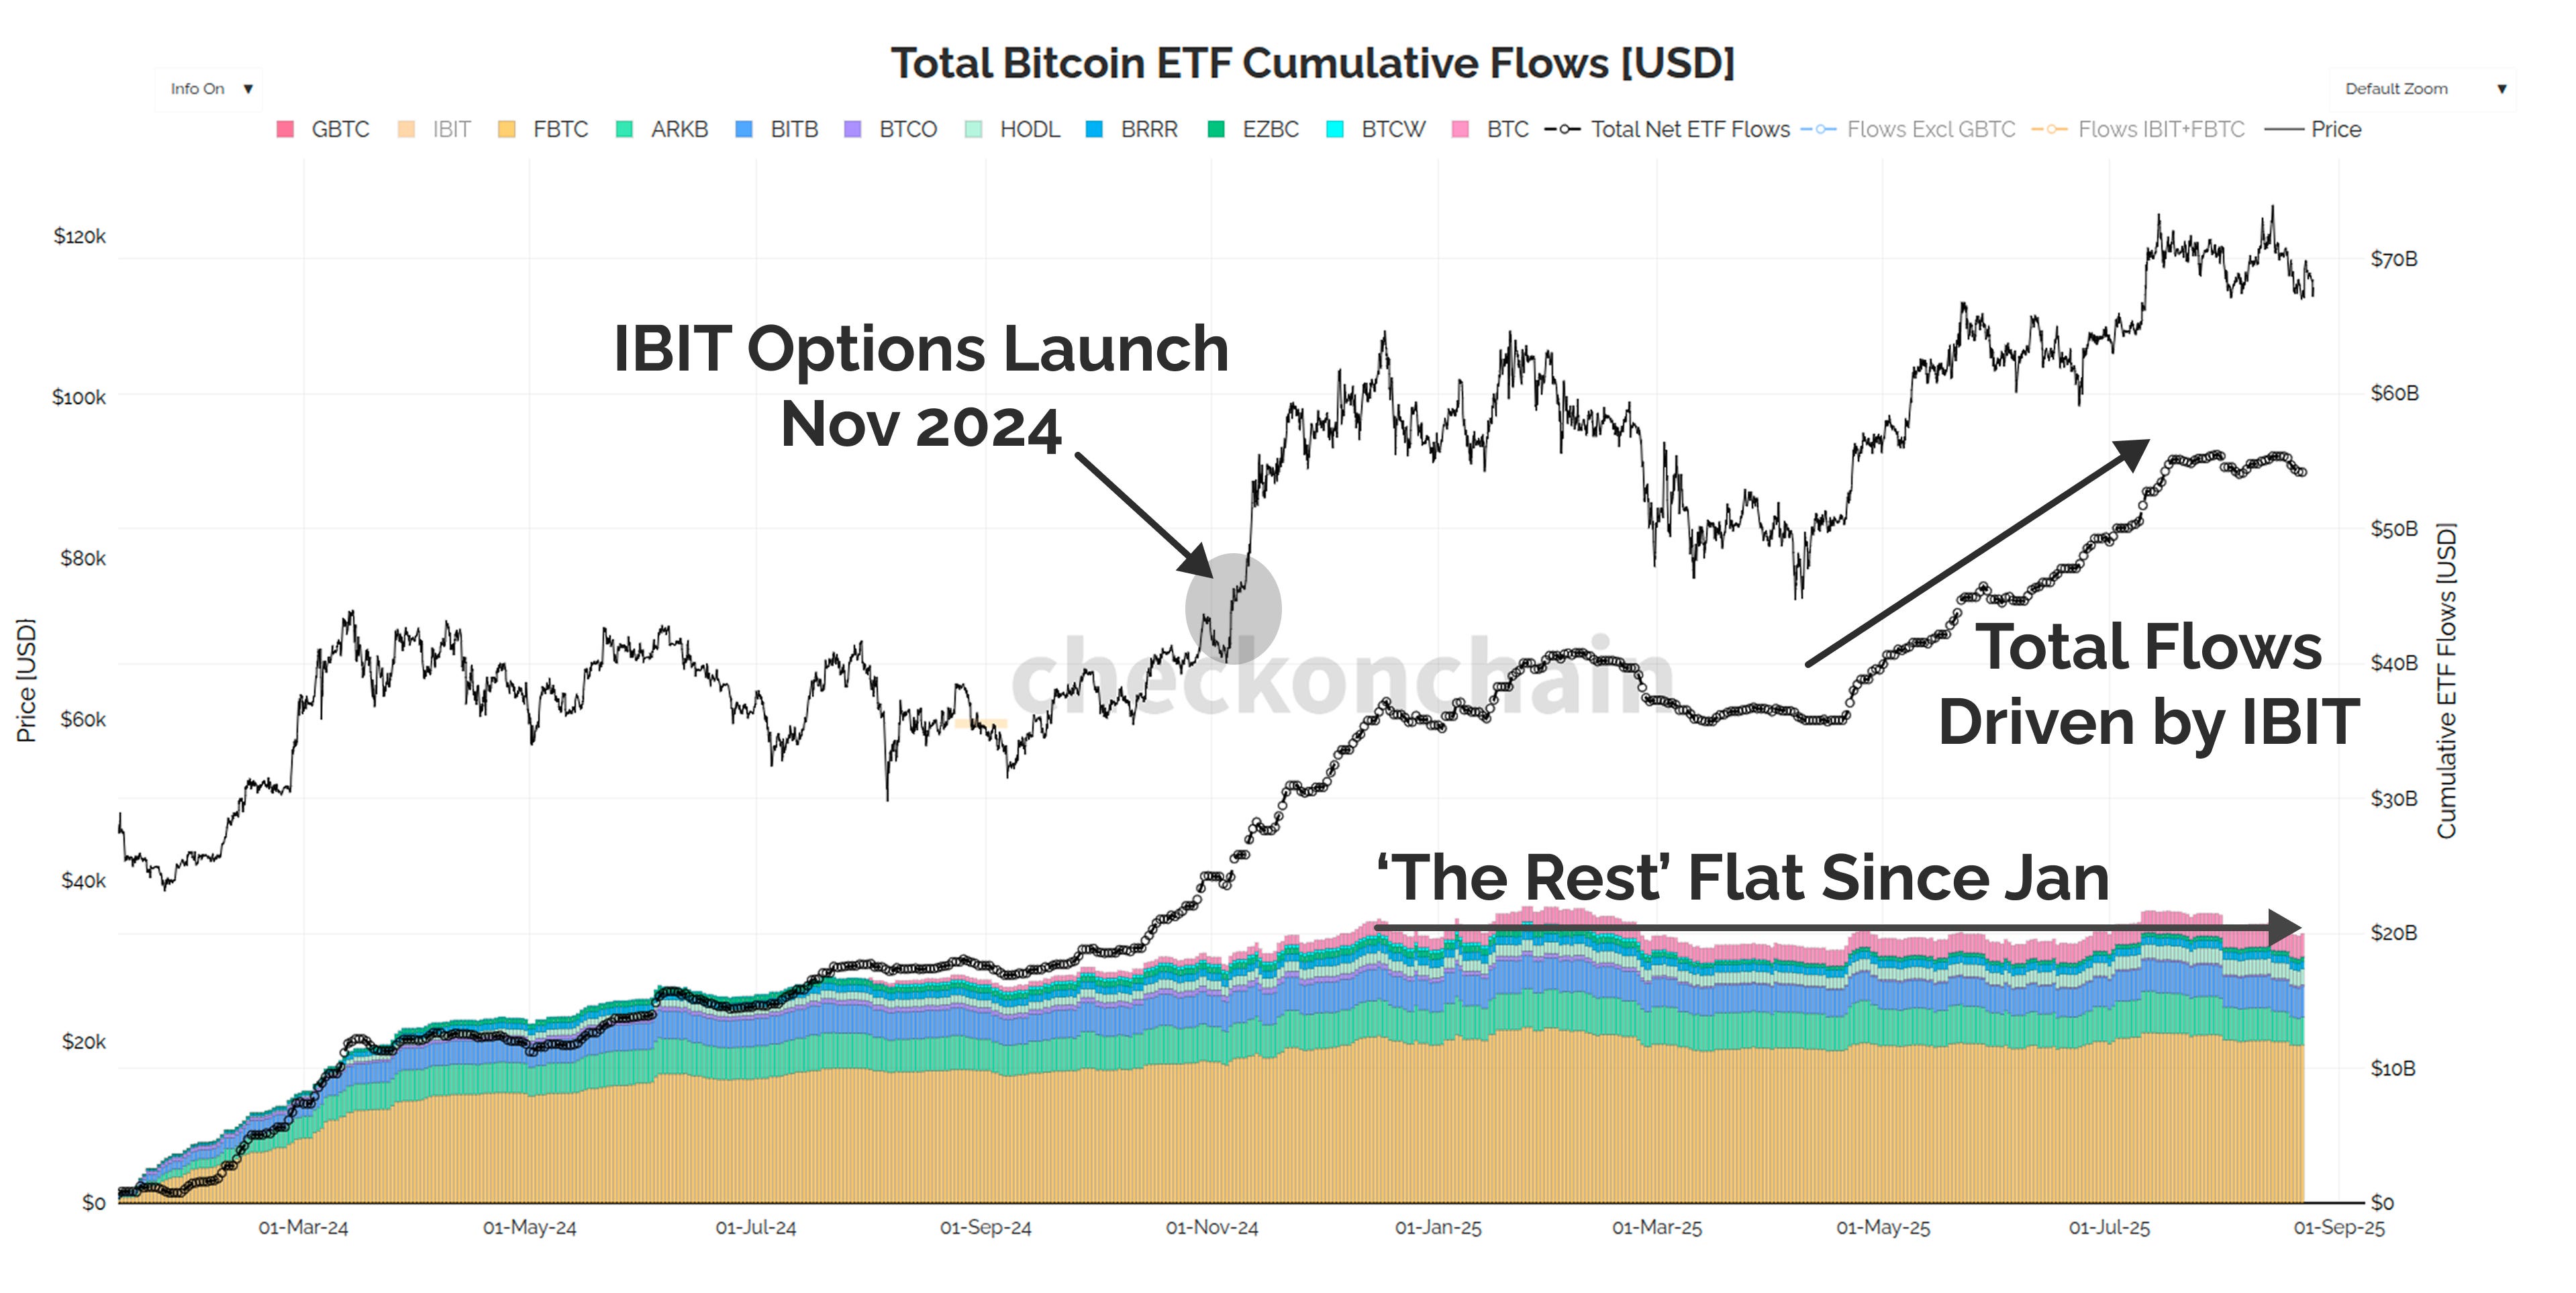
Since the options for IBIT went live in November, the rest of the ETF complex has barely seen any inflows at all, being flat since January.
BlackRock’s IBIT now boasts over 57% dominance of the ETF complex, which is increasingly becoming a winner takes all market.
This also goes to show how important options are for institutional investors, which was a concept I put forward in Paper Bitcoin. The more deep and liquid the options market becomes, the more capital large entities can allocate to Bitcoin in the first place.
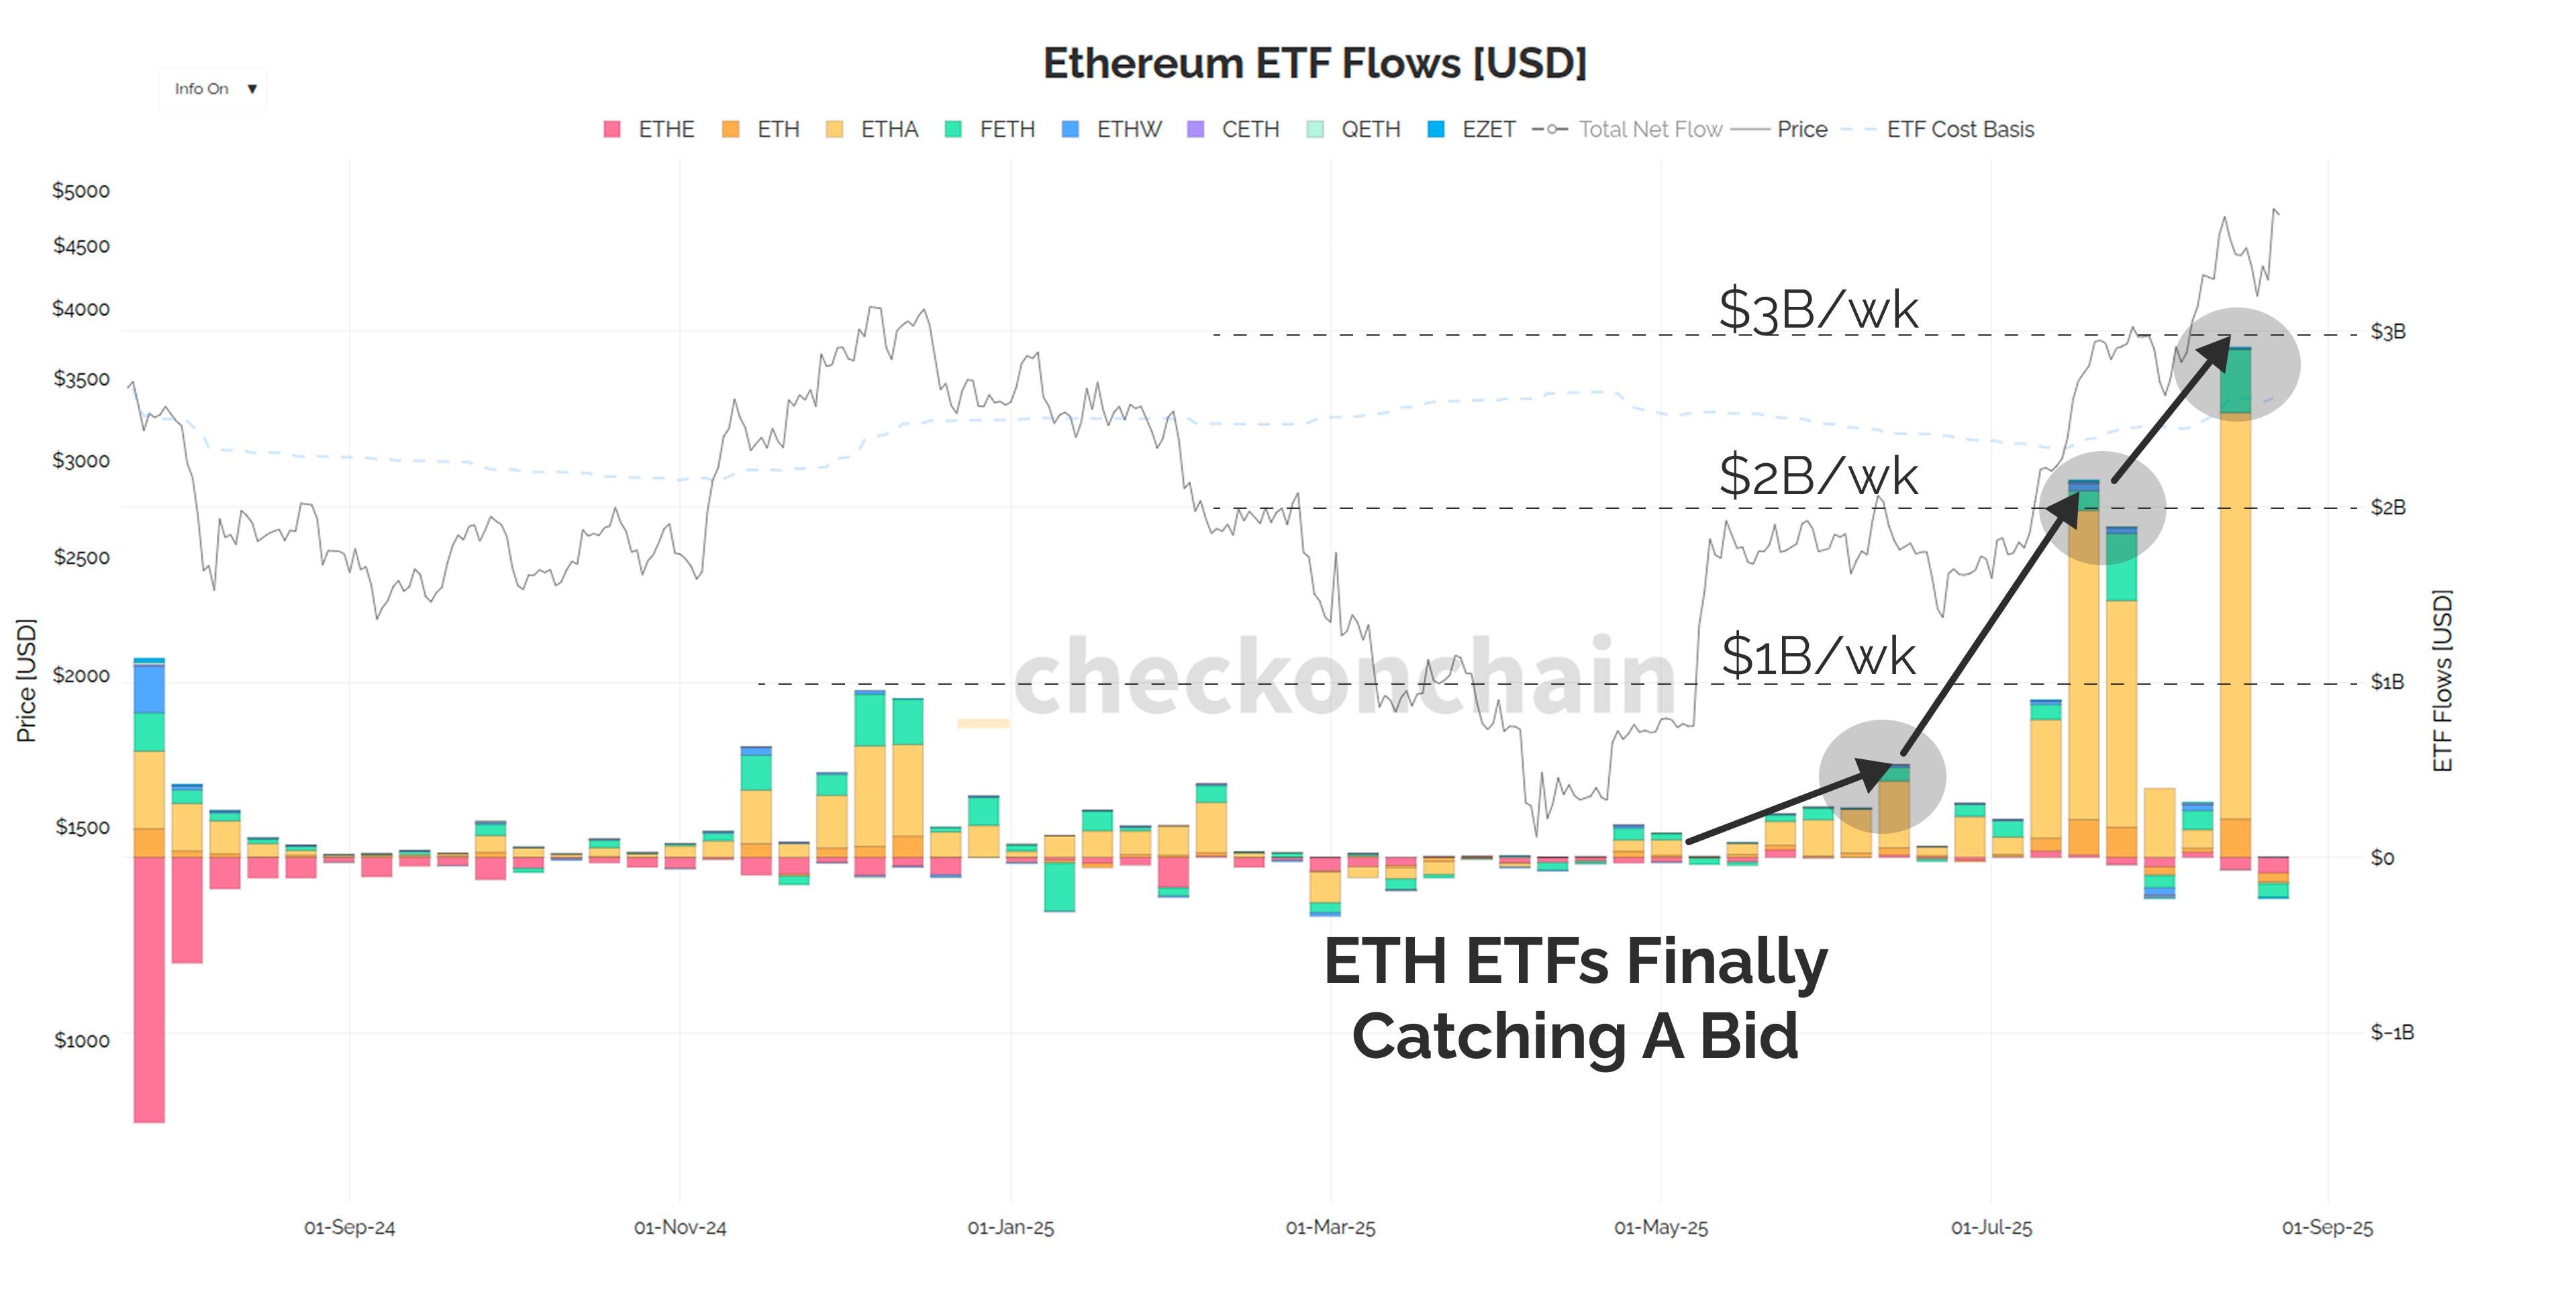
It is worth noting, that whilst the Bitcoin ETFs have been sluggish in recent weeks, the same cannot be said about the Ethereum ETFs, which are seeing consistent multi-billion dollar inflow weeks.
There is a catch-up trade underway, which after a painfully long three year downtrend in the ETH/BTC ratio, was certainly due at some stage.
There is a meaningfully large combined bid coming from ETH Treasury companies, and the ETH ETFs, which I believe is associated with the passing of the GENIUS Act, and an attempt to express the ‘stablecoin trade’. Personally, I don’t think this argument holds much water, but that is a topic for another day.
Note: I occasionally have subscribers asking for coverage of Ethereum and altcoins. For full clarity, my expertise, skills, and personal interest and conviction are focused on Bitcoin, and it would be unfair and disingenuous of me to pretend to have any edge (or interest) in the altcoin space.
I documented my altcoin experience in The Flip-Floppening, which explains my complete thoughts on this topic for those interested.
Now, back to the good stuff, more Bitcoin.
Treasury Companies Bid Remains Questionable
Across the entire Treasury Company space, equity premiums as expressed via the mNAV metric continue to compress towards (and even below 1.0).
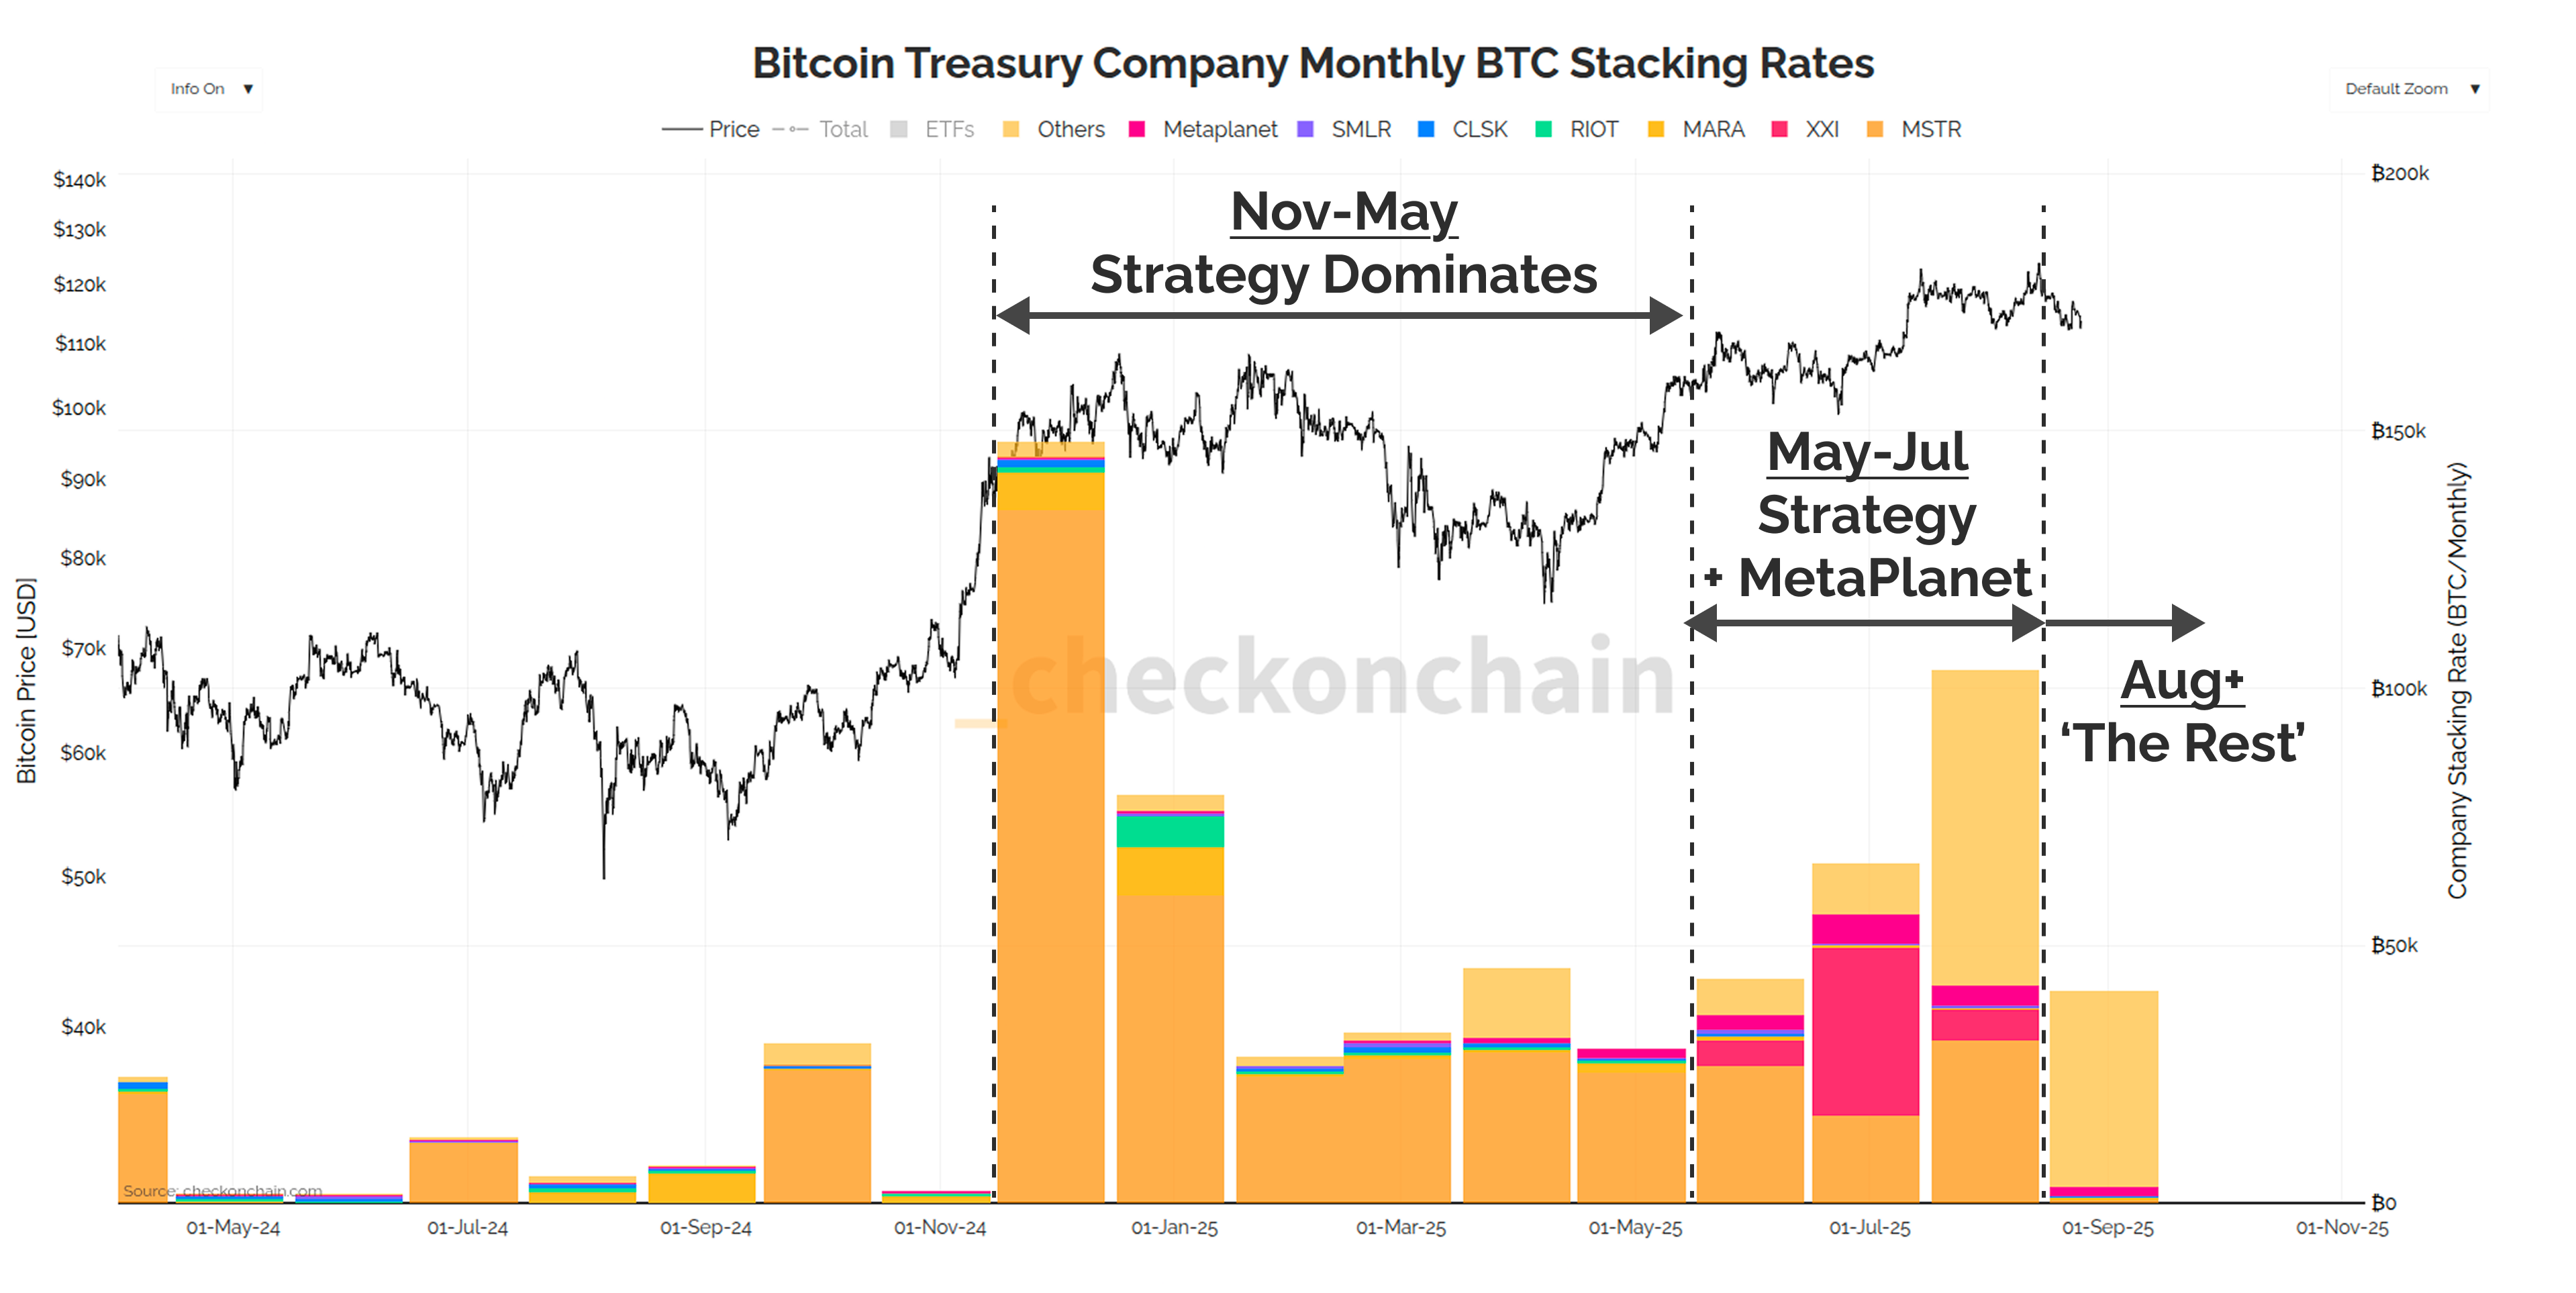
Strategy absolutely dominated the TCo bid from November until July, with MetaPlanet arriving on the scene as a serious bidder in May and July.
In August however, neither of these two firms have acquired any meaningful coin volumes, and the TCo ‘bid’ is coming from ‘the rest’. As I covered in Soft Around the Edges, a decent amount of these TCo’ bids, are really just whales and companies moving coins from their left pocket to the right one.
We’re unlikely to see a huge bid from these TCos any time soon, as I suspect the Bitcoin price will need to lift off to a new ATH before mNAVs have any chance of re-expanding.
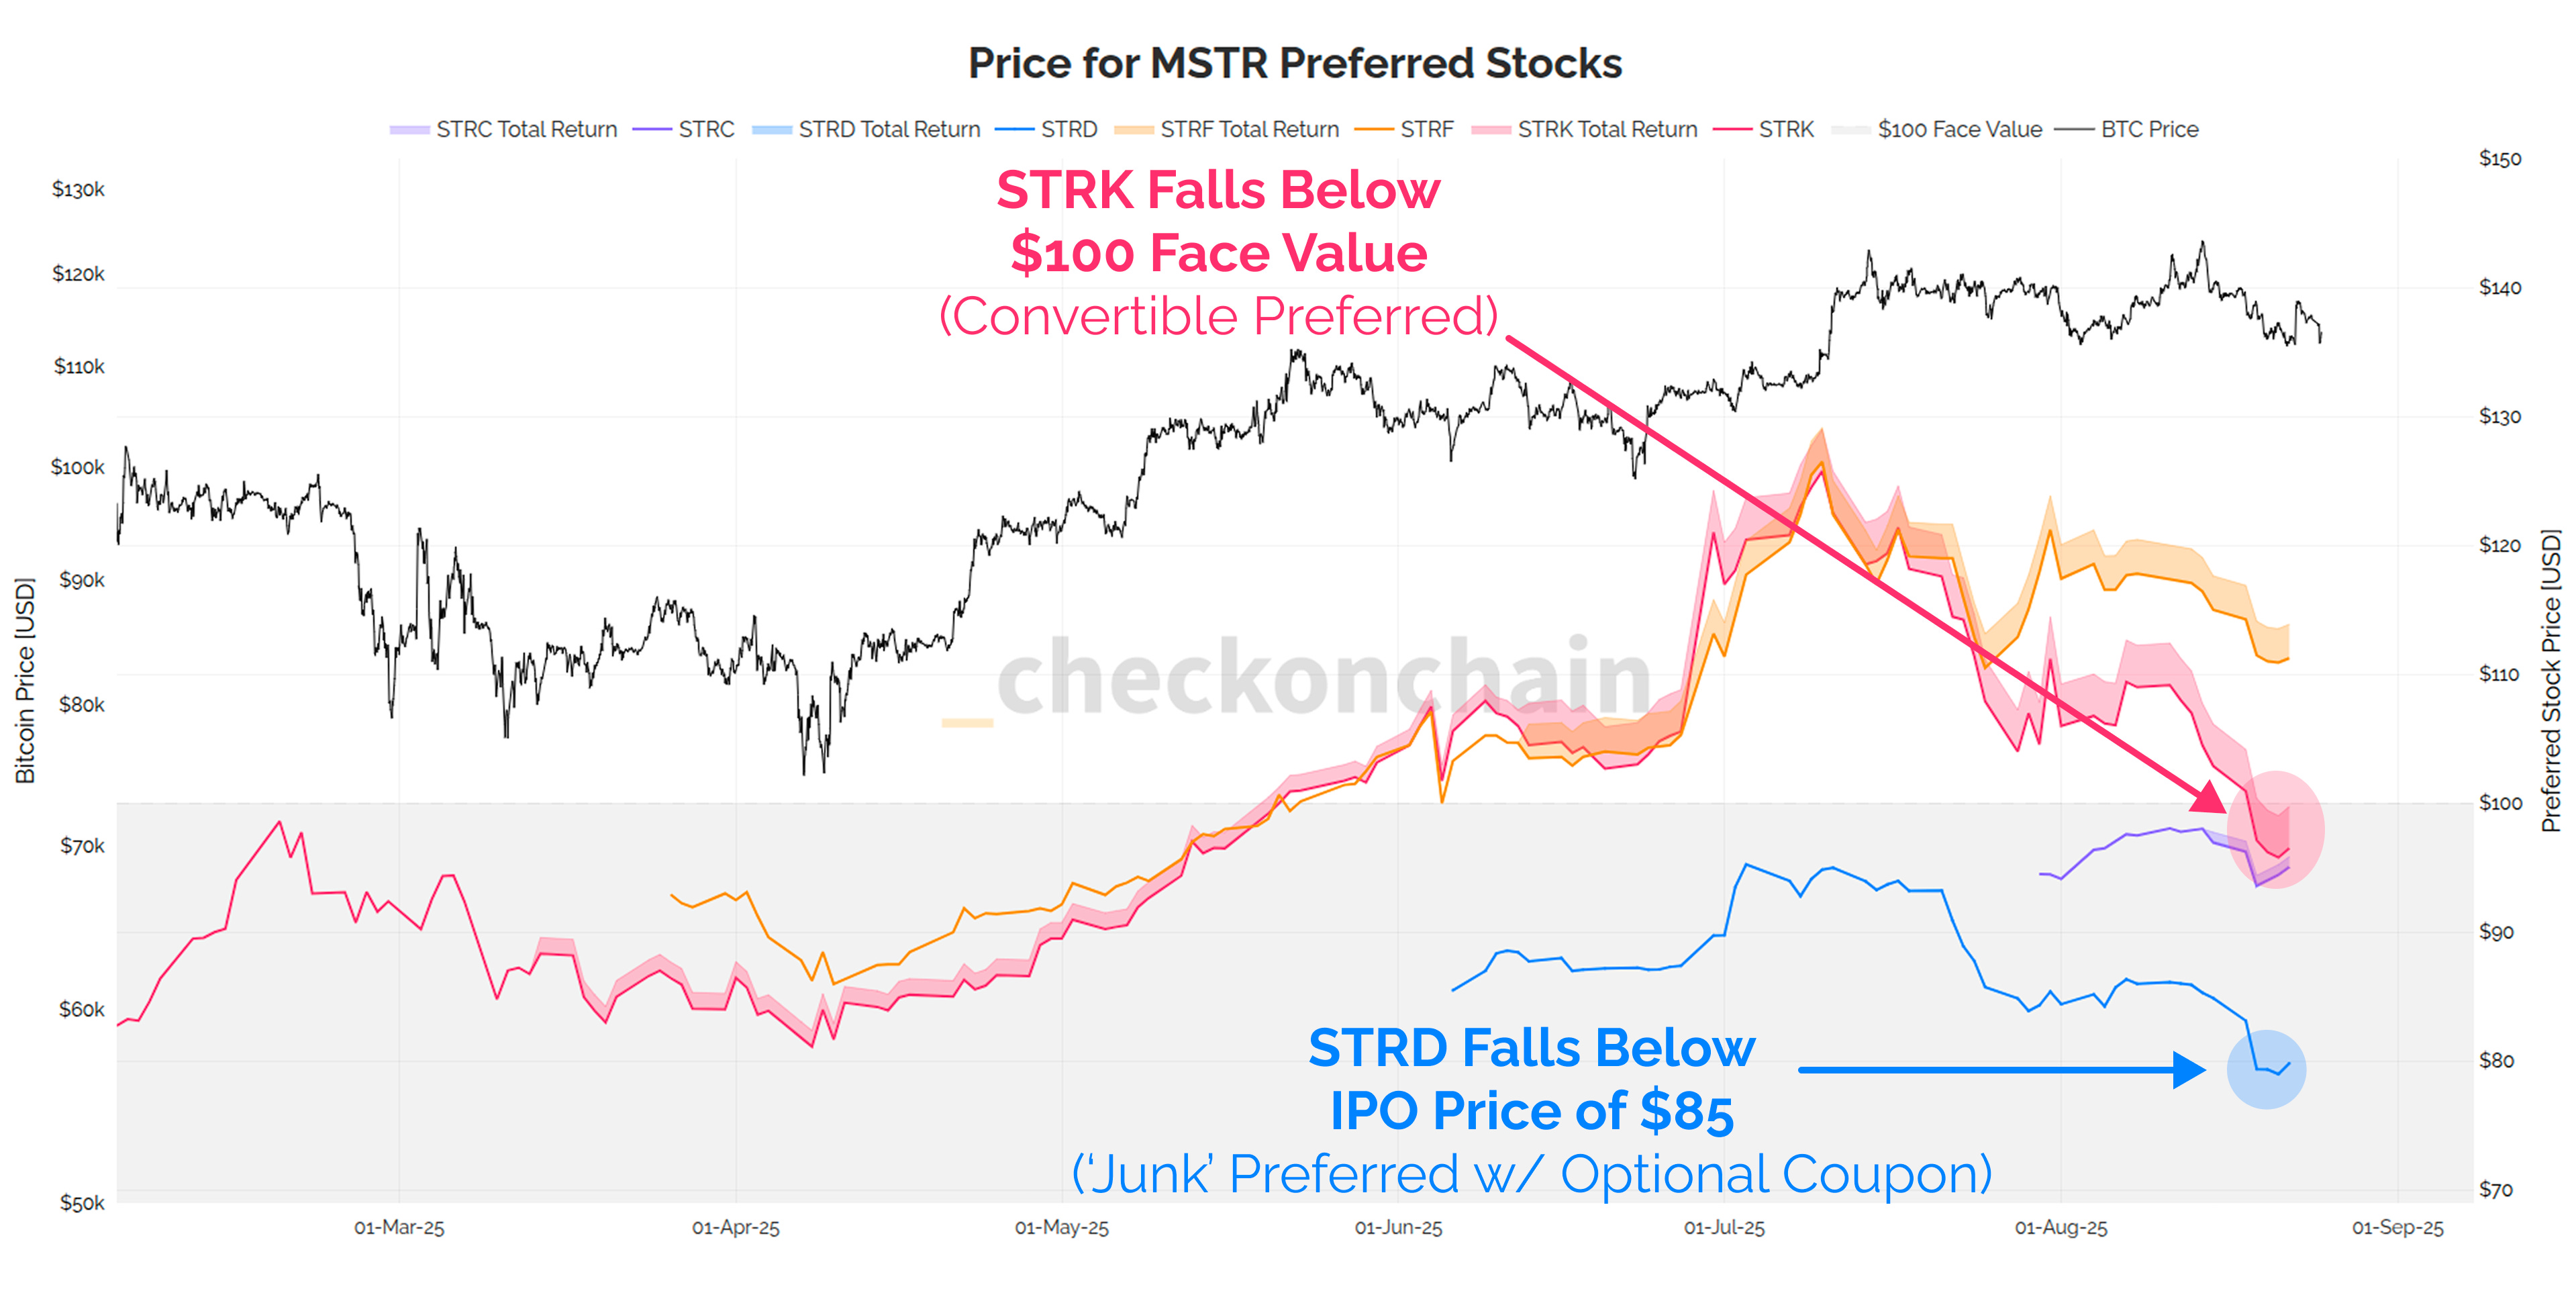
Strategy’s preferred stocks are also languishing for the time being, with STRK now trading below its $100 face value, and STRD trading below its IPO price of $85.
Since STRK is convertible into MSTR at a $1,000 strike price, and STRD has an optional coupon, my read is that the market isn’t confident in Strategy’s premium expanding anytime soon either.
Demand is unfortunately quite soft for now, which again, reinforces a case for Check the HODLer to be patient, and prepared for choppy downside in the weeks ahead.
Pricing In Downside
Based on all of the above, I don’t think we’re blasting off the fresh highs for a little while yet. So to wrap up, I thought it would be useful to look at how the options market is pricing downside risks. We can then compare this to the likely demand zones seen in onchain data.
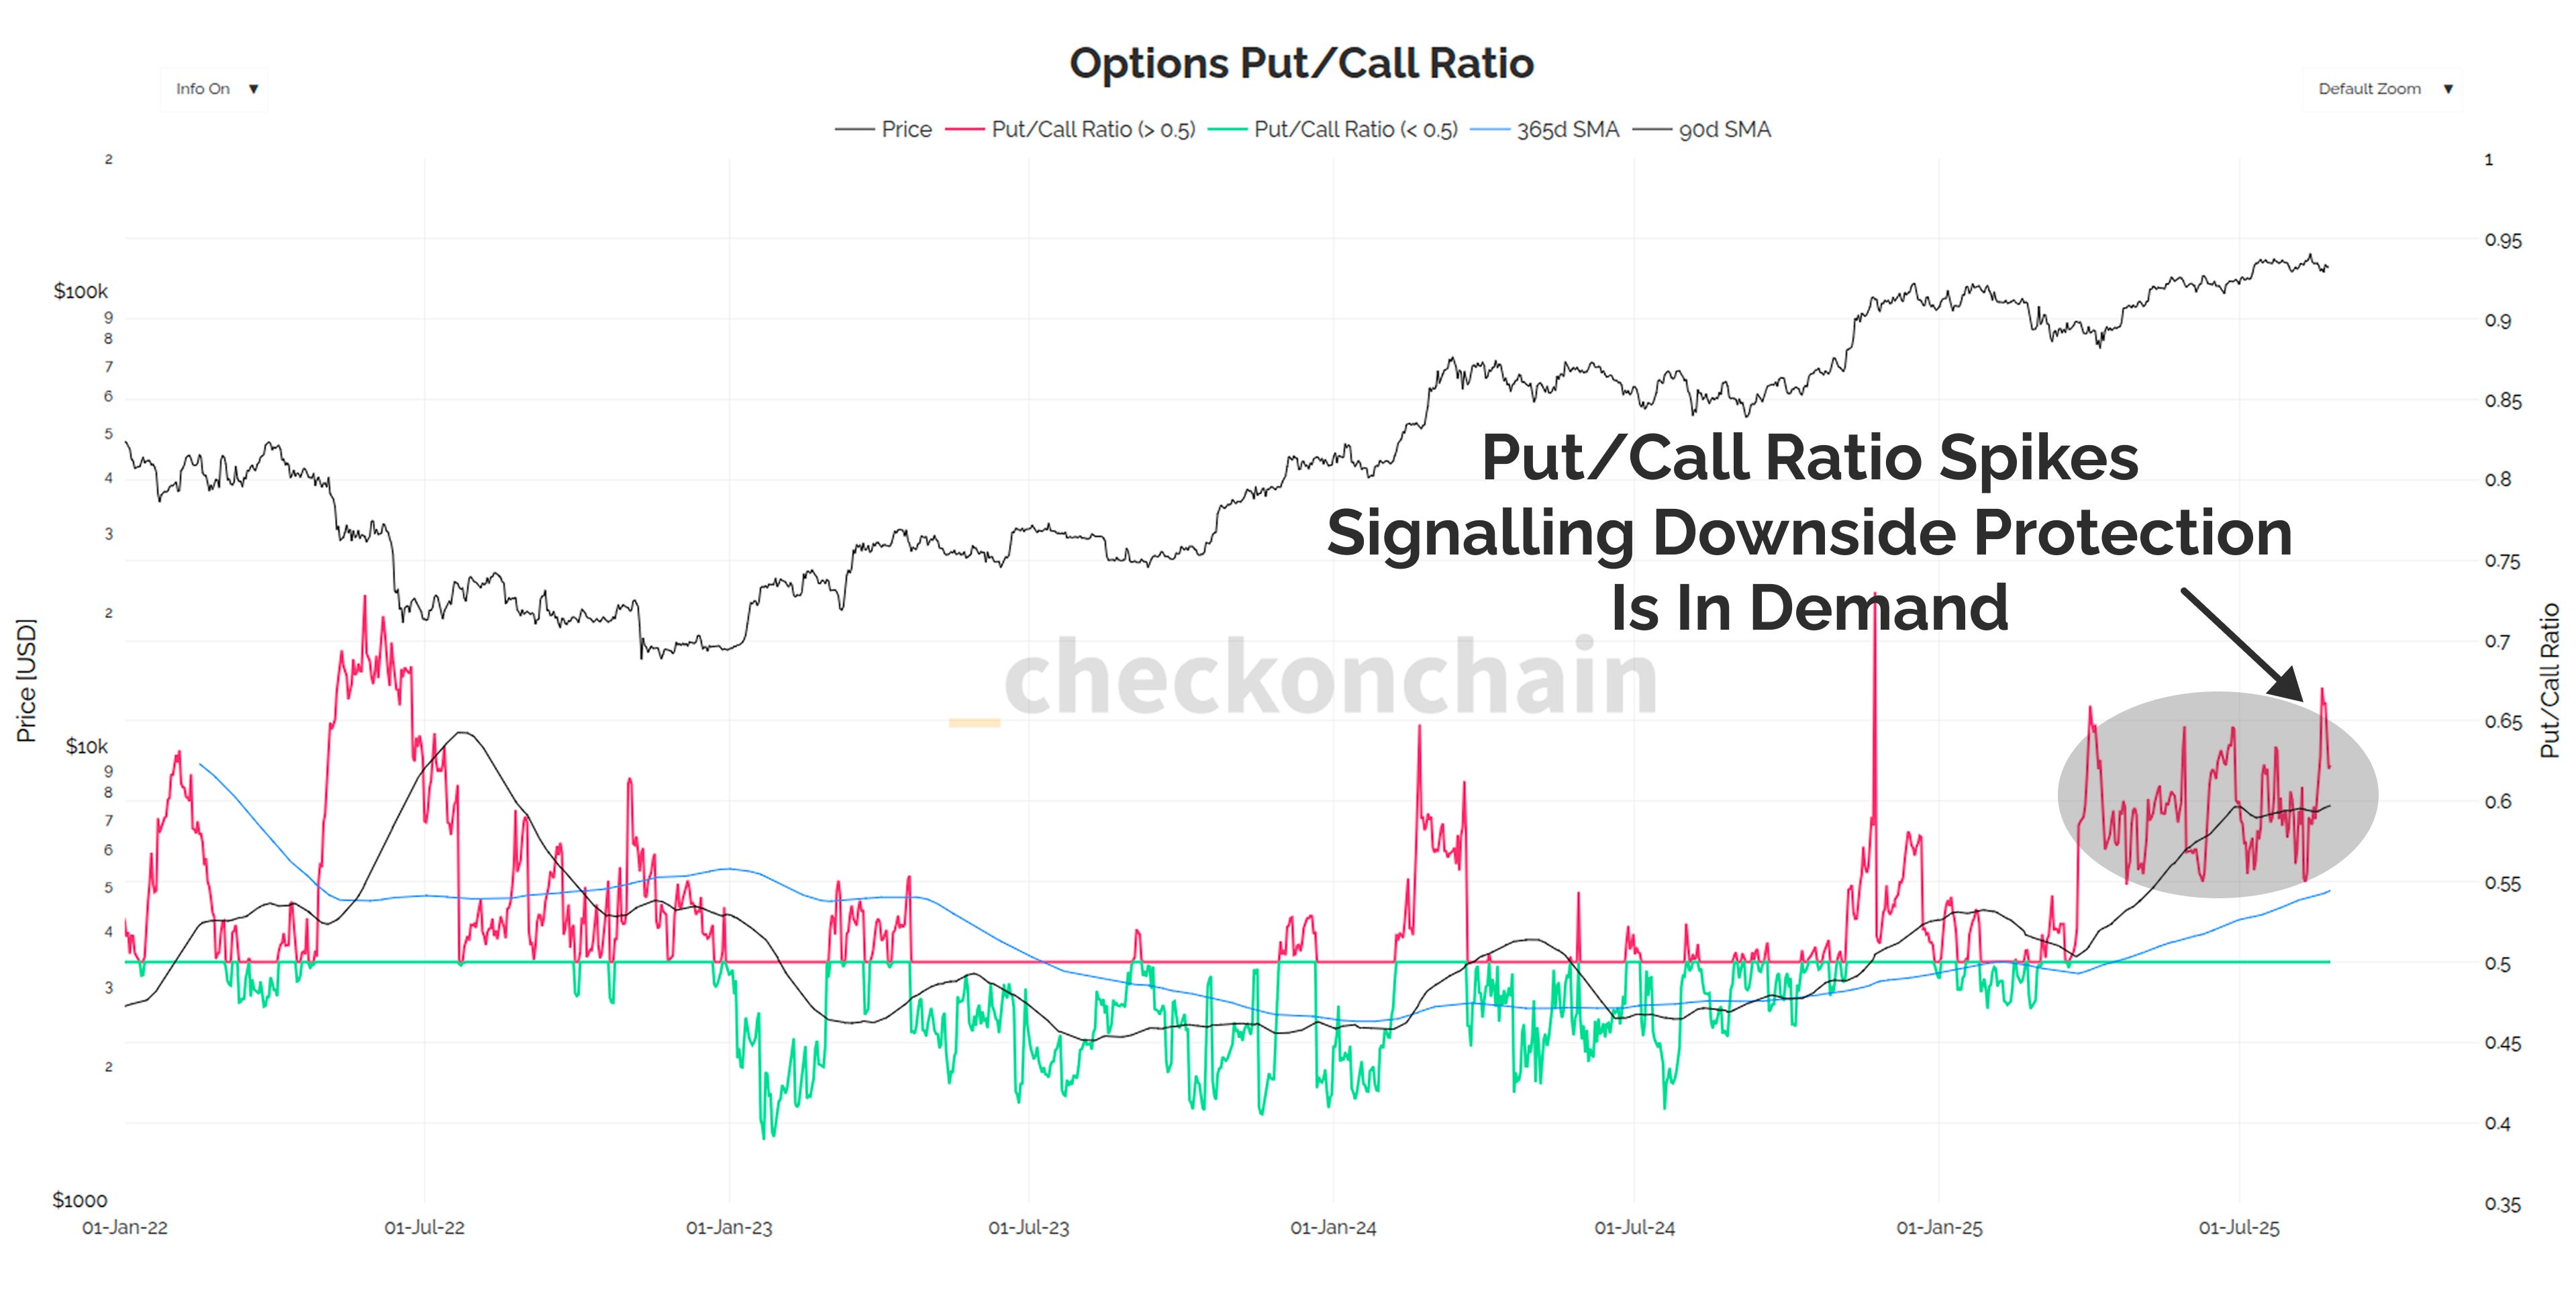
The Put/Call Ratio gives us a read of how much option open interest is allocated to downside protection via puts, relative to upside speculation via calls.
Since April, Puts have been in notably higher demand, and this has spiked even higher as this correction started to take shape.
Options traders are increasingly hedging for downside.
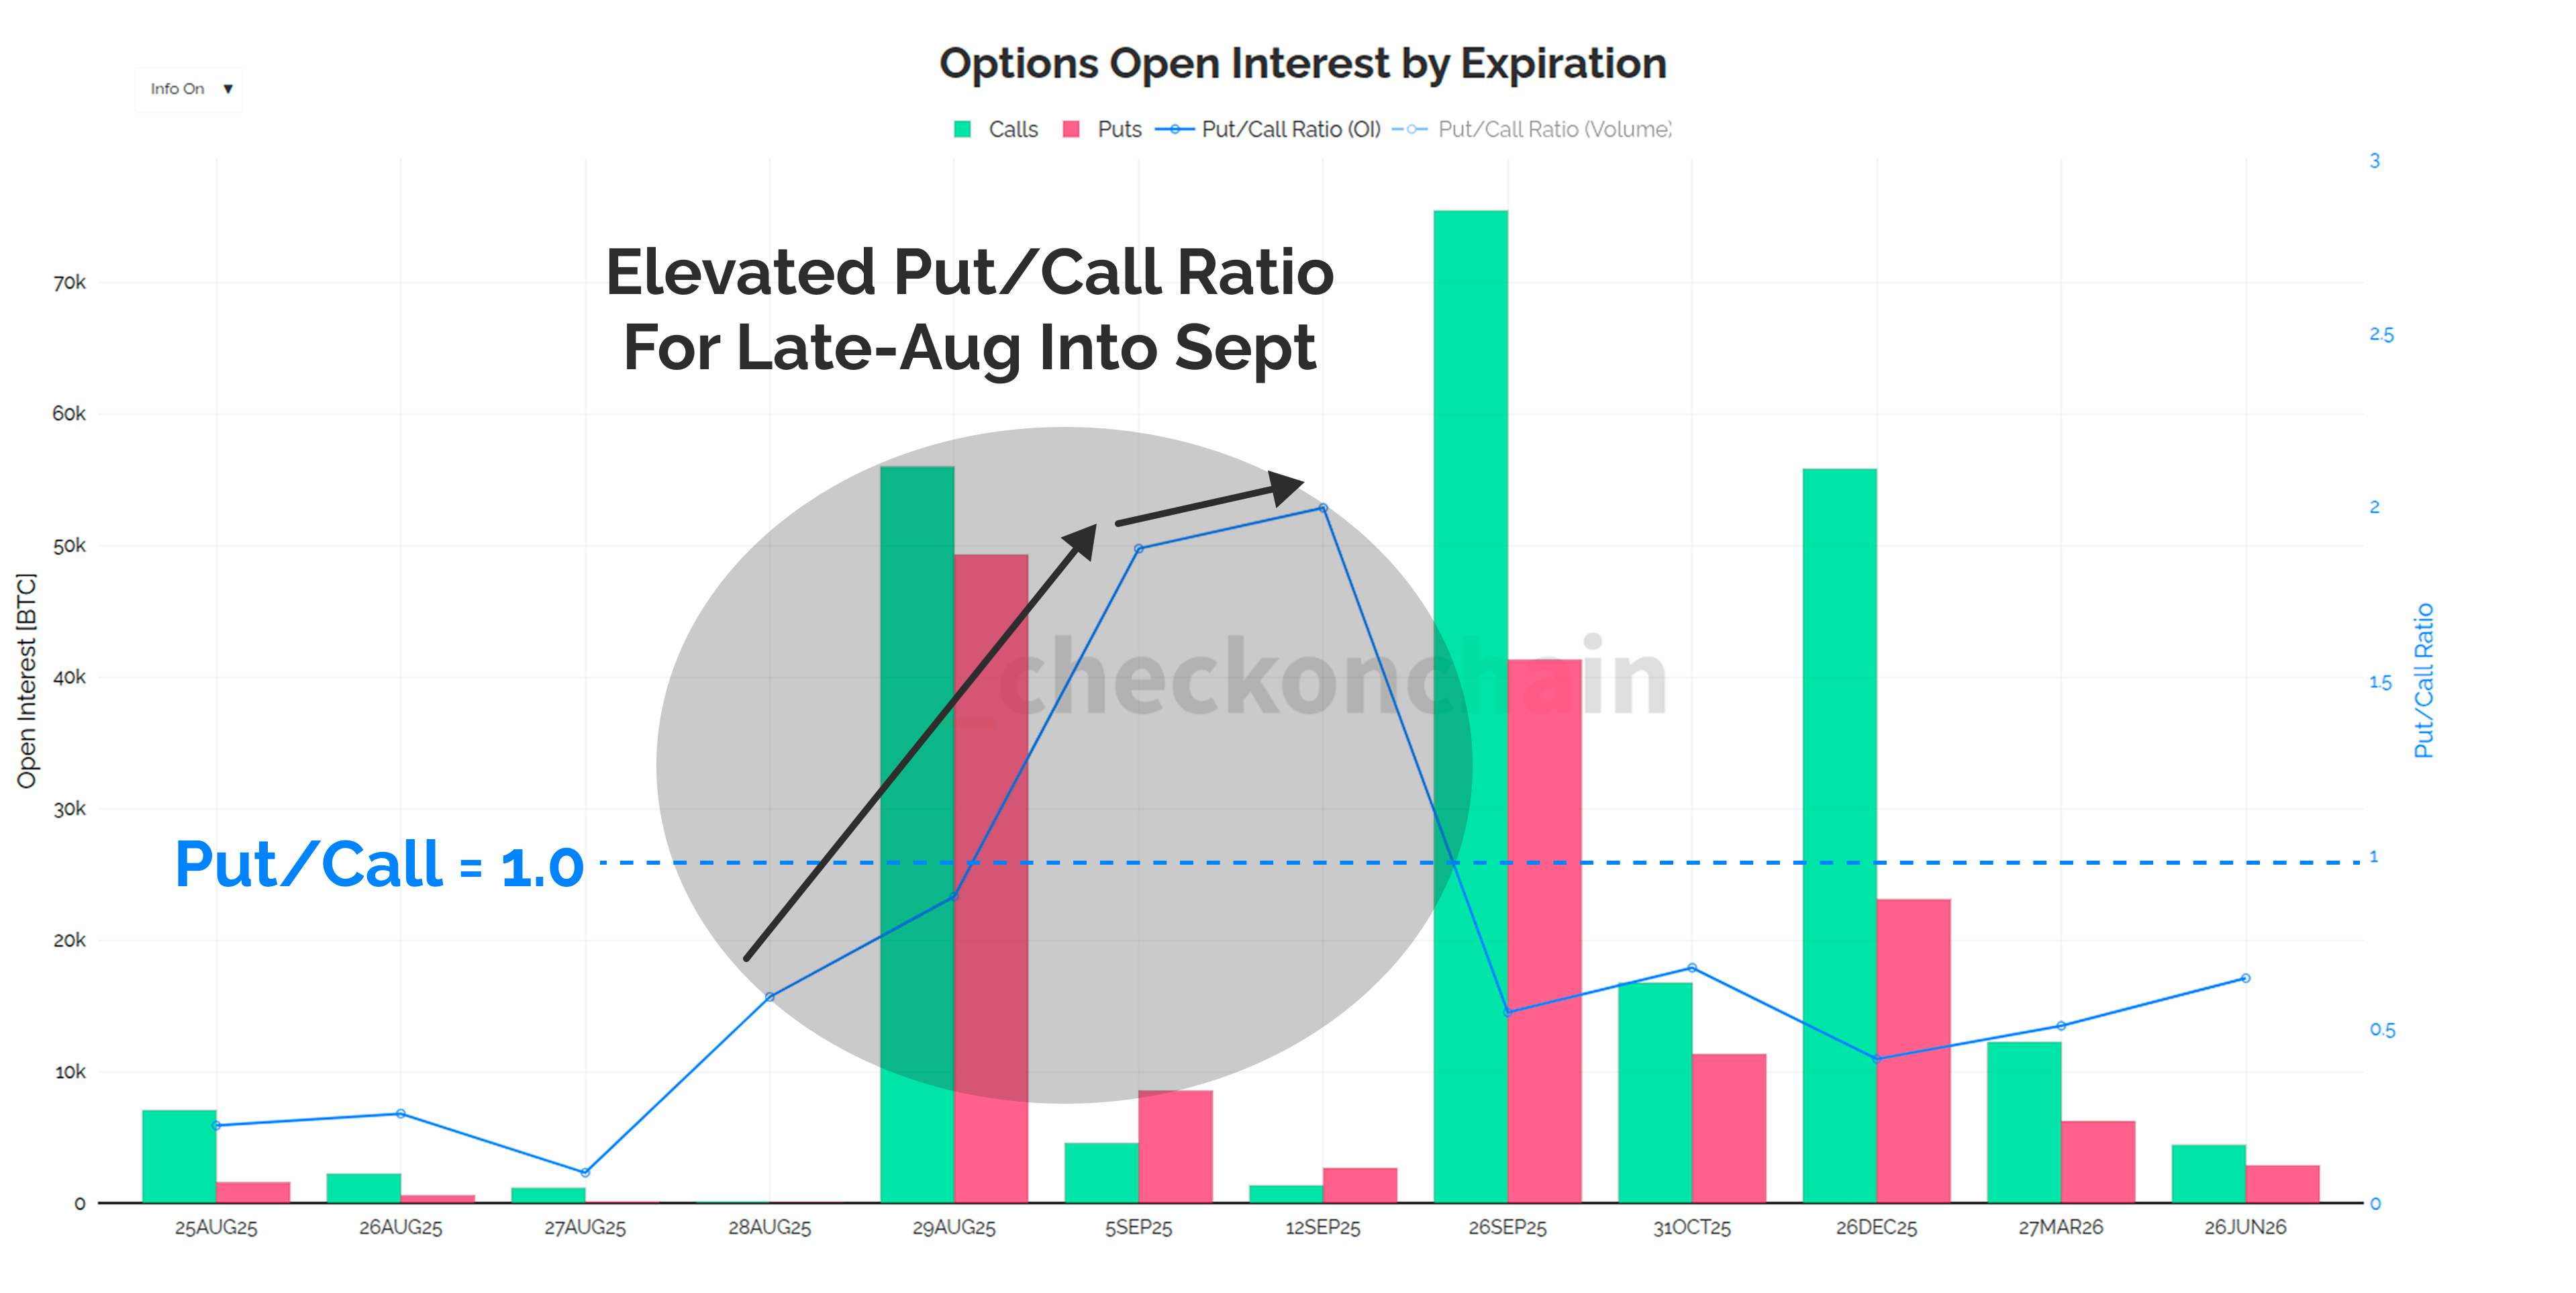
The Put/Call ratio is quite elevated for the rest of August, and into September, which suggests the market is anticipating a fairly soft month ahead of us.
Remember the monthly seasonality chart I showed in the intro, which highlighted September as a statistically weak period for the S&P500…Here is the same seasonality chart for Bitcoin, where I have isolated different time periods since 2015 (ignoring old data).
September is indeed the weakest period for Bitcoin, and this is consistent whether we look at data from 2015+, 2020+, and even in our current cycle only from 2023 onwards.
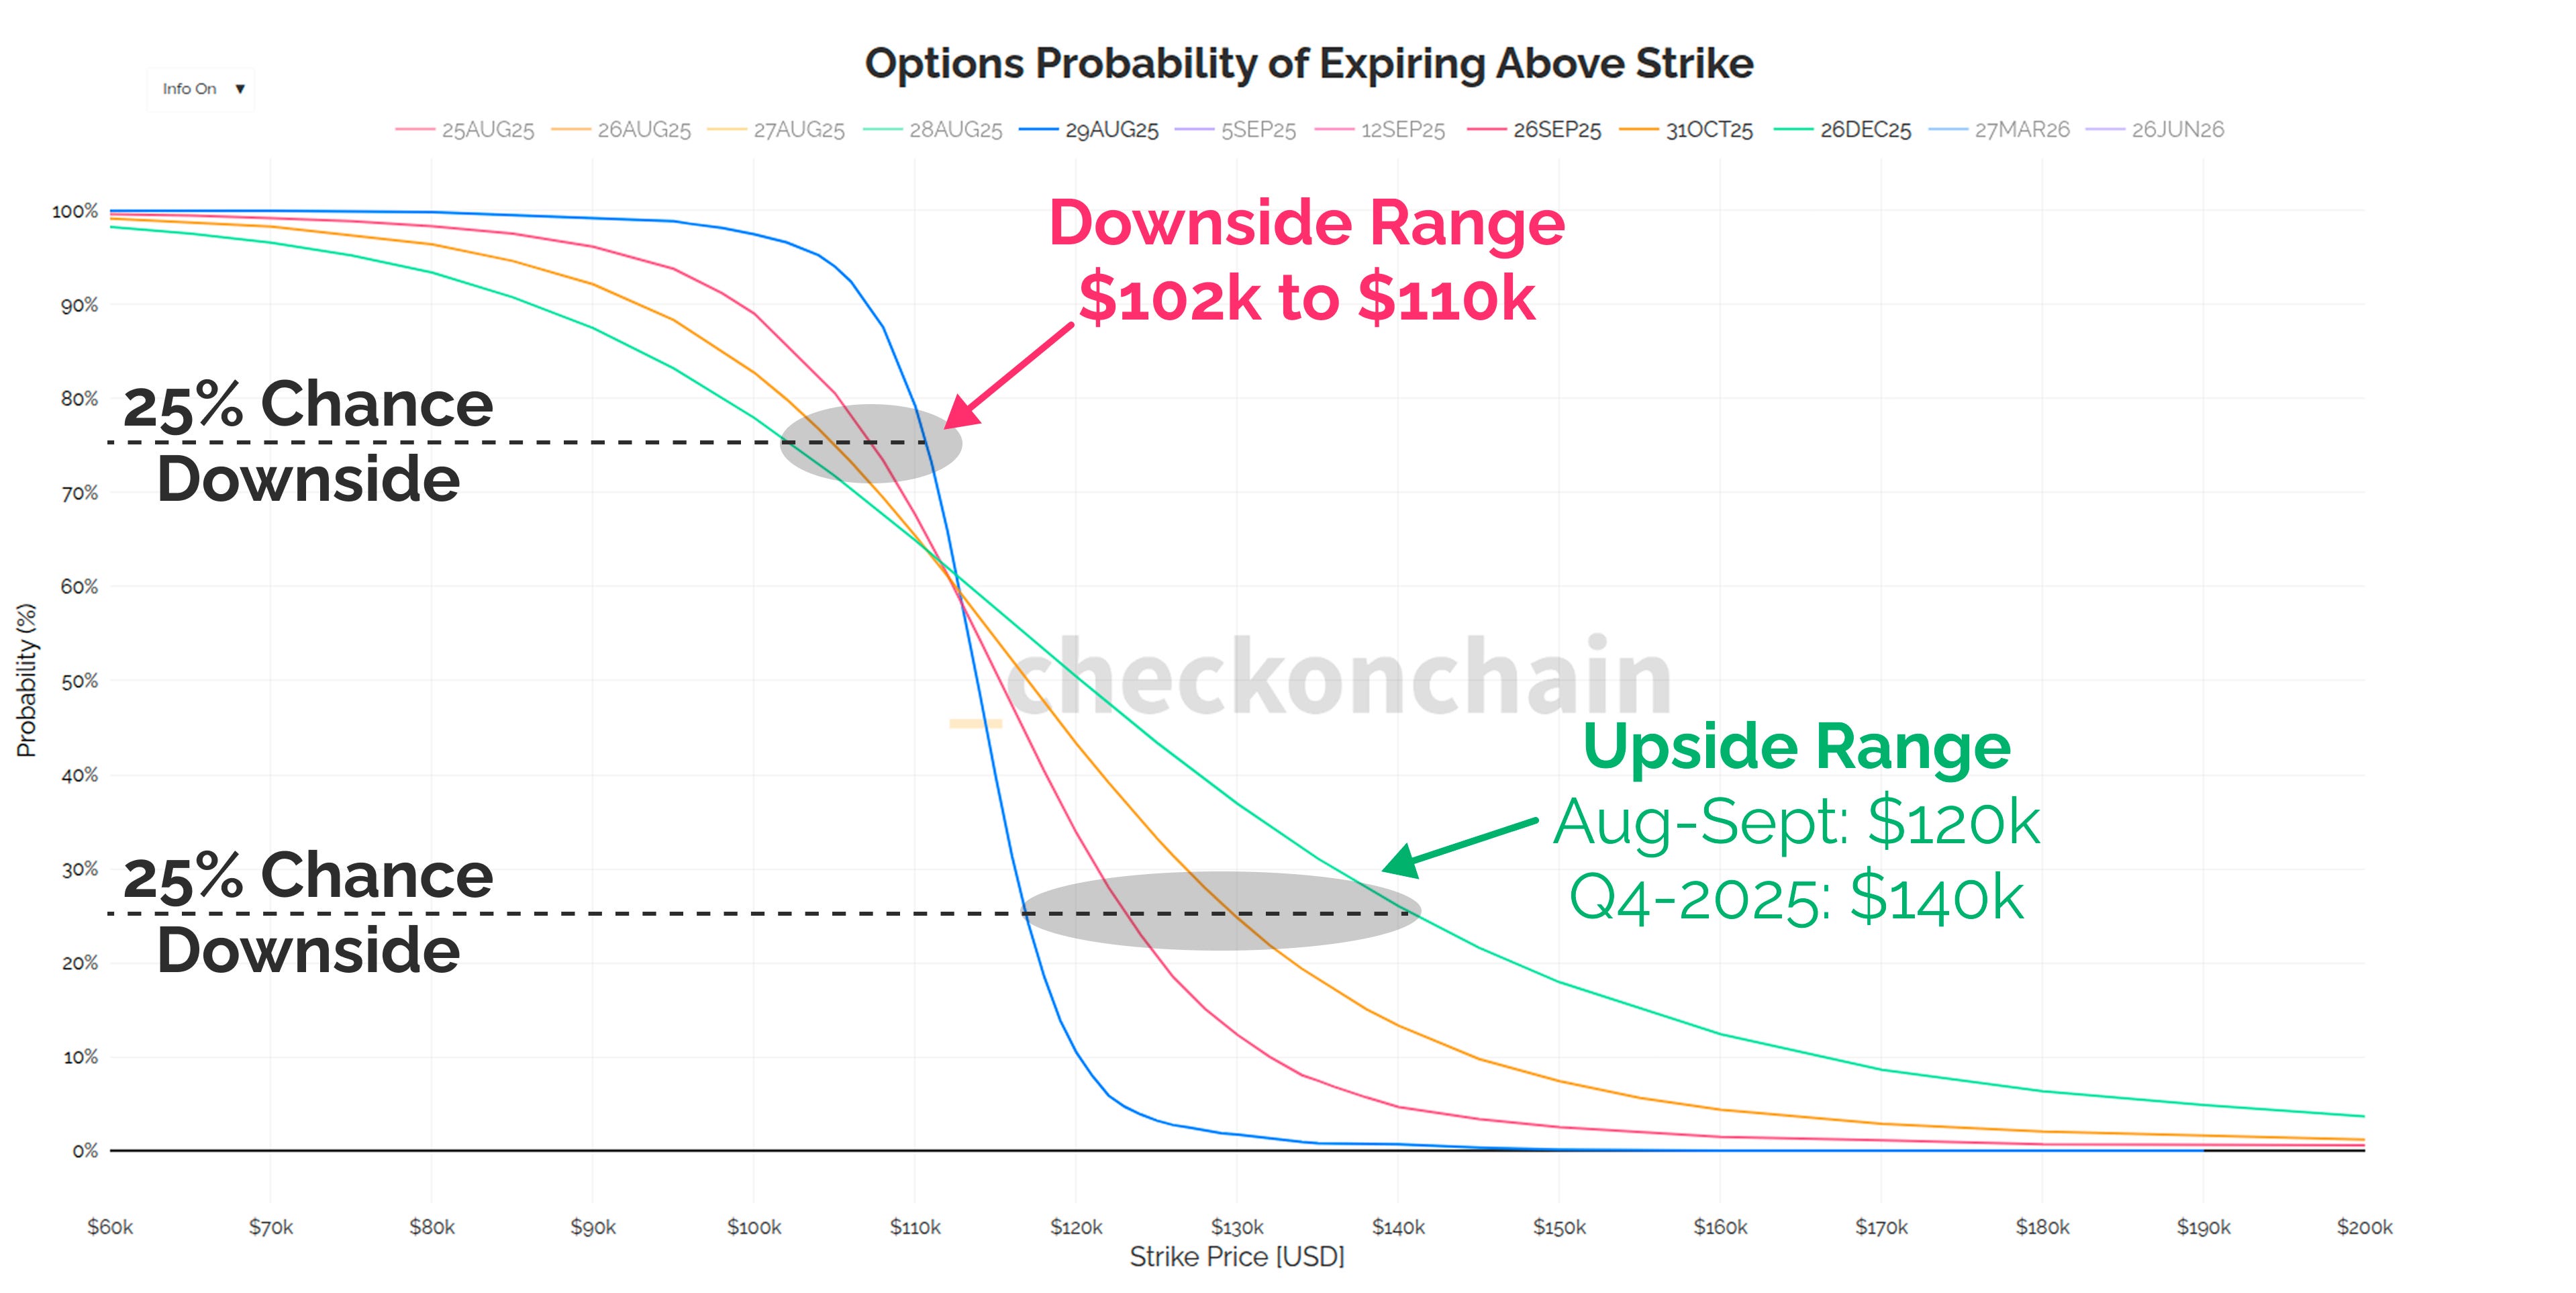
However, despite a fairly comprehensive spread of evidence that a soft-September is likely in our future, options traders are not pricing in anything too catastrophic.
If we look at the downside probabilities priced into the end of the year, the options market assigns a 25% chance that we will close out the year above $100k.
Remember, this isn’t a prediction, it is a read on the probabilities priced into the options market given the information the market has today.
Let’s compare this a read of the likely regions where support may form from an onchain perspective:
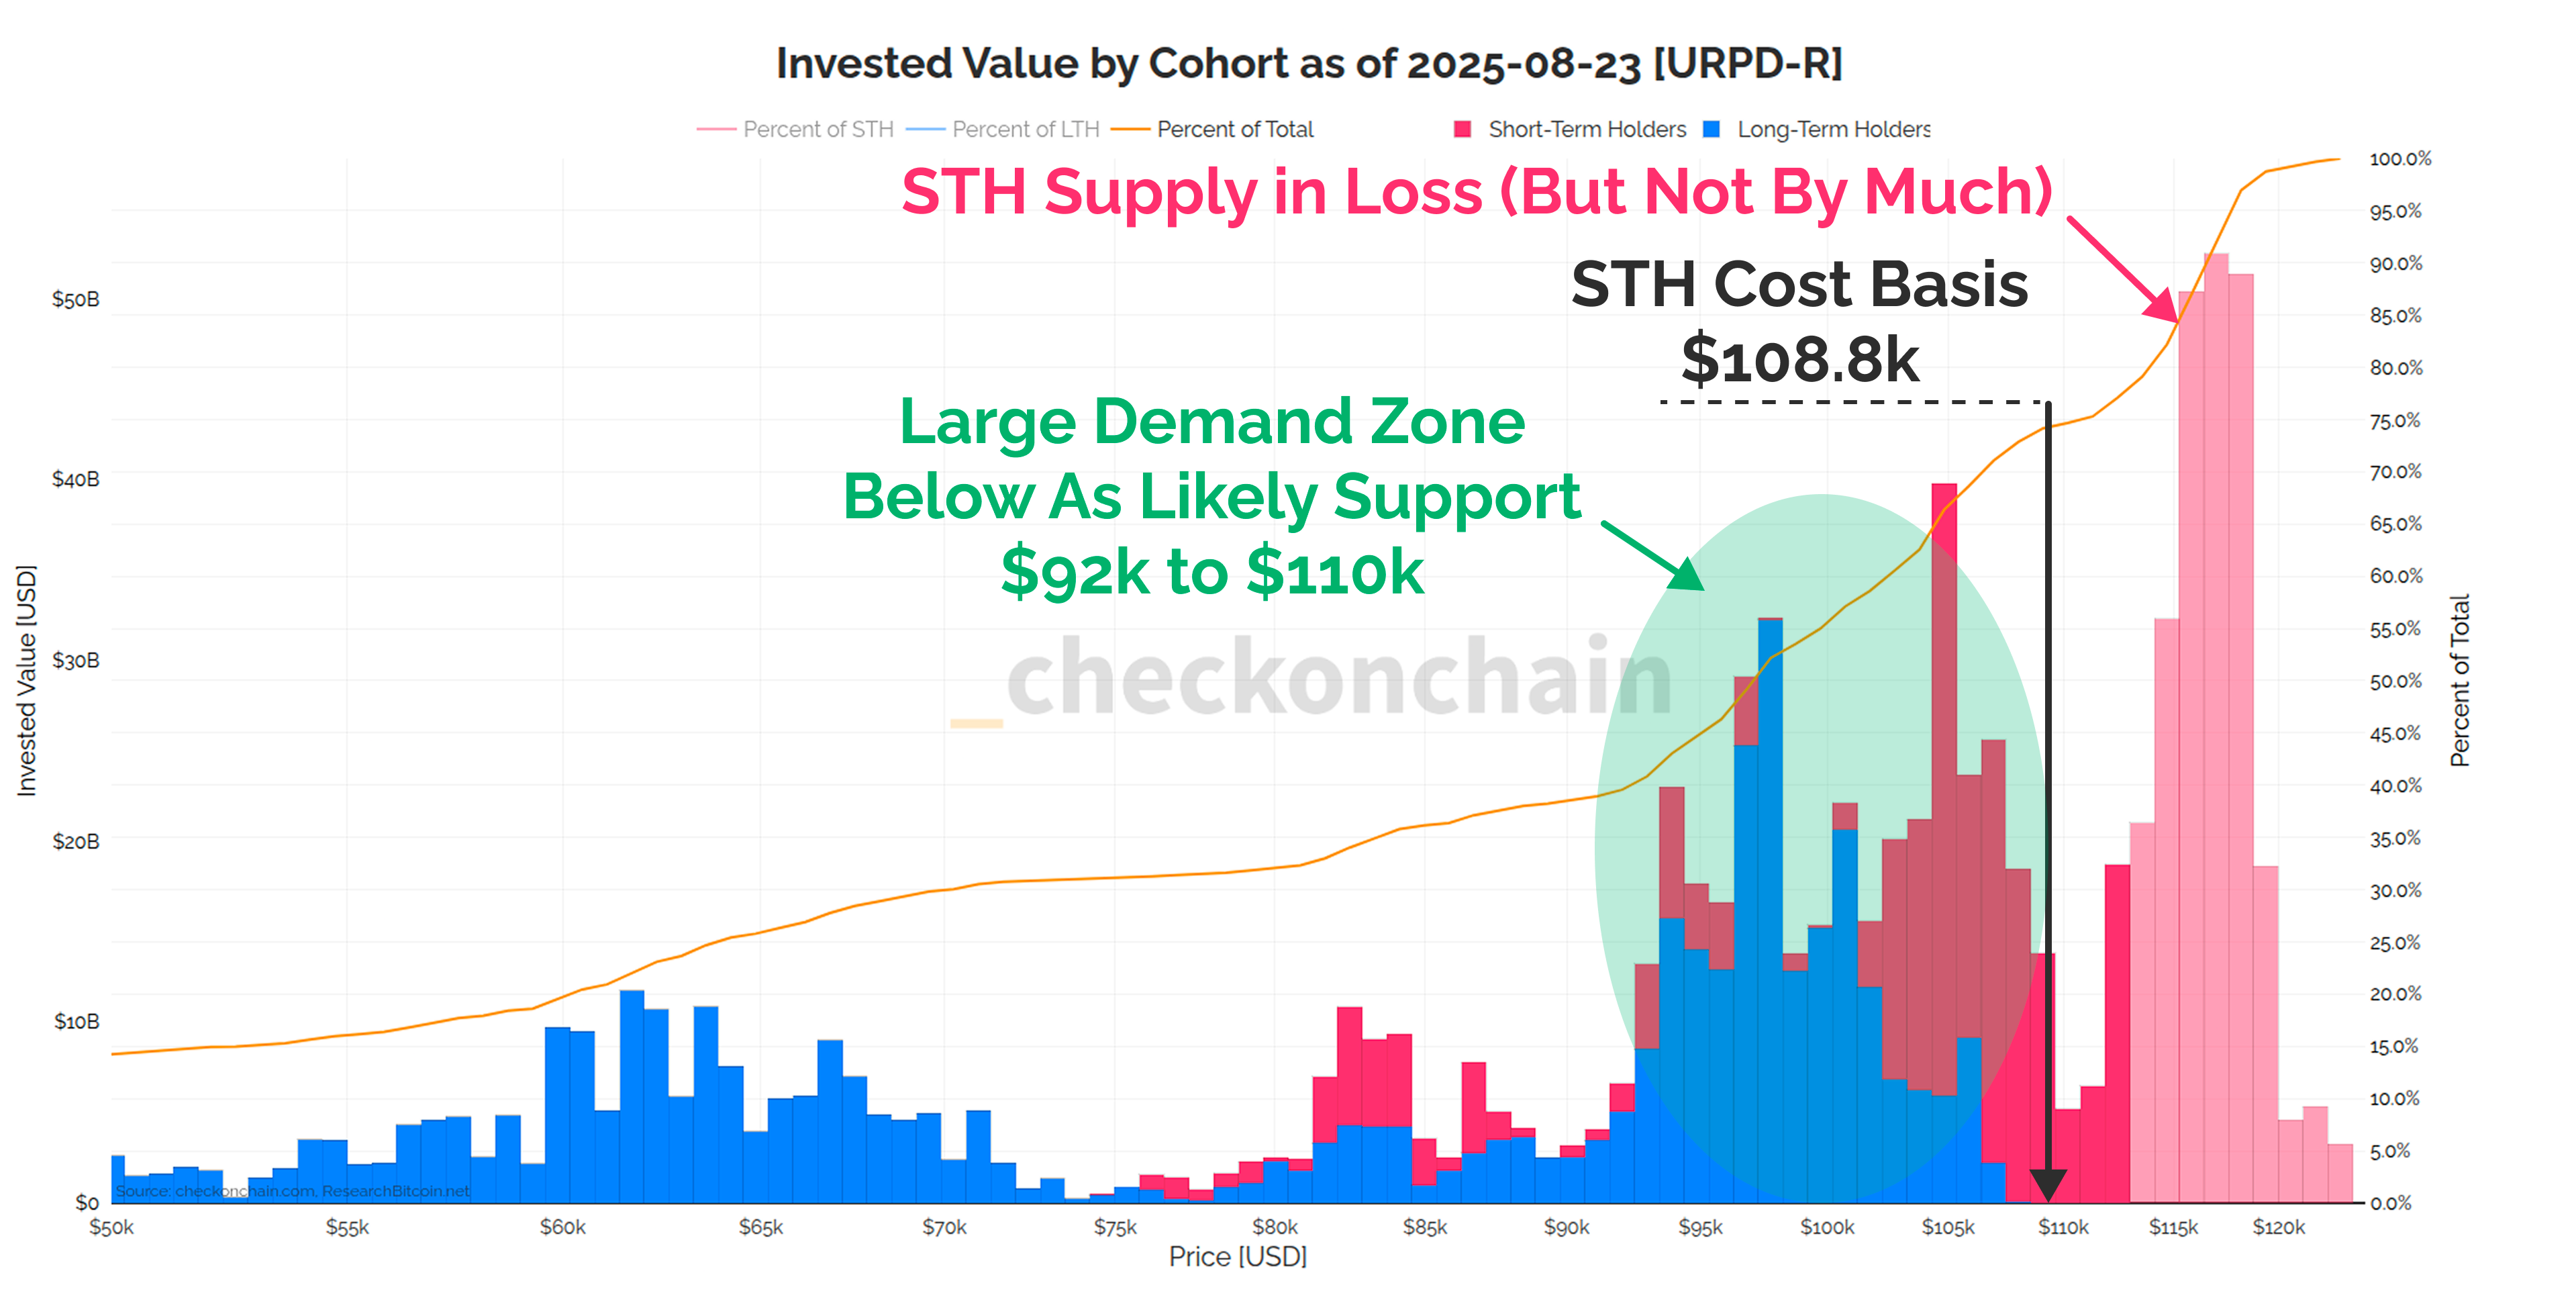
The STH cost basis is located at $108.8k, sitting at the top end of a large historical demand cluster.
Around half of all STH supply is now held in loss, but as we covered last week, it isn’t underwater by very much, and unrealised losses are extremely small.
The large demand cluster between $92k and $110k reflects a region where significant volumes of coin changed hands. This also means it is a price range where demand previously saw value, and it stands to reason it should again.
In my opinion, whether consciously or not, the options market has a similar read to myself, which is that this $100k region is very likely to provide support should we need it.
Concluding Thoughts
When we compile all of this information, we end up with a picture that is actually quite consistent and easy to construct a base case around:
The dip looks like a dip, with far more evidence pointing to it being a run-of-the-mill dip, rather than a more serious bear market (at least for now).
Demand is soft, but September is statistically soft at the best of times.
The ‘air-pocket’ down to $110k, and the prior ATH break-out is being re-tested, and we’re still trading above the STH cost basis at $108.8k.
There is a large historical demand cluster below $110k, which is likely to act as support should we reach it. If it fails to provide support, then that would be a bad sign in my view.
In other words, the base case scenario I laid out in the initial setup summary feels quite consistent with the evidence we went through today.
Until proven otherwise, my base case is that we’re experiencing a run-of-the-mill correction, whilst heading into a month where corrections are a very normal and expected occurrence.
The weird thing about seasonality statistics, is that every man and his dog with an algorithm trades the statistics, making it a self fulfilling prophecy.
What will really cook the goose, is that whenever everyone starts trading the statistics, they usually stop playing out that way, just to catch everyone off guard…
…but that’s enough speculation for one day…
Sit tight folks, the market is doing what it usually does…again.
Thanks for reading,
James
Looking for an Onchain Data API?
My friend The Bitcoin Researcher has just rolled out a new API for Bitcoin onchain data which has just about every metric you’d want. I’ve had a few folks reach out looking for API access, and I highly recommend checking this service out if you’re interested in playing with the underlying data feeds.
Another outstanding analysis 👏
thanks Check, I've had my plan for this bull market since early 2024. so far its been working fine, and like you say, helps me keep my emotions and emotional decisions in check. This drop around jackson hole before and after kinda made my gut worried. All your charts and science have shown me that I'm not wrong in assuming that SO FAR. and dont pull the trigger ever out of emotion.
I really needed this report for my piece of mind and to let my head take back over from my fear/greed urges.
ps. setting up my daily DCA has helped soooo much with this too.