

One of the most requested topics I receive, and at no surprise, is to cover how I think about finding Bitcoin cycle tops. You will often hear me saying that I don’t anchor to a specific price, nor date target, as these are ultimately completely arbitrary guesses.
Instead, I want to watch out for the market mechanics that precipitate a bear, and then I will make the assessment that a top might be in. There are a few important ideas I keep in mind when tackling this problem:
Bear markets start when too many people, buy too many coins, at too high of a price.
HODLers are the ones that establish tops, after they distribute a sufficient volume of coins to oversaturate demand.
Demand is the ultimate unknowable variable in a bull market, as we never know who will, or won’t end up allocating to the asset.
The day after the best day of the bull market, is often the first day of the bear.
So with all that said, let’s run some numbers and see if we can establish whether a Bitcoin cycle top is likely to be in place today.
Disclaimer: This article is general in nature, and is for informational, and entertainment purposes only, and it shall not be relied upon for any investment or financial decisions.
Cycle Top Hunting
The tool below is a new one, and is designed to assess confluence across many sectors of the Bitcoin market. It helps me compare the current market conditions to those I would expect to see around cycle tops and bottoms, in the shortest possible time. As we run through the tool in this post and video, I will provide my assessment for whether I’m Concerned, Cautious, or Optimistic about what I see.
Importantly, this is an unlisted chart, and it will only be available for Paid subscribers to access.
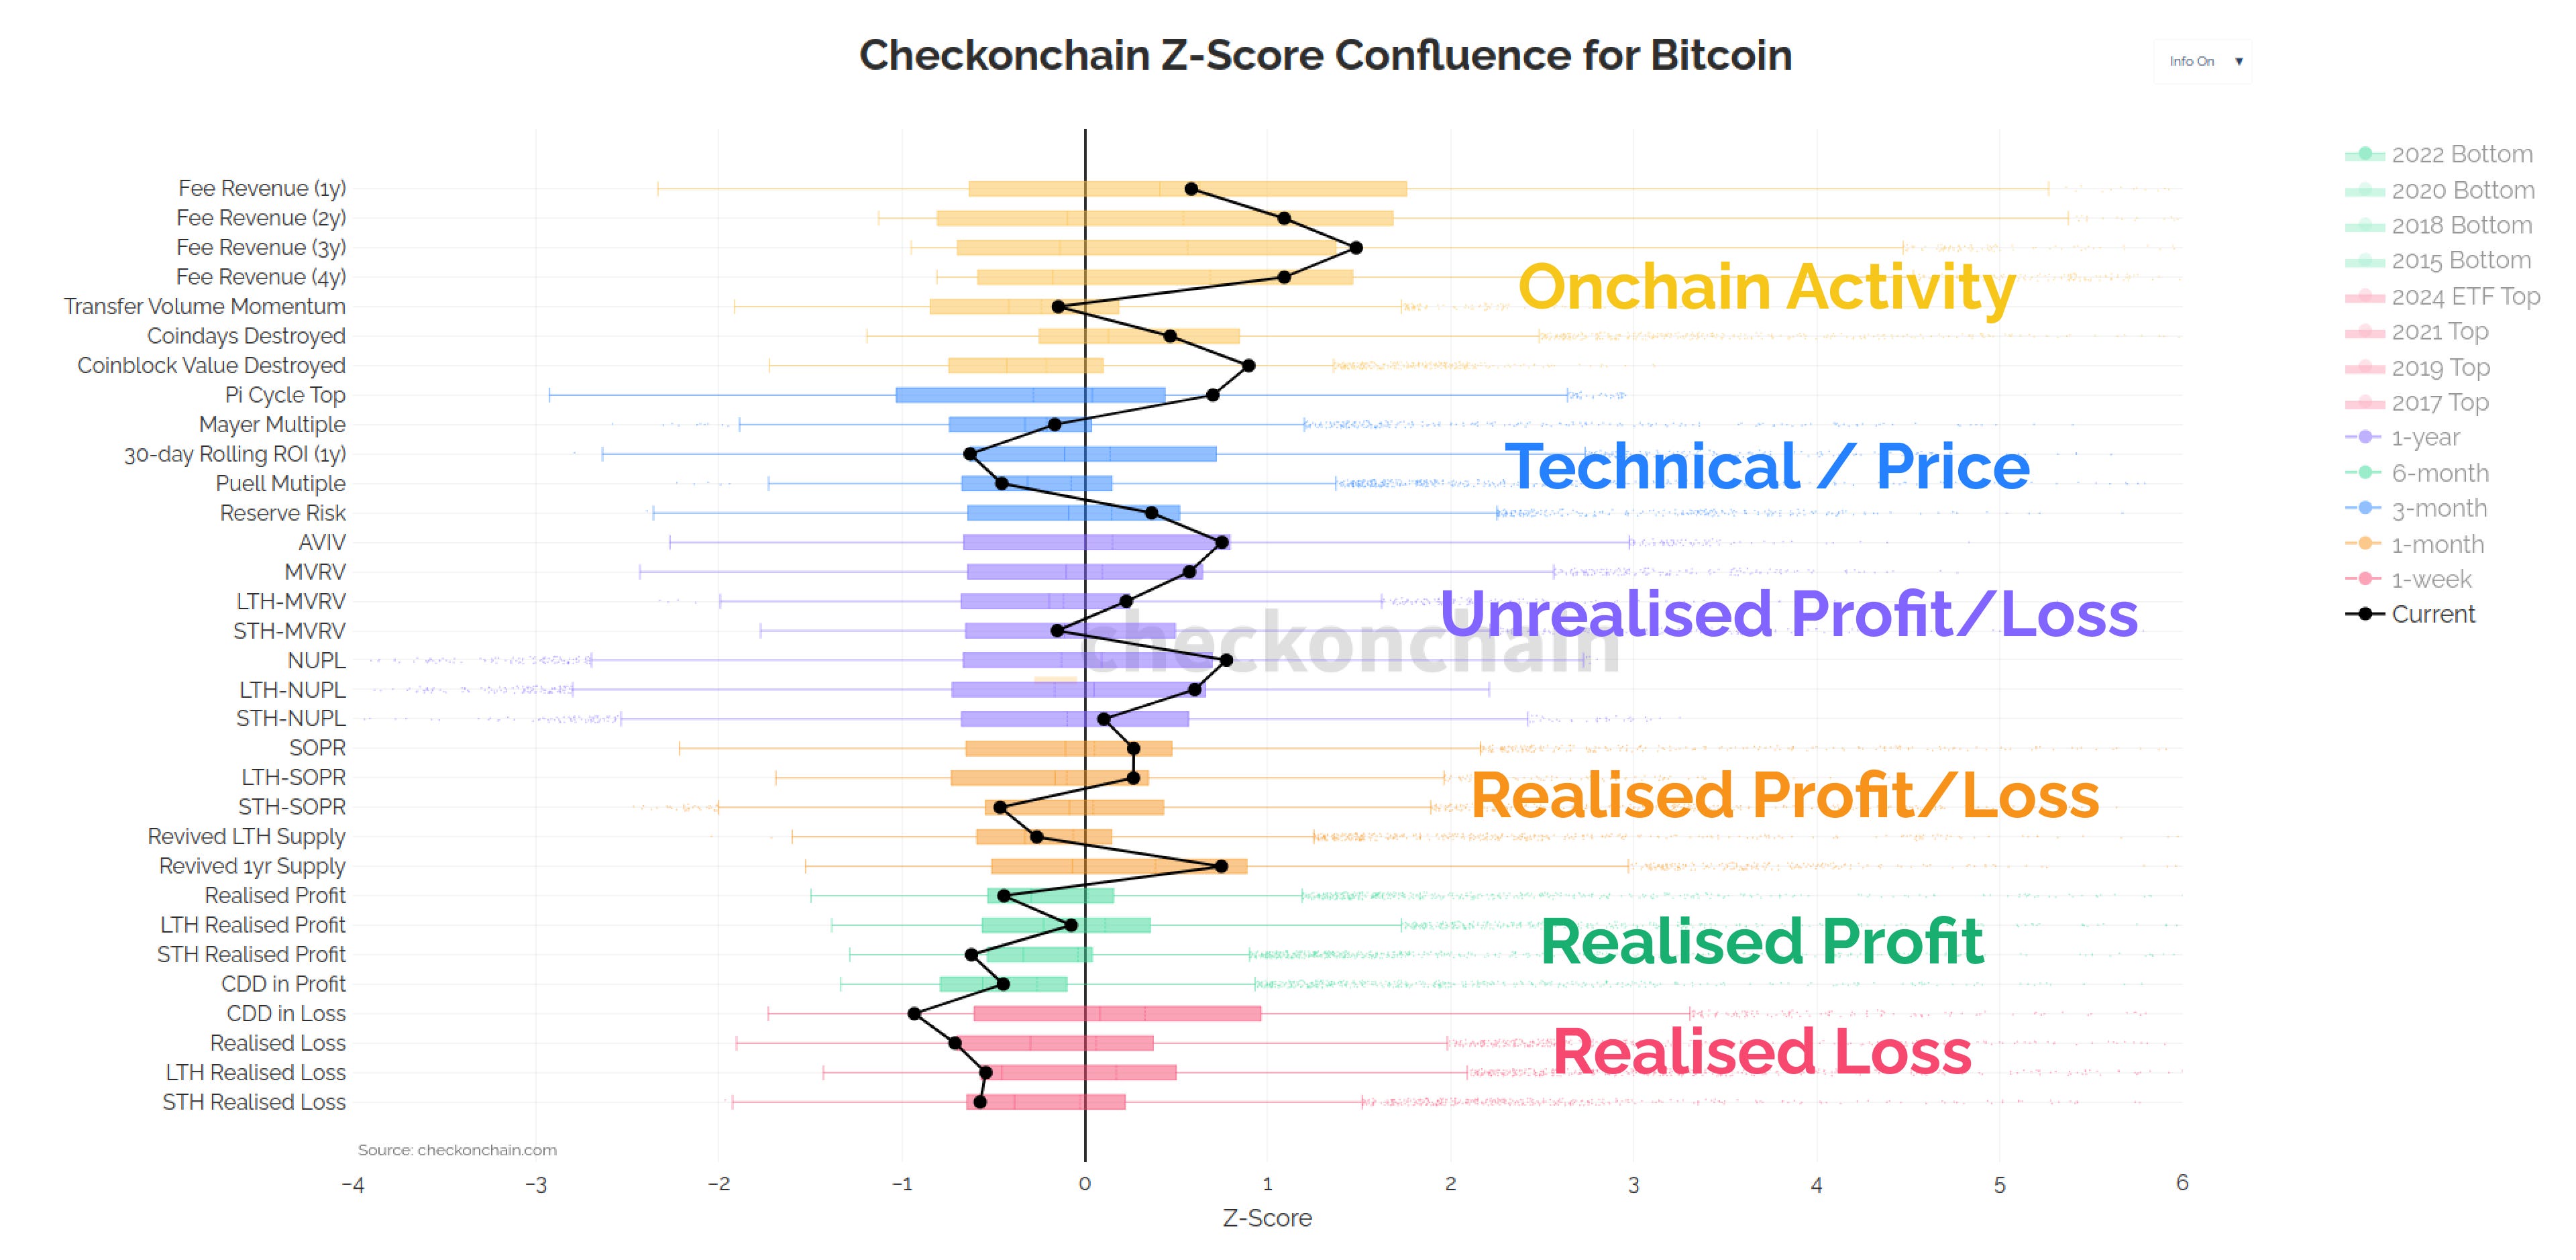
The chart is constructed as follows:
I have computed a Z-Score for a wide variety of metrics, each of which describe a particular sector or category of the Bitcoin economy. These Z-Scores are tailored for the characteristics of how each metric behaves.
The Box and Whisker plots show the distribution (population) of those Z-scores.
The thick candles represent the middle 50% of observations, and the whisker tails are the upper and lower 25% of values.
The thick black line shows the current Z-Score value for each metric so we can assess where we currently are.
In sports terminology, this tool helps us visualise how deep into the four innings we are.
The further we deviate from the centre line, the more extreme the market conditions are (and thus the less likely they are to persist).