

X-Ray Vision
One of the great advantages of onchain data is we have a degree of X-ray vision at the poker table. We can't see all the cards, but we can see a lot more than the dude looking at his hand only.

G’day Folks,
I have said this before, but onchain data really feels like having a degree of X-Ray vision at the poker table. We can’t see all the cards on the table, but we can see a lot more of them compared to the dude who’s only looking at the cards in his hand.
Over recent months, I’ve been using URPD charts to identify price zones of interest, where concentrations, or gaps in supply are located. This was a key tool we used to think about the $73k to $86k ‘air-pocket’ ahead of time.
I’ve been working through the full history of these metrics, and have finished building a suite of heatmaps to visualise these market dynamics in full colour.

Today, I want to introduce a few of these heatmaps, and use them to explore the current market conditions. I will touch on the following ideas:
How I think about support and resistance using onchain data.
Assess whether the current market is ‘Top Heavy’.
Analyse how investors are responding to this drawdown.
Share my thoughts on the delineation between bull and bear markets, and whether the 4yr cycle is a thing of the past.
We’re going to leverage the X-Ray vision onchain data provides to better understand the areas of interest for navigating the next few months.
I suspect conditions will be trickier to navigate than a lot of people expect.
📈 Reminder: you can find the charts from our articles on the Checkonchain Charting Website, and a guide in our Charts Tutorial Video.
Disclaimer: This article is general in nature, and is for informational, and entertainment purposes only, and it shall not be relied upon for any investment or financial decisions.
TL;DR
Bitcoin is currently trading at $83k, which is near the upper bound of the $76k to $86k ‘air-pocket’. The market has bounced from $76k, but not yet with the ‘escape velocity’ I would have hoped to see.
We are seeing some signs that ‘top buyers’ are capitulating out, but we also are not seeing a meaningful influx of new demand, and the ETFs have shed $4B over the last 30-days.
From both a Supply, and an Unrealised Loss perspective, Short-Term Holders are now Top Heavy. This means there is a reasonable case to be made that the recovery could take months, not weeks to resolve.
On the downside, the 2024 Chopsolidation range remains my base case for where ultimate support would be found, with the True Market Mean at $64k being the most formidable line of defense.
On the upside, until the market can convincingly clear the STH cost basis at $93k, Check the Analyst maintains a cautious near term view. Q1 has been choppy and difficult to navigate, and it looks like Q2 could be much of the same.
Full Premium Video
In The Pocket
As you know, I do not pretend to know the future.
That said, when you spend enough time in markets, you will inevitably notice patterns that seem to play out time and time again. This pattern recognition helps build our intuition of what is possible, and what may happen.
We don’t need to know what will happen to prepare for it.
The heatmap below shows the distribution of USD invested in Bitcoin. It looks at the value of each UTXO at the time it last moved onchain, with darker colours signifying larger accumulation ranges.
What becomes immediately obvious are the two ‘air-pockets’, one between $20k and $30k in the last cycle, and another between $73k and $86k today.
When price shoots up very quickly, very few coins have the opportunity to transact in that region. There are few consolidation periods, and that means investors are unsure how much demand actually exists in that zone.
Not every air-pocket has to be filled in and tested…but really big ones like these, often are. The market is a confidence machine, and it tends to seek out weaknesses and pain points to see just how robust the demand profile is from the bulls.
Now, the 2021 air-pocket took a LOT of damage to back-fill. We needed a massive amount of fraud in LUNA, 3AC, and FTX to get there…but we filled it in nonetheless.
Notice how an equally massive amount of accumulation took place as the dust settled in late 2022. It somewhat resembles the density of the 2024 Chopsolidation range.
In a way, I view the 2024 Chopsolidation as a sort of ‘bear market floor’…weird concept for a bull market!
The impact of this is I expect the 2024 Chopsolidation range to be formidable support if we reach it. The market has proven demand exists there.

Whilst the previous heatmap shows the distribution of ‘USD Invested’, the next one shows the volume of BTC held at each price zone (i.e. supply not dollars). Red hot colours indicate dense supply concentrations, and yellow colours show much thinner demand regions.
An interesting characteristic of the 2023-25 cycle has been the emergence of sideways ‘chopsolidation ranges’, and we have seen three of them so far.
All three resulted in significant volumes of coins changing hands, representing both heavy sell-side activity, and major waves of demand coming in to absorb it.
In our current environment, we have now dropped firmly below the red hot zone above $90k, which is not something we saw in the 2023 or 2024 instances.
I would argue that we have to consider this correction in a slightly different light to the previous ones. My default assumption is this one may take longer to properly recover from.

The URPD chart shown below is effectively a vertical slice of the heatmap above at today’s date. The bar heights correspond to the ‘heat signature’ above.
The 2025 ‘Top’ zone consists mainly of coins acquired above $90k, and as we know, these are all now held in a state of unrealised loss (shown as red bars).
The ‘air-pocket’ is starting to be back-filled, with around 833k BTC now located between $80k and $85k (around 4.2% of the circulating supply).
Notice how there are more coins at $85k vs $80k, which suggests a majority of dip buyers may be ‘FOMO buying’ on bounces, thinking new ATHs are right around the corner. I suspect the conviction of these folks will be tested again, which may look like the market dipping back into the $70ks.
The 2024 Chopsolidation is still home to around 18.2% of the Bitcoin supply, and in my best estimation, is likely to be a key area of demand if we reach it.
As it stands, we’re working out how much demand the bulls are willing to front in the air-pocket.
The 2024 chopsolidation range is likely to be formidable support on the downside, but we are still some distance below the STH cost basis, which has so far been resistance at around $92k.
Check the Analyst is maintaining a more cautious near-term stance as a result.

Short-Term Pain
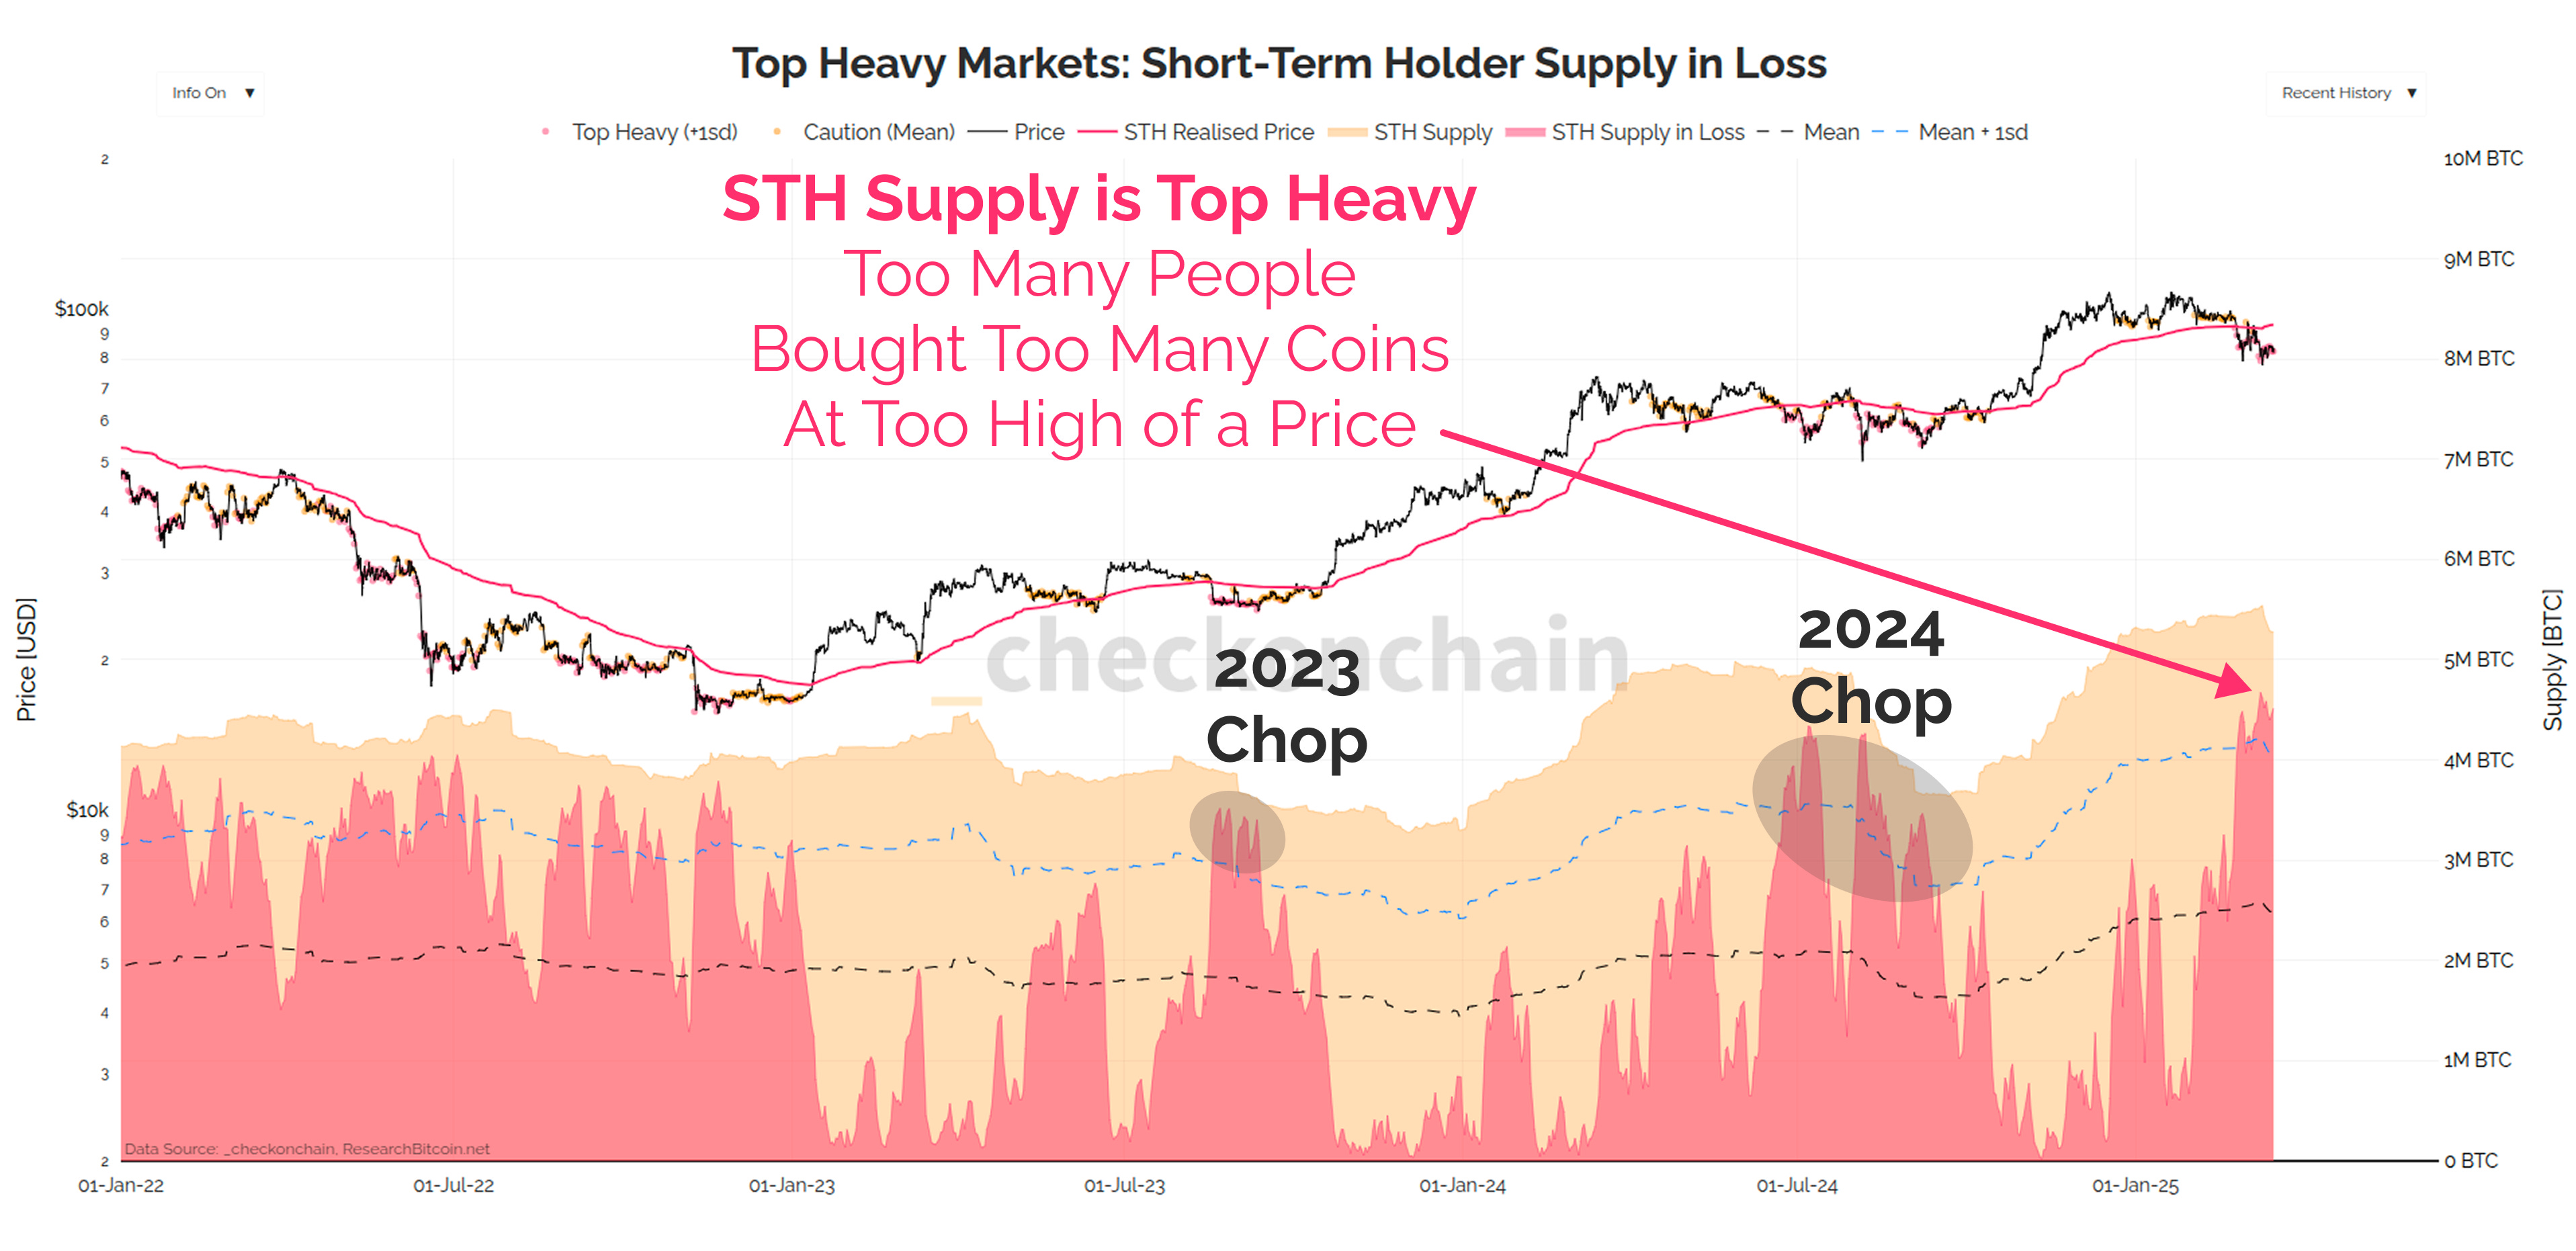
The very first edition of the newsletter introduced the concept of a ‘Top Heavy Market’. As a quick refresher:
Top Heavy Markets are relatively risky environments which occur after a strong bull market trend. All of the new demand that acquired supply at high prices, now becomes at risk of capitulating when the market sells-off below their cost basis.
Bear markets tend to form after too many people, buy too many coins at too high of a price.
Most of the time, our first focus in this analysis should be on Short-Term Holders, as they represent the most recent buyers. If we look at their supply, 4.5M out of 5.2M BTC (86%) is now held below its cost basis, which technically flags a Top Heavy signal by this supply metric.
A lesson I personally learned in 2024 was to also consider the ‘magnitude’ of these losses. Just because a coin is ‘in loss’, doesn’t mean it is ‘badly in loss’.
Buying BTC and then being down -5% for a few weeks is just another day in the office for most HODLers.
Buying a big wad of BTC and then watching the market crater -30% below your buy point…really sucks, and is more likely to break sentiment.
That is why we bolster the above SUPPLY chart, with the UNREALISED LOSS chart below. Unrealised losses measure how bad the drawdown is relative to the paper gains Short-Term Holders are holding.
Unfortunately, we also have a Top Heaviness signal here as well.
Now, that obviously isn’t the end of the story, and you will notice that all three choppy periods this cycle have flagged top heaviness, but the last two then recovered, hitting new cycle highs.
There is no doubt in my mind that the 2023+ cycle has been very different in its behaviour. Bitcoin investors seem willing to HODL through longer painful periods, perhaps because they know what they own, and why they own it.
Just because we are Top Heavy, doesn’t mean we’re dead and buried. It does mean we should be cautious for now, but we need to dig deeper to see how it looks under the hood.

Bringing STH supply into a heatmap, we can see just how incredibly dense the concentration is above $90k. In many ways, it looks just like the March to June period in 2024, which took until November to properly recover from.
Also notice the True Market Mean Price in blue ($64k), which I view as the most likely spot for a ‘bear floor’ to be established (if and when we need it).
This price model seems to be following us ‘one chop behind’.
What I mean here is the True Market Mean is a level that seems to hover around the previous major demand region. I view it as the last area where the market established major confidence that Bitcoin belongs above it.
I don’t know if this correction will be the one that blurs the lines between a bull and a bear market. However, if it is, I expect the True Market Mean at $64k to be where the bulls last stand is fought.
ICYMI: If you’re unfamiliar with how I developed the idea of the True Market Mean acting as a bear market floor, I would encourage a review of Rethinking Bears where I lay out my logic.

Blurred Lines
A thesis I have held for some time now is that this cycle is the one which will break everyone’s mental model for what a Bitcoin cycle is. I believe the lines between a classic bull and bear cycle will become increasingly blurred, and many people will make the wrong decision based on their prior expectations for history to repeat (and forgetting that it often rhymes).
A quick summary of my views:
If there was ever a time for the classic 4yr cycle to break, this is the cycle for that to happen.
Bitcoin investors are no longer primarily reacting to Bitcoin, but are instead using Bitcoin as an investment vehicle to respond to the weird world around us.
Bitcoin is now so large that retail no longer dominate flows, and we’re in the transition period towards institutional capital being the marginal buyer/seller.
Bitcoiners (retail) and institutions alike tend to have long-time horizons. It is pretty clear now that Bitcoin is on a trajectory towards a global reserve asset, and I suspect many will happily HODL their winning ticket for many years to come.
I struggle to envision a classic -80% bear from our $109k ATH taking us to $22k. I also struggle to see a -60% correction to $43k, which would undo performance since both clearing a $1T market cap, and the launch of the ETFs.
Therefore, if my above thesis holds, a -40% ‘bear’ would take us back down to the True Market Mean at $64k. If this happened, many would think that a bear market has taken hold, and would be in full effect.
The panic and fear would be palpable.
I would argue (read: speculate)…that if this happened, it would be a sign the bear market has almost finished. Folks may start to lose track of when the bull ‘ended’, and when the ‘cycle began’.
My base case is this kind of confusion will break many people’s pattern matching based on previous cycles. They won’t know when to start and end their cycle analysis.
Is it a Super cycle? A Short Cycle? A Sideways Translated Upside Down Cycle?
It’s probably none, and all of the above at the same time.
I’ve let such thinking go, and instead try to read into how Bitcoin investors are reacting and responding in the moment. Let the market tell you what it thinks, instead of applying our expectations to the market.
The Investor Response
Ok, we’ve covered a lot so far, and you will notice the moderately bearish tilt to my thesis above. Let’s see how Bitcoiners are reacting and responding to the correction, in order to better calibrate our thinking.
On the demand front, things are pretty weak in the immediate term. Capital inflows are trending back towards neutral, and the ETFs have seen $4B in net outflows over the last 30-days.
This doesn’t look like a demand wave sufficient to justify a move back to ATHs, and supports a more cautious view for now.

Long-Term Holder supply has stopped declining.
This means there are more coins maturing across the 5-month threshold than are being spent taking profits. If LTH supply starts trending higher, that would signal a reduction in net sell-side from existing holders, which reduces resistance, and is a net good sign.
However, there is still a process required to fully absorb the 3.25M BTC which was sold over the last 12-months, and I suspect that process of re-accumulation is going to be on the order of months, and not weeks.

Top buyers are also capitulating at one of the highest levels since the 2022 bear. In terms of magnitude, Realised Losses are sitting halfway between a typical bull market correction, and the full panic levels we see in bears.
My base case is that this still looks relatively controlled and healthy.
I don’t yet have a sense that we have broken the spirit of the bulls, but many Short-Term Holders are certainly stressed, and have itchy fingers.
Perhaps one more wash-out will be enough to fully capitulate, but we will have to wait and see.

STH-SOPR still has the desired ‘short-sharp undercut’ pattern we like to see when shaking out top buyers. Over the course of the next few weeks, I want to see this metric spring back into the green zone, and preferably stay there.
If SOPR remains below 1.0 for too long, it starts to signal sustained panic and fear, which often signals a longer term drawdown is afoot.

Concluding Thoughts
The current market is very tricky to read, and we are largely at the whims of broader macro conditions (as covered in Structural Shifts).
For the time being, my base case is that we probably have to chop around inside this air-pocket for a little while yet, with my logic being:
I have not seen signs of a huge wave of demand inflow buying the dip.
We’ve bounced off the $76k low…but have not quite achieved the ‘escape velocity’ I would have hoped to see. Price hasn’t bounced ‘hard enough’ to signify the bulls definitively stepped in to arrest the fall.
We have a fully confirmed Top Heaviness signal, although keep in mind we have recovered from the last two.
Dip buyers appear to be buying ‘high’ at $85k rather than capitalising on panic events below $80k. I have a gut feel the conviction of these folks may need to be tested as well.
Macro headwinds are still blowing, and it is affecting most asset classes. The macro storm isn’t over yet, so I am staying cautious.
My core view remains that 2025 will be a choppy and difficult year to navigate. Q1 certainly has been so far, and it probably will continue through Q2
That said, I retain an overall positive outlook for 2025, when all is said and done.
Markets have a way of testing our patience…and this is often what it looks like.
I think we’re more likely to be tested via ‘time-pain’, than we are through ‘downside-pain’.
For Check the Analyst, I remain cautious of the current conditions. Trying to name whether we are in a bull or a bear is probably more of an academic distraction than a useful exercise. On the downside, I think a revisit to the upper bound of the 2024 Chopsolidation range is likely with 40-50% odds. I think the True Market Mean at $64k represents a deep value zone, with maybe 20% odds of being reached. Chopping around the air-pocket for the foreseeable future seems the most likely outcome for now, but I would speculate that new ATHs are still on the cards later in the year.
For Check the HODLer, this means I am very happy to be a patient buyer, and allow the market to come to me. I will avoid FOMO buying into sharp upwards rallies as I suspect there will be dip opportunities throughout this recovery process. Since my base case is that we ultimately resolve higher (say in 12mths time), I would also be pretty disappointed if I hadn’t stacked sats in the low $80k and $70k region. I have a thesis for how bad the downside could be, and will make my decisions on that basis.
If we get a powerful wave of demand tomorrow, and rip higher, happy days. Right now, that’s not my base case, so I will be watching for signals of seller exhaustion (and fresh demand) in the weeks ahead.
Thanks for reading,
James
Hi James,
You deserve a lot of credit for putting forth a bold hypothesis—that this cycle is different—and you may be right.
The human mind tends to operate within existing categories. Now that all Bitcoin investors are familiar with the market structure of previous cycles, they naturally expect history to repeat itself. Accordingly, the bulls anticipate a breakout from this range straight to $250K, while some bears predict a bear market with an 80% correction from the ATH.
However, it's worth considering that neither scenario may play out 100% and that we might need a new framework for analyzing Bitcoin’s market structure. If the pattern since 2023 repeats, then months of "chopsolidation" followed by a run to $150K–$160K before becoming top-heavy again—just as you predict—could prove prophetic.
Hey James,
I know that investing strategies vary based on individual situations, but since you’re a young investor, I’m curious about your approach. Do you typically hold through both bull and bear markets, riding out the cycles? Or do you prefer to sell a significant portion at the peak of a bull market to have enough capital to reinvest once the bear market bottoms out?
Would love to hear your thoughts on how you navigate market cycles!
Thanks!