

Leaking Lower
The bear flag Bitcoin has been trading in since November keeps leaking lower, with the price looking like it wan't to make a trip back down towards the 2024 chopsolidation range.

G’day Folks,
It’s not the market any of us want, but it is the one which is in front of us.
The Bitcoin price has failed to show a great deal of strength in 2026, and is currently peering into the abyss, looking like it wants to break below $80k.
The low $80k region is actually a fairly important psychological level for the market, as it aligns with three thresholds:
The True Market Mean ($81k) which is the average onchain cost basis for investors who are active in the market.
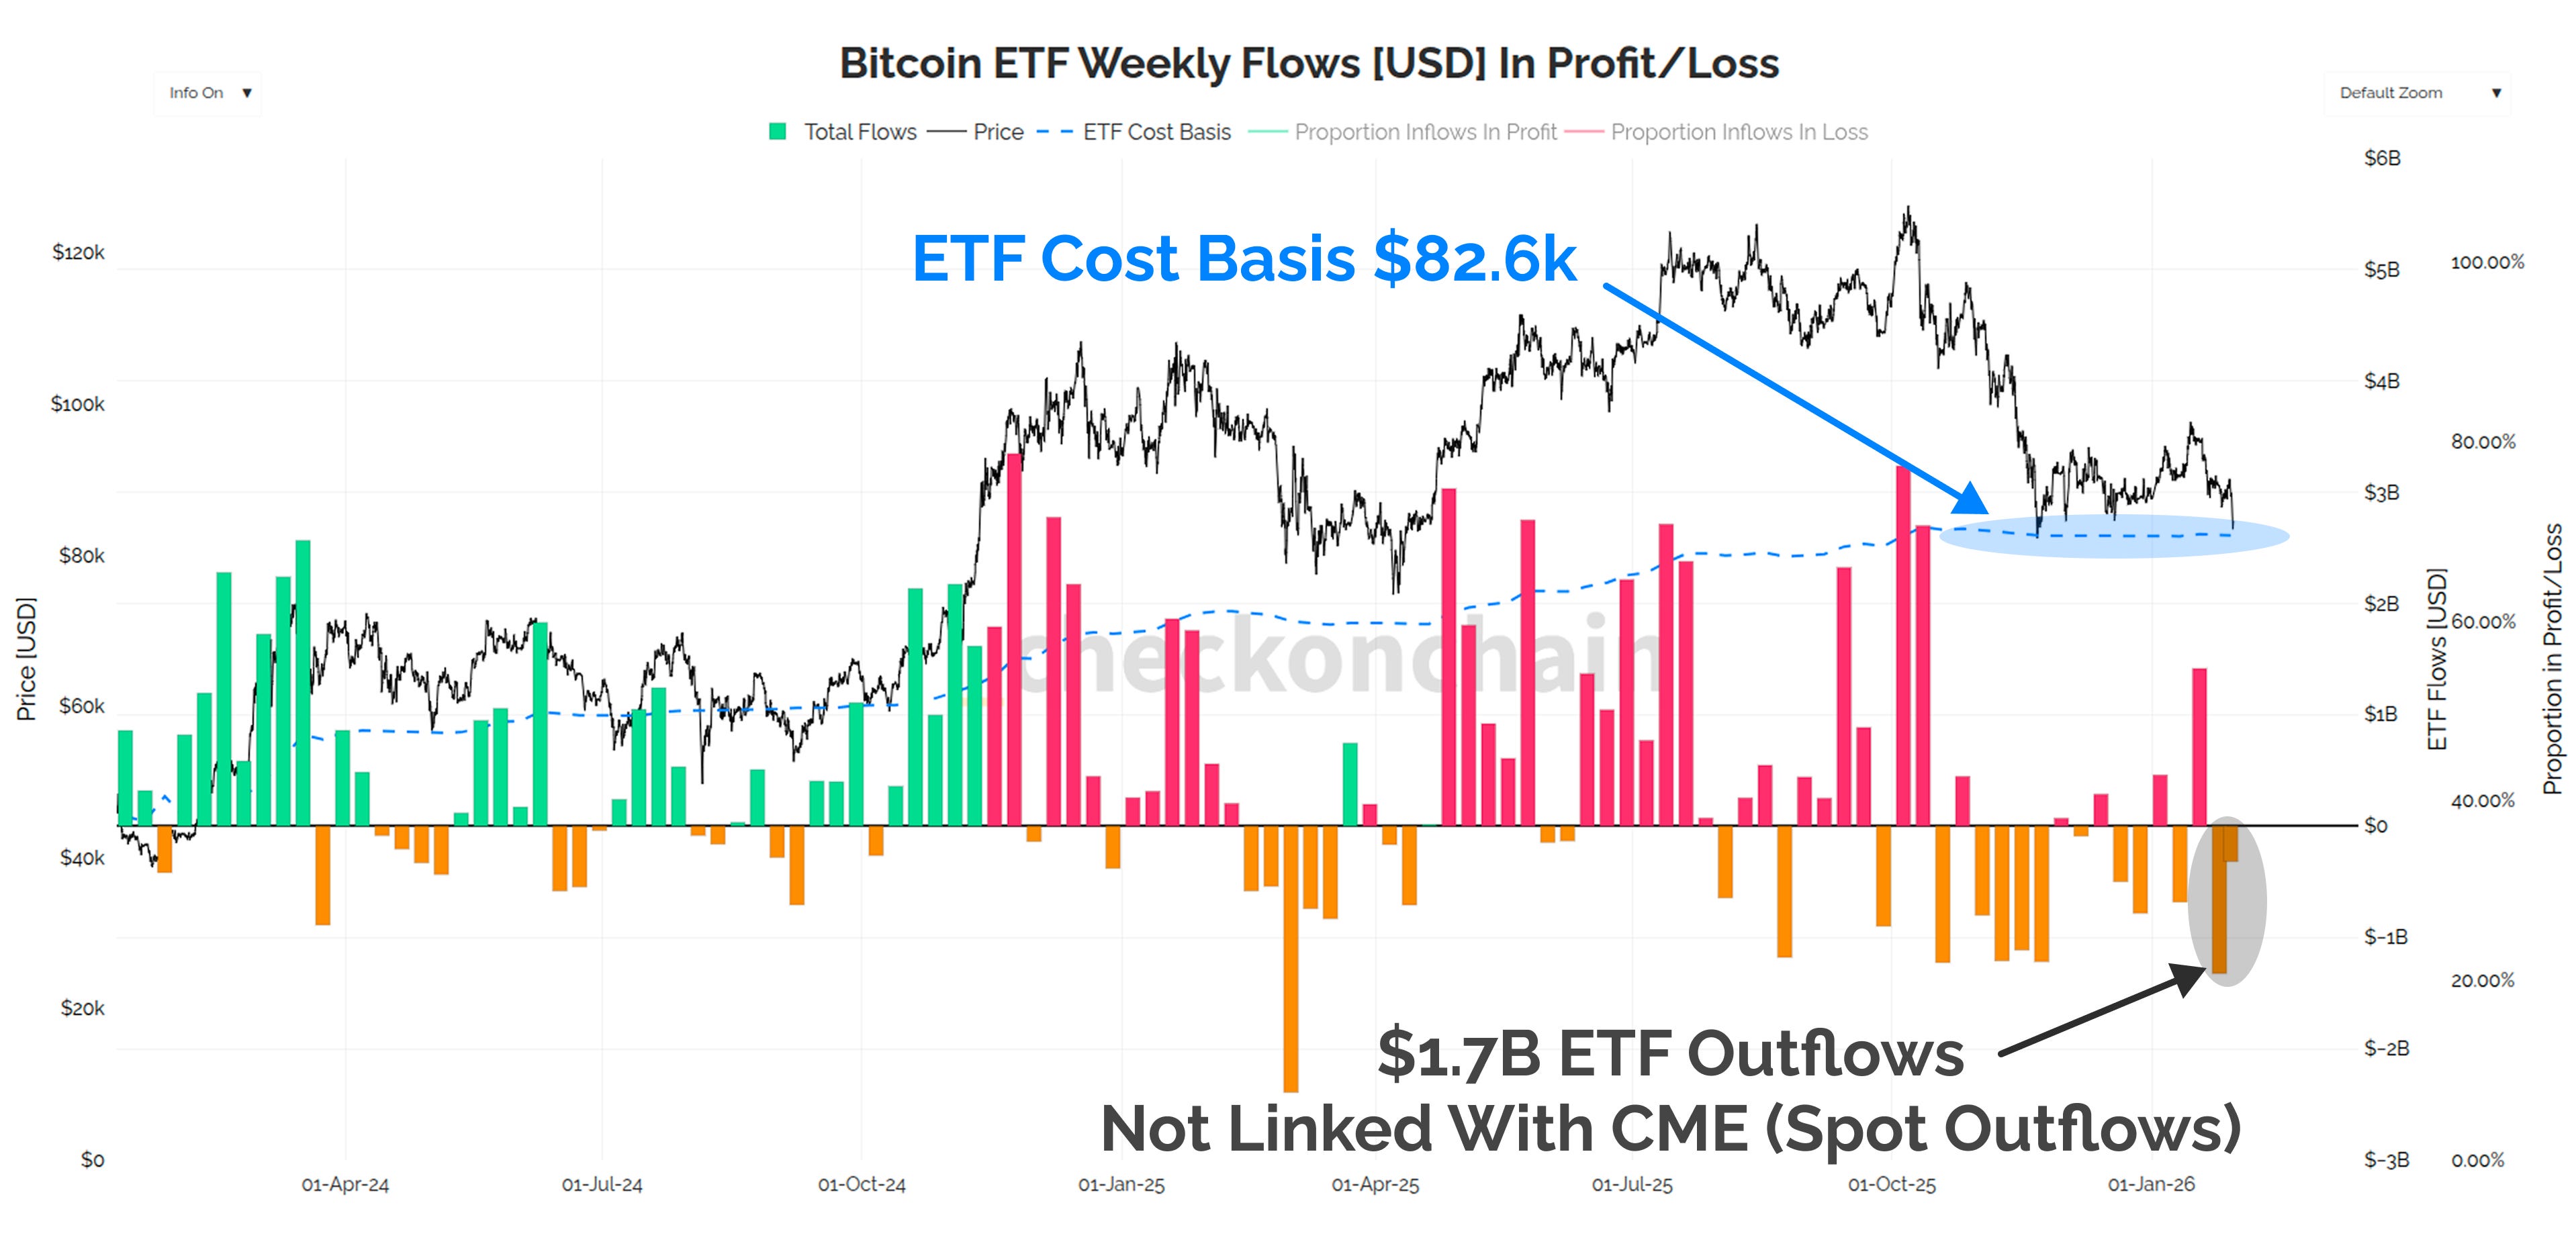
The average ETF inflow cost basis ($82.6k), and as it stands, over 60% of inflows have occurred at higher prices (thus assumed to be reflective of investors in loss).
The prevailing local low of $80k set in November, which technically speaking, a break below would reverse the monthly price chart into a downtrend.
Today’s post will be a continuation of Monday’s analysis, where we assessed the probabilities for where this bear market is expected to ultimately find its floor.
I have translated these probabilities into a bear market floor price model, which we can combine with onchain tools to gauge when a full scale capitulation hasd taken place.
When the days are darkest, that is usually where the point of maximum opportunity emerges for the patient, high conviction investor. Whilst many are bailing out on Bitcoin, we’re entering the period when it is the most valuable time to be paying attention.
📈 Reminder: you can find the charts from our articles on the Checkonchain Charting Website, and a guide in our Charts Tutorial Video.
Premium Members will find the TL:DR summary, video update and the rest of the written post below. Consider upgrading to premium today to unlock the rest of the content!
Disclaimer: This article is general in nature, and is for informational, and entertainment purposes only, and it shall not be relied upon for any investment or financial decisions.
TL;DR
The Bitcoin price is currently peering into the abyss, trading into the $81ks, and looking like it wants to complete the bear flag break to the downside.
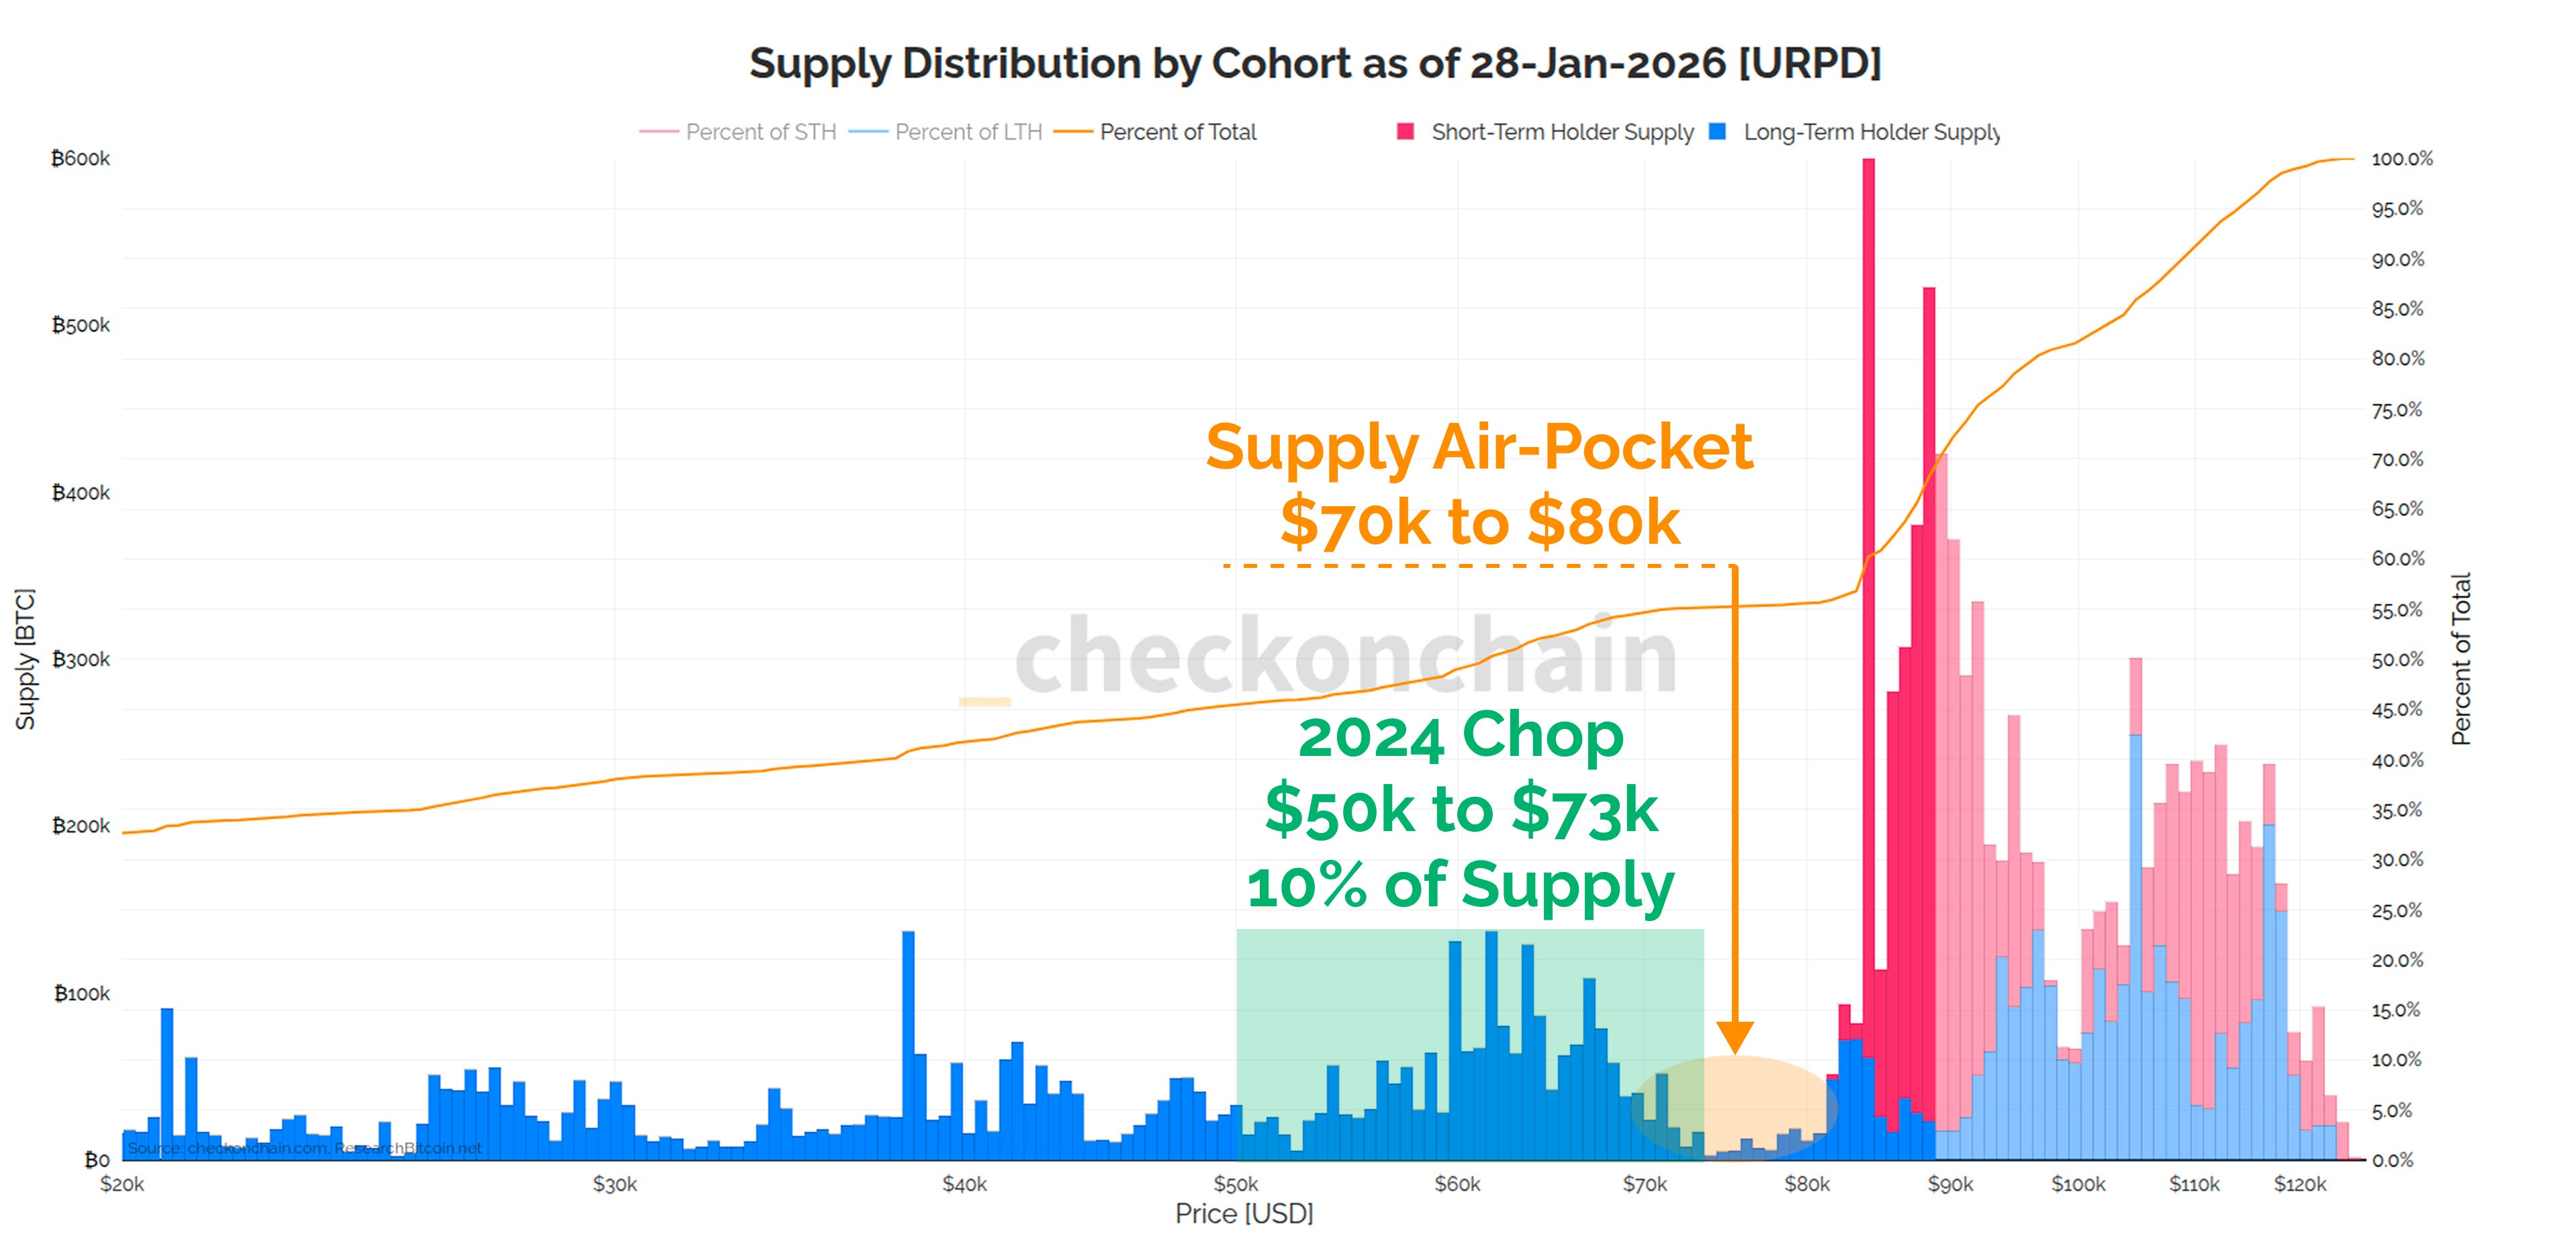
The supply air-pocket between $70k and $80k is an obvious space to fill, and this would bring us back into the 2024 chopsolidation range. I expect this move would be swift, as there is limited historical support in this price region.
From a technical, onchain, and probabilistic standpoint, almost every metric I track suggests bottom formation is most likely within the 2024 chopsolidation range, somewhere between the mid-$50ks, and $70k. It is very hard for me to construct a lower bound outside that range, because it would be highly abnormal behaviour (nothing is impossible, but some things are much less probable).
Realised profit volumes have fallen to levels as low as 2023, and Long-Term holders are clearly moving back into a behaviour coincident with waiting, and eventual accumulation.
Realised loss is primarily dominated by Short-term Holders for now, but I expect many of the Long-Term Holders who bough the $100k+ top will start to capitulate should this next move lower get underway.
My base case read, is that we’re about to enter the second phase of this bear, and we’re probably not too far away from generating sufficient investor-pain, to see a widespread capitulation event take place.
Establishing bear market bottoms are a gruelling process, that really suck to go through at the time. However, they also present the point of maximum opportunity.
It is human nature to give up hope, and walk away, often at the exact moment when one should be paying the most attention.
Make a plan, think through the probabilities, and stick to your plan if/when the market hits those thresholds. Don’t change your plan mid action, because that is when impulsive (and oftentimes dumb) decisions enter the fold.
The point of maximum opportunity will come, the trick is to make sure you’re paying attention when it does.
Full Premium Video
Inside Baseball
Here at Checkonchain have a unique lens into investor sentiment based on the inflow and outflow of our subscribers.
Given the style of analysis we do, we’re generally more attractive for investors who have a firm grasp on Bitcoin, a decent portfolio size allocated to it, and are interested in consuming insights with more detail and colour than your average headline. There is always an ebb and flow of folks, but there is a clear pattern of larger pools of people who come in the good times, and leave in the bad (just like markets).
Personally, I consider our community as a pool of smart money investors, and I know that many of you have stuck with us for a long time (thank you!).
There are a couple of interesting notes which I wanted to share with you, as I think it offers a unique lens into investor sentiment. We are currently seeing much softer inflows which alongside all the other bear market indicators we see, is a clear signal that the bull has lost it’s legs for the time being.
Cost of living / cutting back on costs (totally understandable, and normal to see).
Exiting Bitcoin, because the asset is shit (this is a new one over last few weeks, and is signal, signal, signal).
The second reason has my attention, because it shows we are well into a period of apathy, which is a classic characteristic of bear markets, and frankly, later stage ones.
What I want readers to take away from this, is that we are seeing many folks who only come for the good times, exiting stage left because ‘Bitcoin is done for’. There is a collective loss of interest due to some combination of:
The 35% drawdown, with little recovery.
Bitcoin not going up as much as was expected.
Envy over other assets going parabolic.
Ironically, the times when things feel the absolute worst, are actually the times when markets present the point of maximum opportunity. Bear market floors can be challenging, boring, brutal, and exhausting to survive, but once they are hammered in place…
…you want to be positioned for what follows.
Eyeing An Air-Pocket
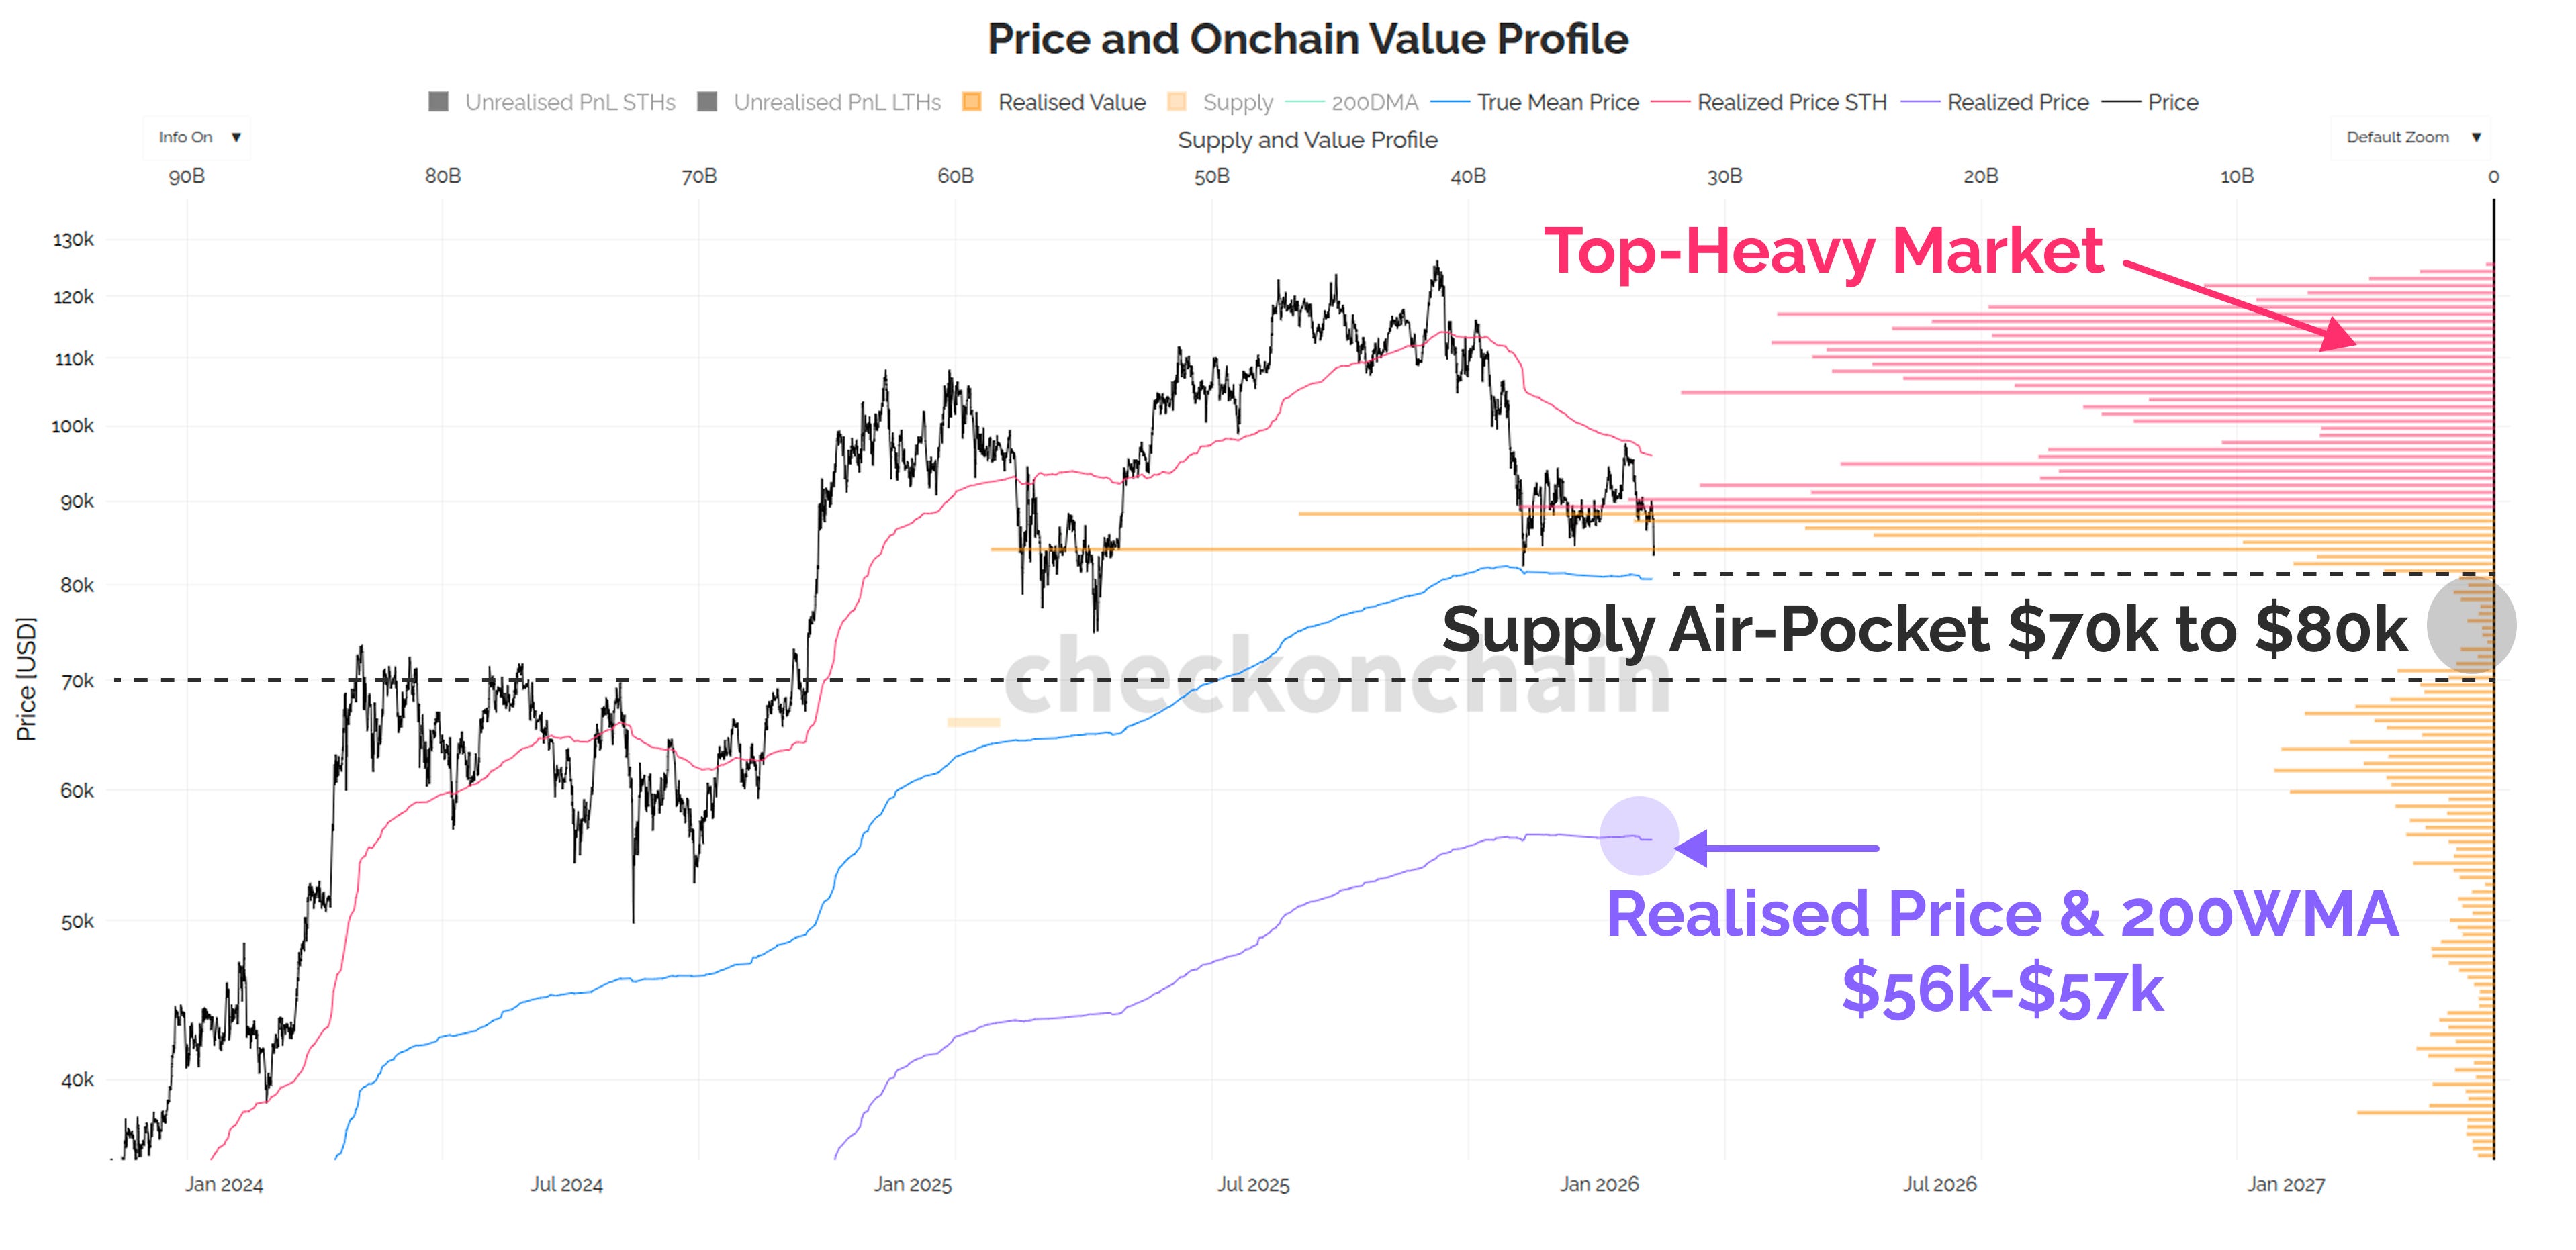
The chart below shows the Bitcoin price, overlaid with the onchain volume profile, which shows how the market’s USD denominated cost basis is distributed.
As we know, we are in a top heavy market, where too many investors, bought too many coins, at too high of a price.
With this sell-off down to $83k, we’re staring into the abyss below the True Market Mean (blue, $81k), with the supply air-pocket sitting just below it.
My base case at this stage, is that we likely trade below $80k, and then undergo a quick trip towards $70k, back-filling the air-pocket.
We can never predict in advance how it will play out, but there are two scenarios to think through:
Sharp sell-off, and quick V-shaped recovery. If we have a one week period where the market tests $70k, and then shoots back up to $90k, that’s very bullish. I also think this is the least likely of the two scenarios, as we just haven’t seen enough underlying strength so far.
Sell-off down to 2024 chopsolidation zone, and then hammer out a floor. This is my base case expectation for now. As we covered in Monday’s report, there will be a probability distribution as to where we find a low between $70k and the Realised price near $56k. Both are possible, but the odds for each are different.
Whilst there are a lot of similarities with May-2022, a key difference is the supply air-pocket below us is much smaller, and there are a lot of Long-Term Holder supply still located in that 2024 chop zone.
My base case is that we will have a lot more support on the way down, especially without major forced sellers like LUNA, 3AC, FTX etc.
Smart Money Snapshot
One of the super-powers of onchain data, is we can observe behaviour of smart money investors, and compare it to the more speculative, fast money types.
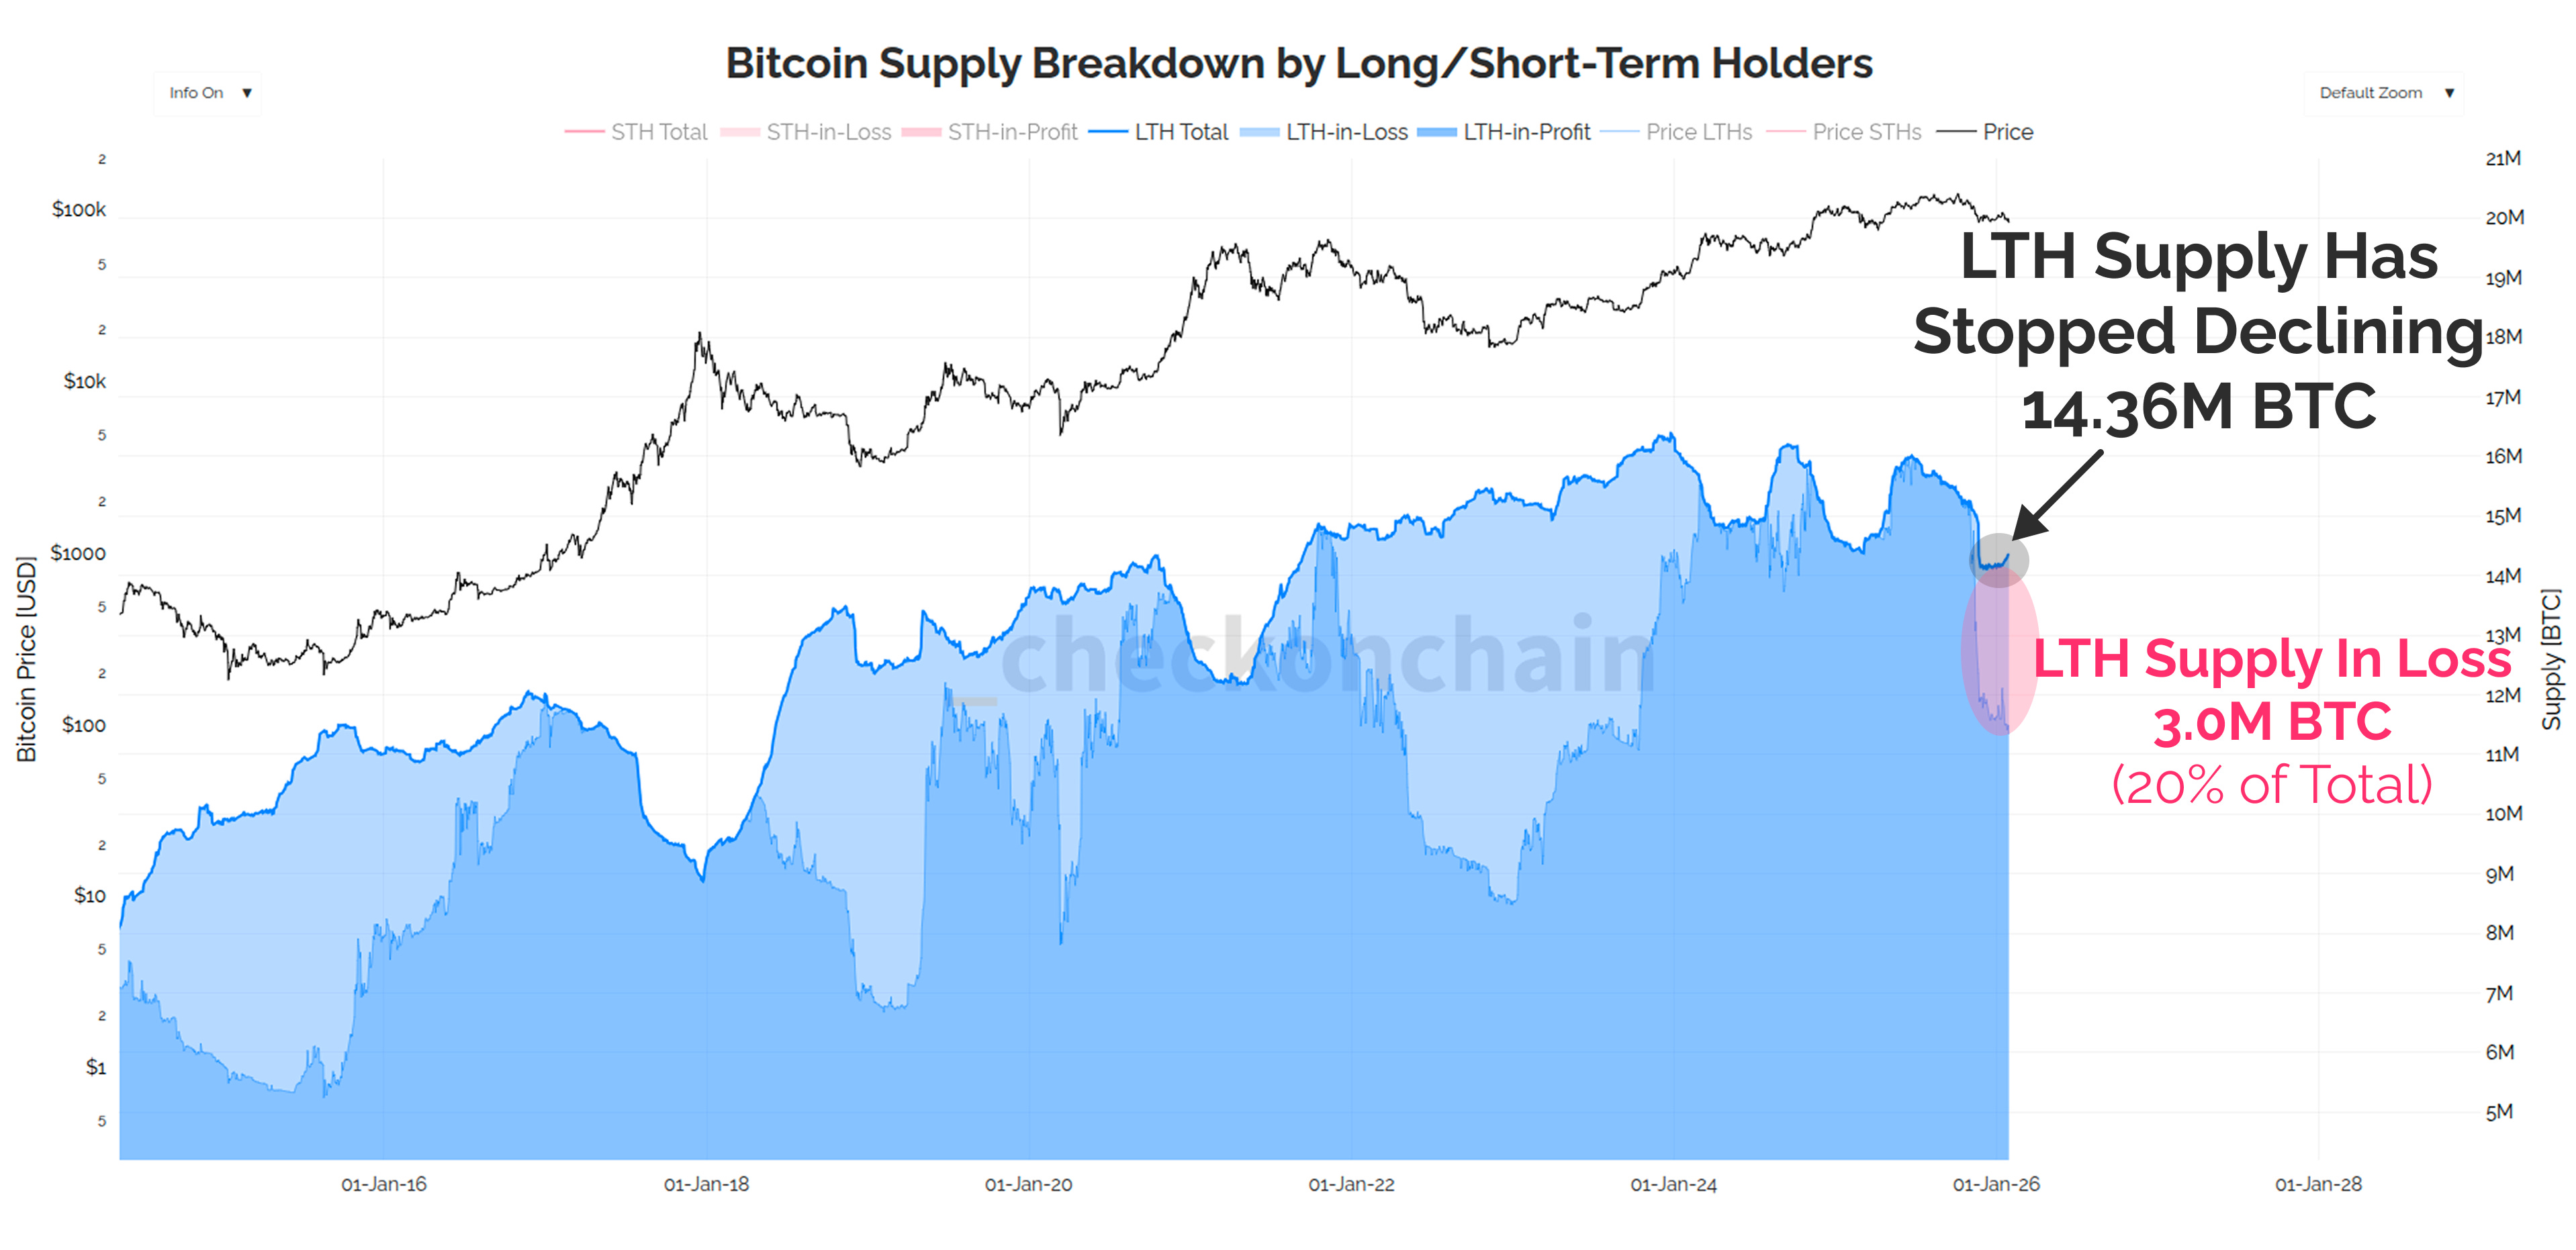
Long-Term Holder supply has now stopped declining, and is actually starting to creep higher once more.
Ignore anyone on twitter telling you this is LTHs buying and accumulating, it isn’t. Instead, this is telling us two things:
Folks who bought 5-months ago are still HODLing. These coins were acquired up to the end of August, so they are effectively ‘top buyers’, who are white knuckling it (or are so calm they don’t care).
In aggregate, LTHs have stopped spending. Since spending an old coin instantaneously makes it a young coin, this means the profit taking by HODLers has stopped.
Big picture, the smart money have stopped spending, and top buyers are increasingly entering LTH status.
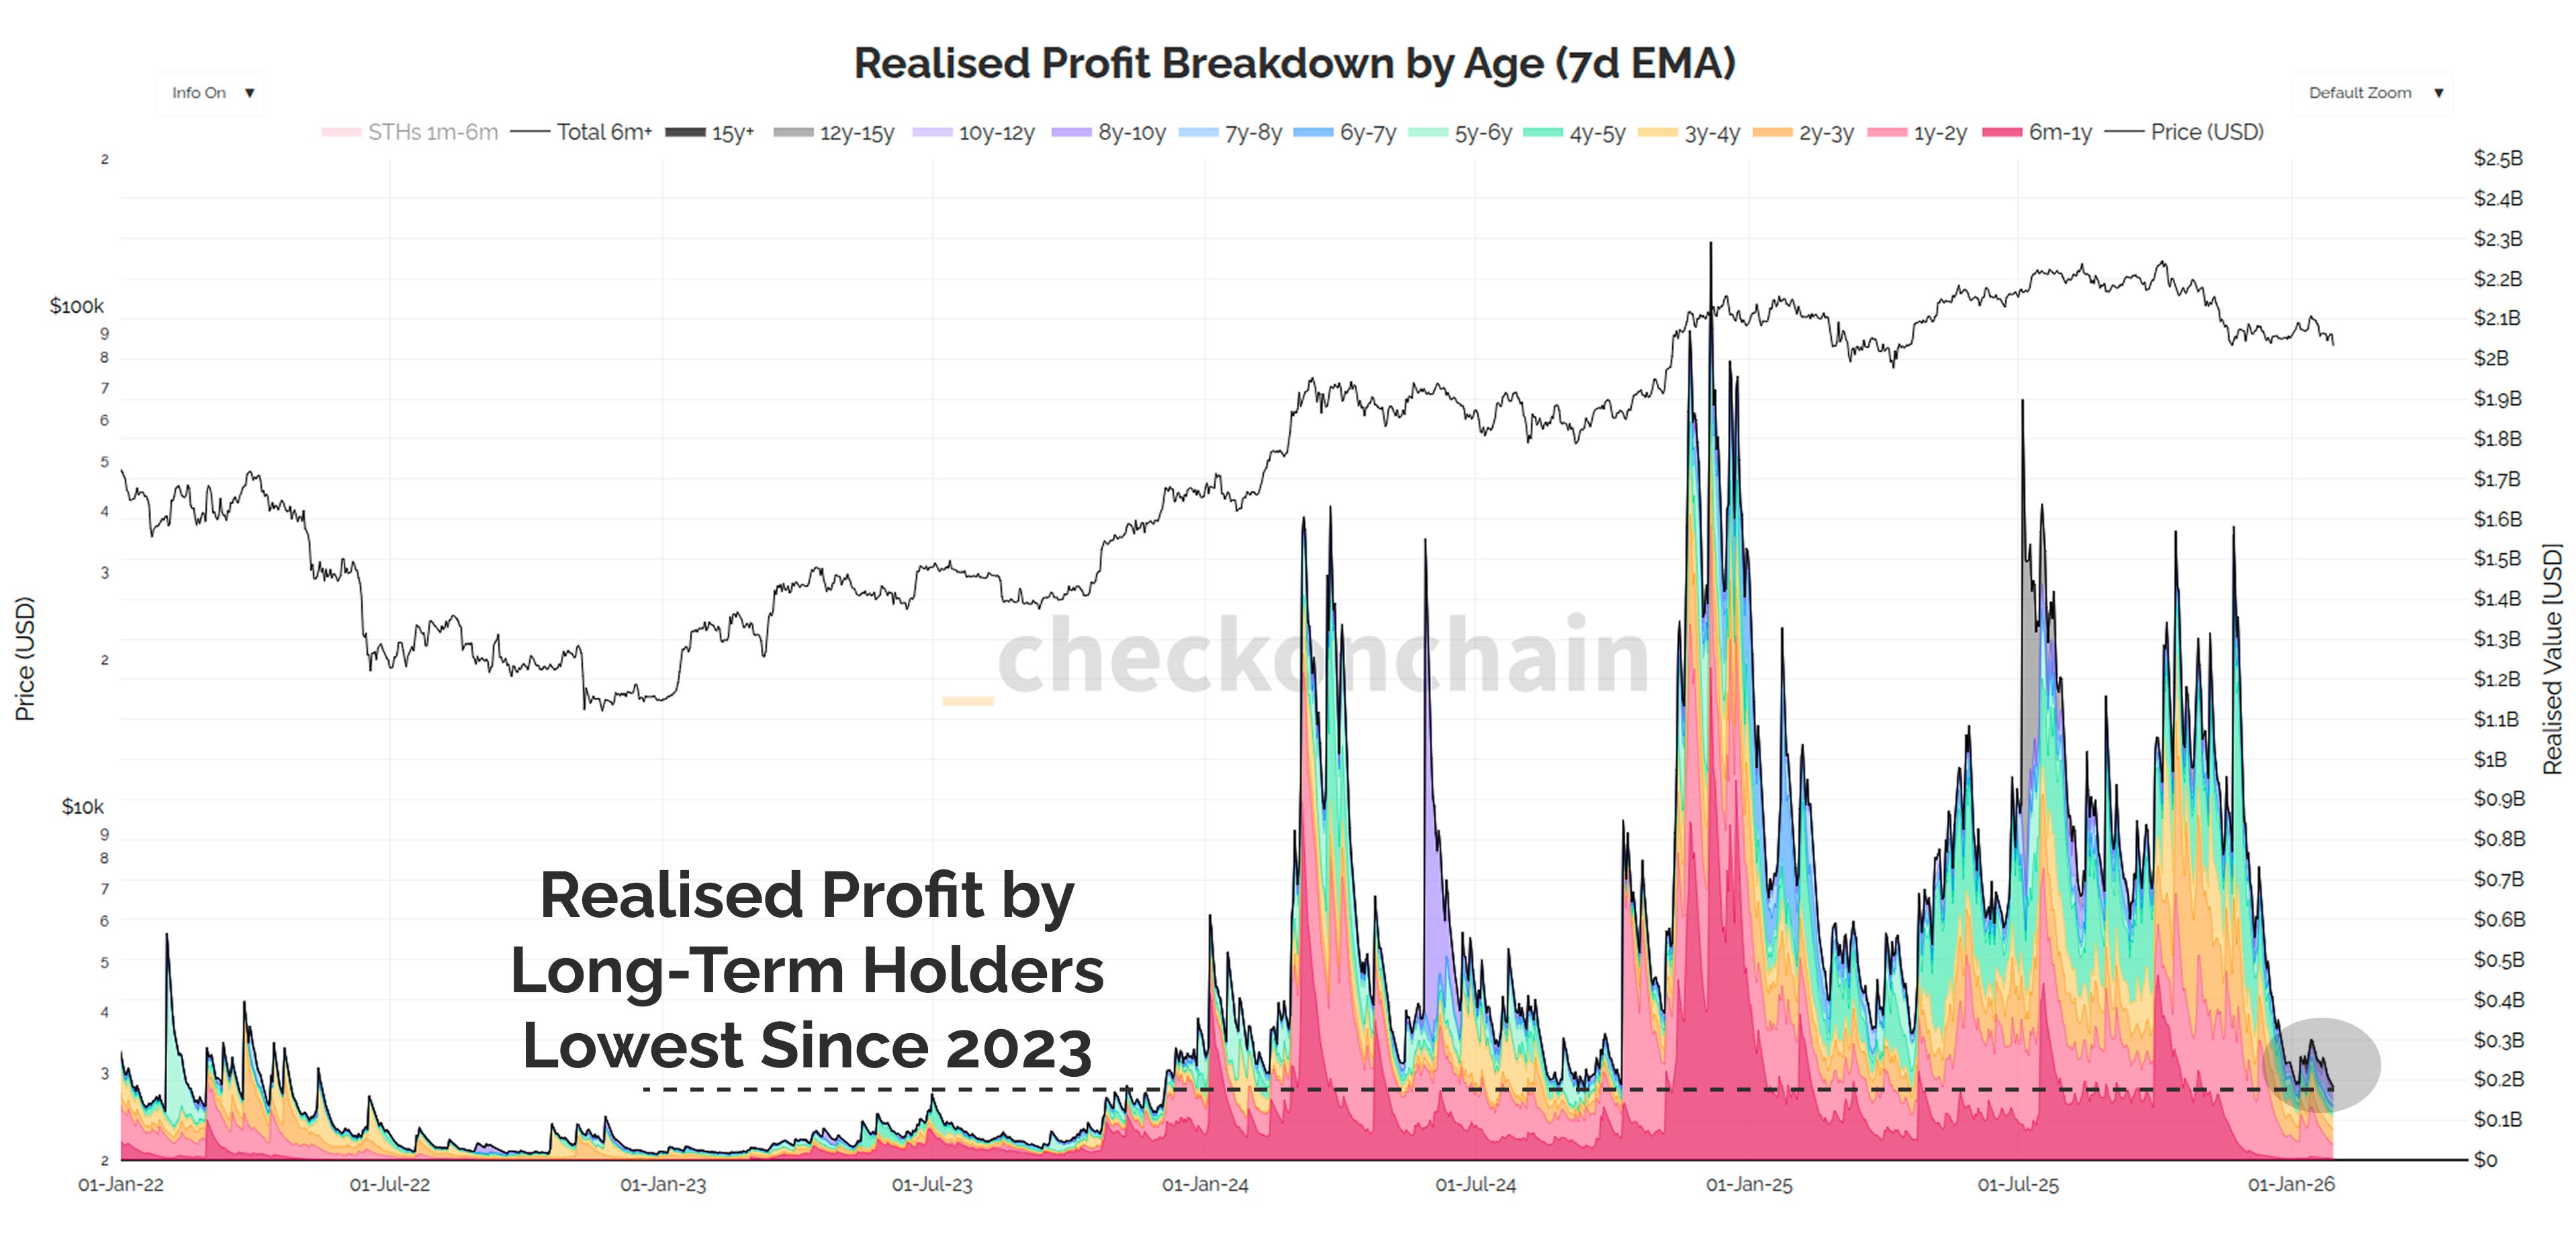
The chart below shows onchain Realised Profit by Long-Term Holders, and it has now fallen to the lowest level since 2023.
Profit taking headwinds have ended, and that means we’re now looking for signs of capitulation to put the bottom in.
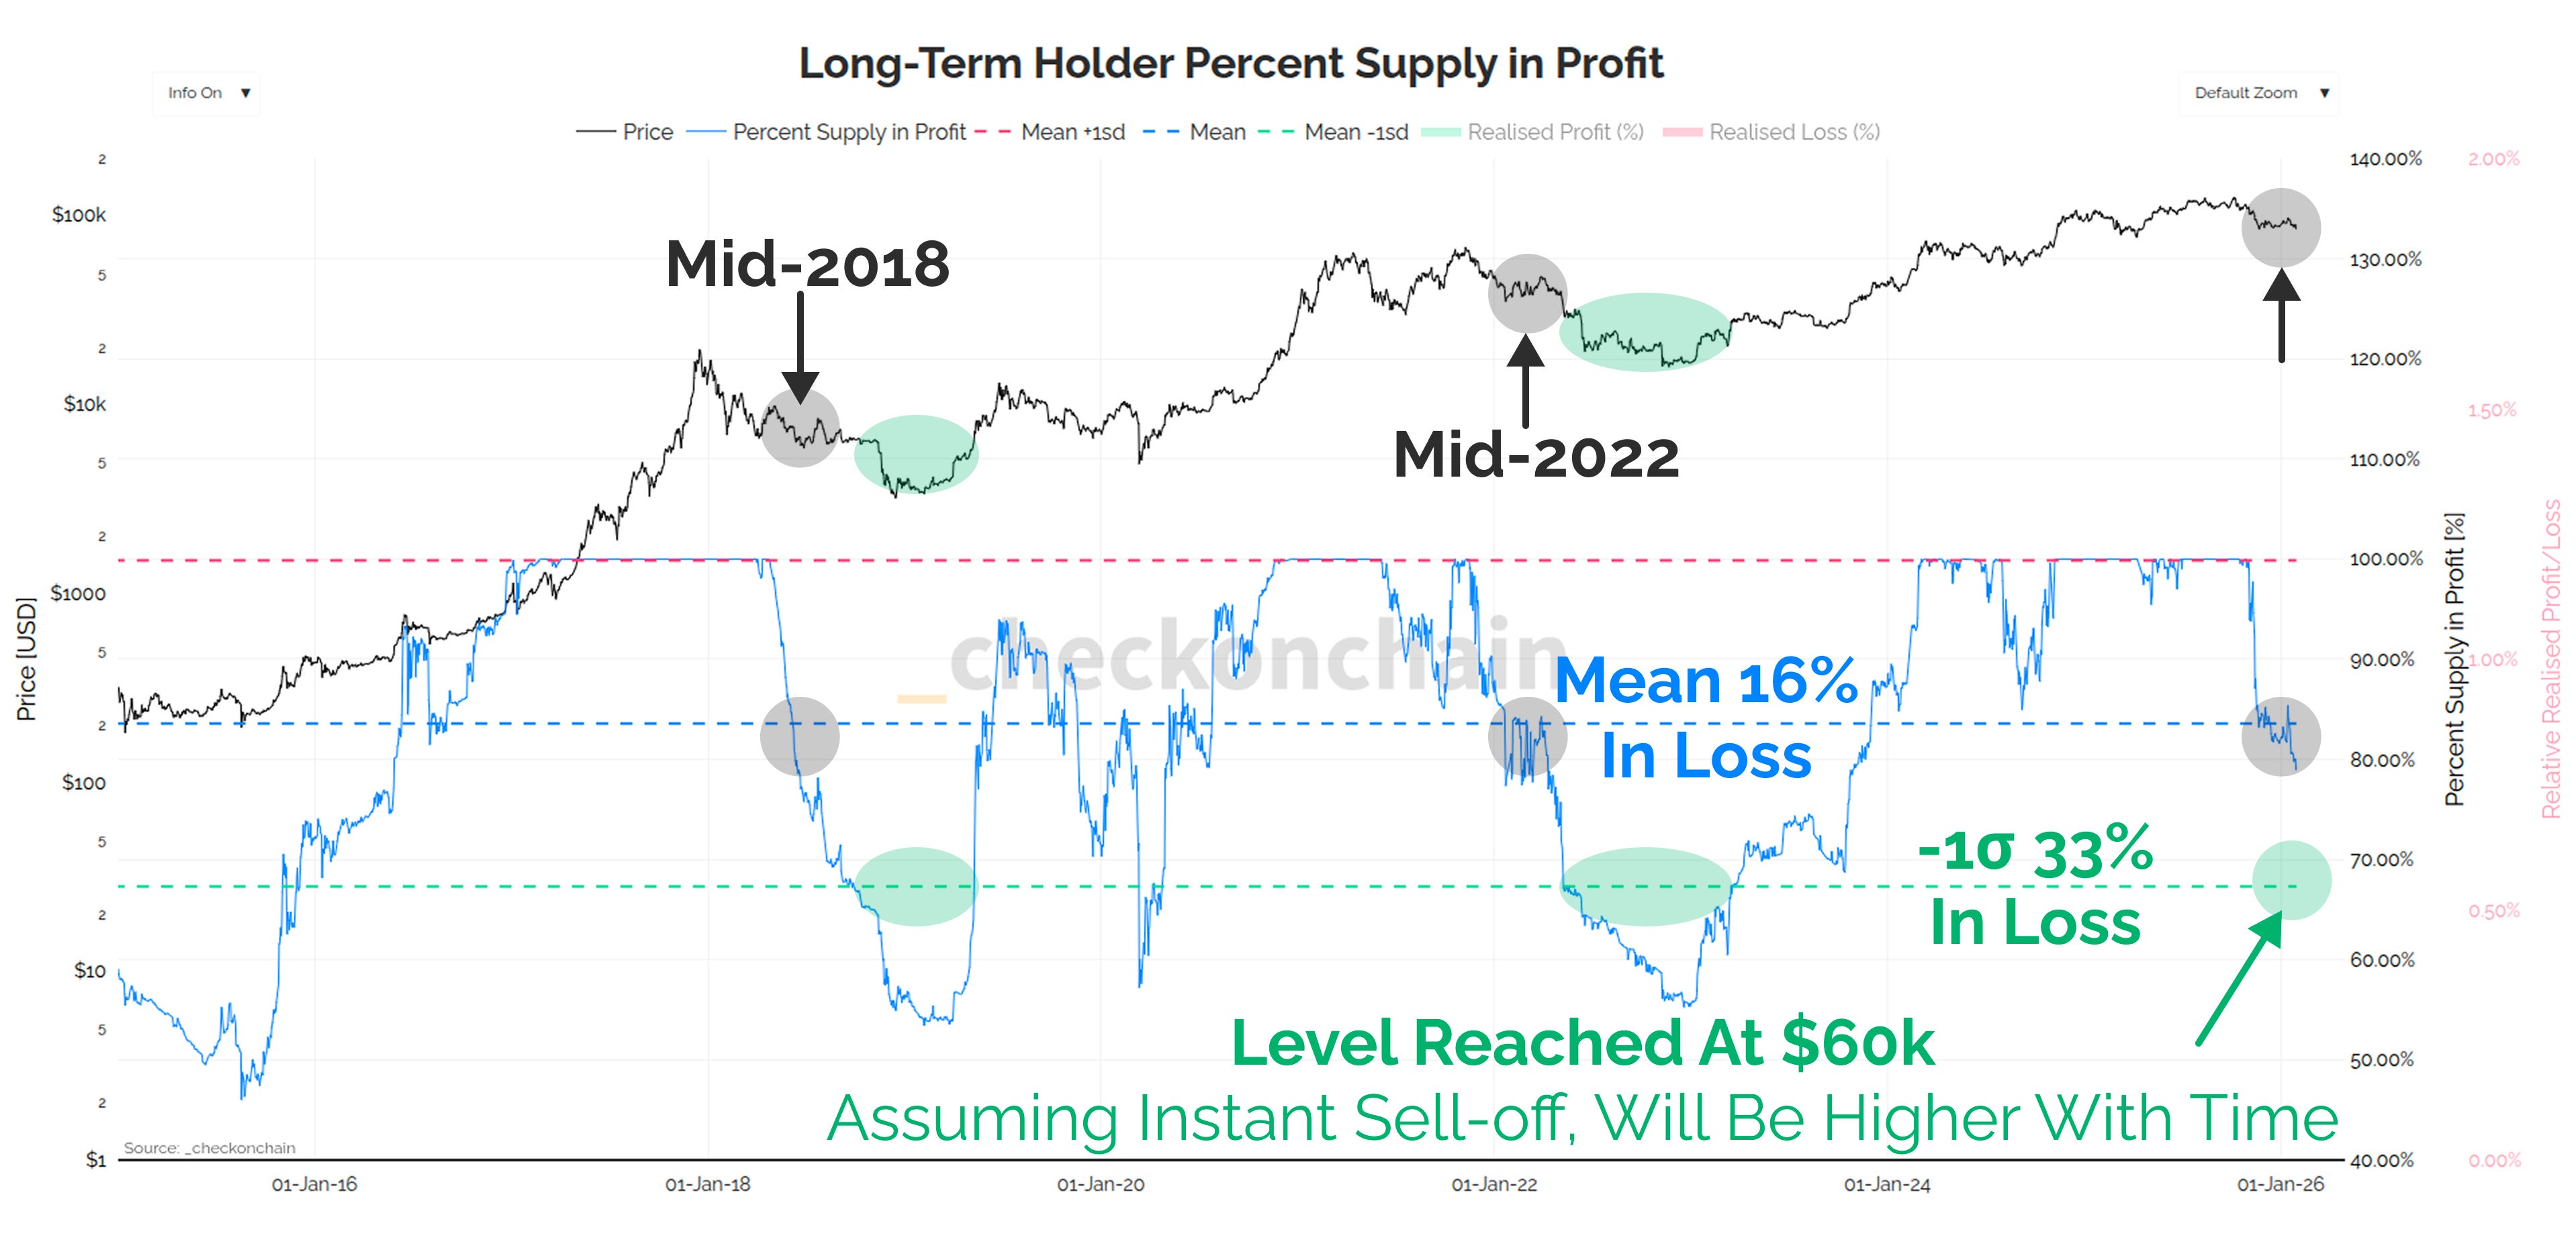
Of the 14.36M BTC held by Long-Term Holders, around 20% of them (3.0M BTC) are now held below their original cost basis (and thus in loss).
The long-term average for LTH supply in profit (blue) is 16%, and bear market floors tend to form when over a third of their supply is underwater.
Based on the current supply distribution, if the price was to fall vertically right now, it means the bottom would start to form around $60k.
Now this isn’t perfectly accurate, because if the price traded sideways for another 6-months, more and more coins from the $100k+ zone would enter LTH status, driving this metric lower as well.
Take-away point is, bear market floor formation is likely to occur somewhere in the 2024 chopsolidation range based on just about every metric I have in my toolbelt.
Bear market bottoms form when everyone has given up hope.
What is a very reliable signal, is they all tend to give up hope on the same day, usually after a nasty red price candle.
Just like we track bull market peaks using realised profit, we monitor bear market floors using realised loss. There is a key difference between the two:
Bull market tops are a process: it takes months and months of persistent sell-side pressure to over-saturate demand. It goes on a lot longer than people expect.
Bear market bottoms are an event: there is usually some headline, or some bearish development that causes everyone to throw in the towel at the same time. All hope is gone, and folks write off Bitcoin as a dead asset, never to recover…
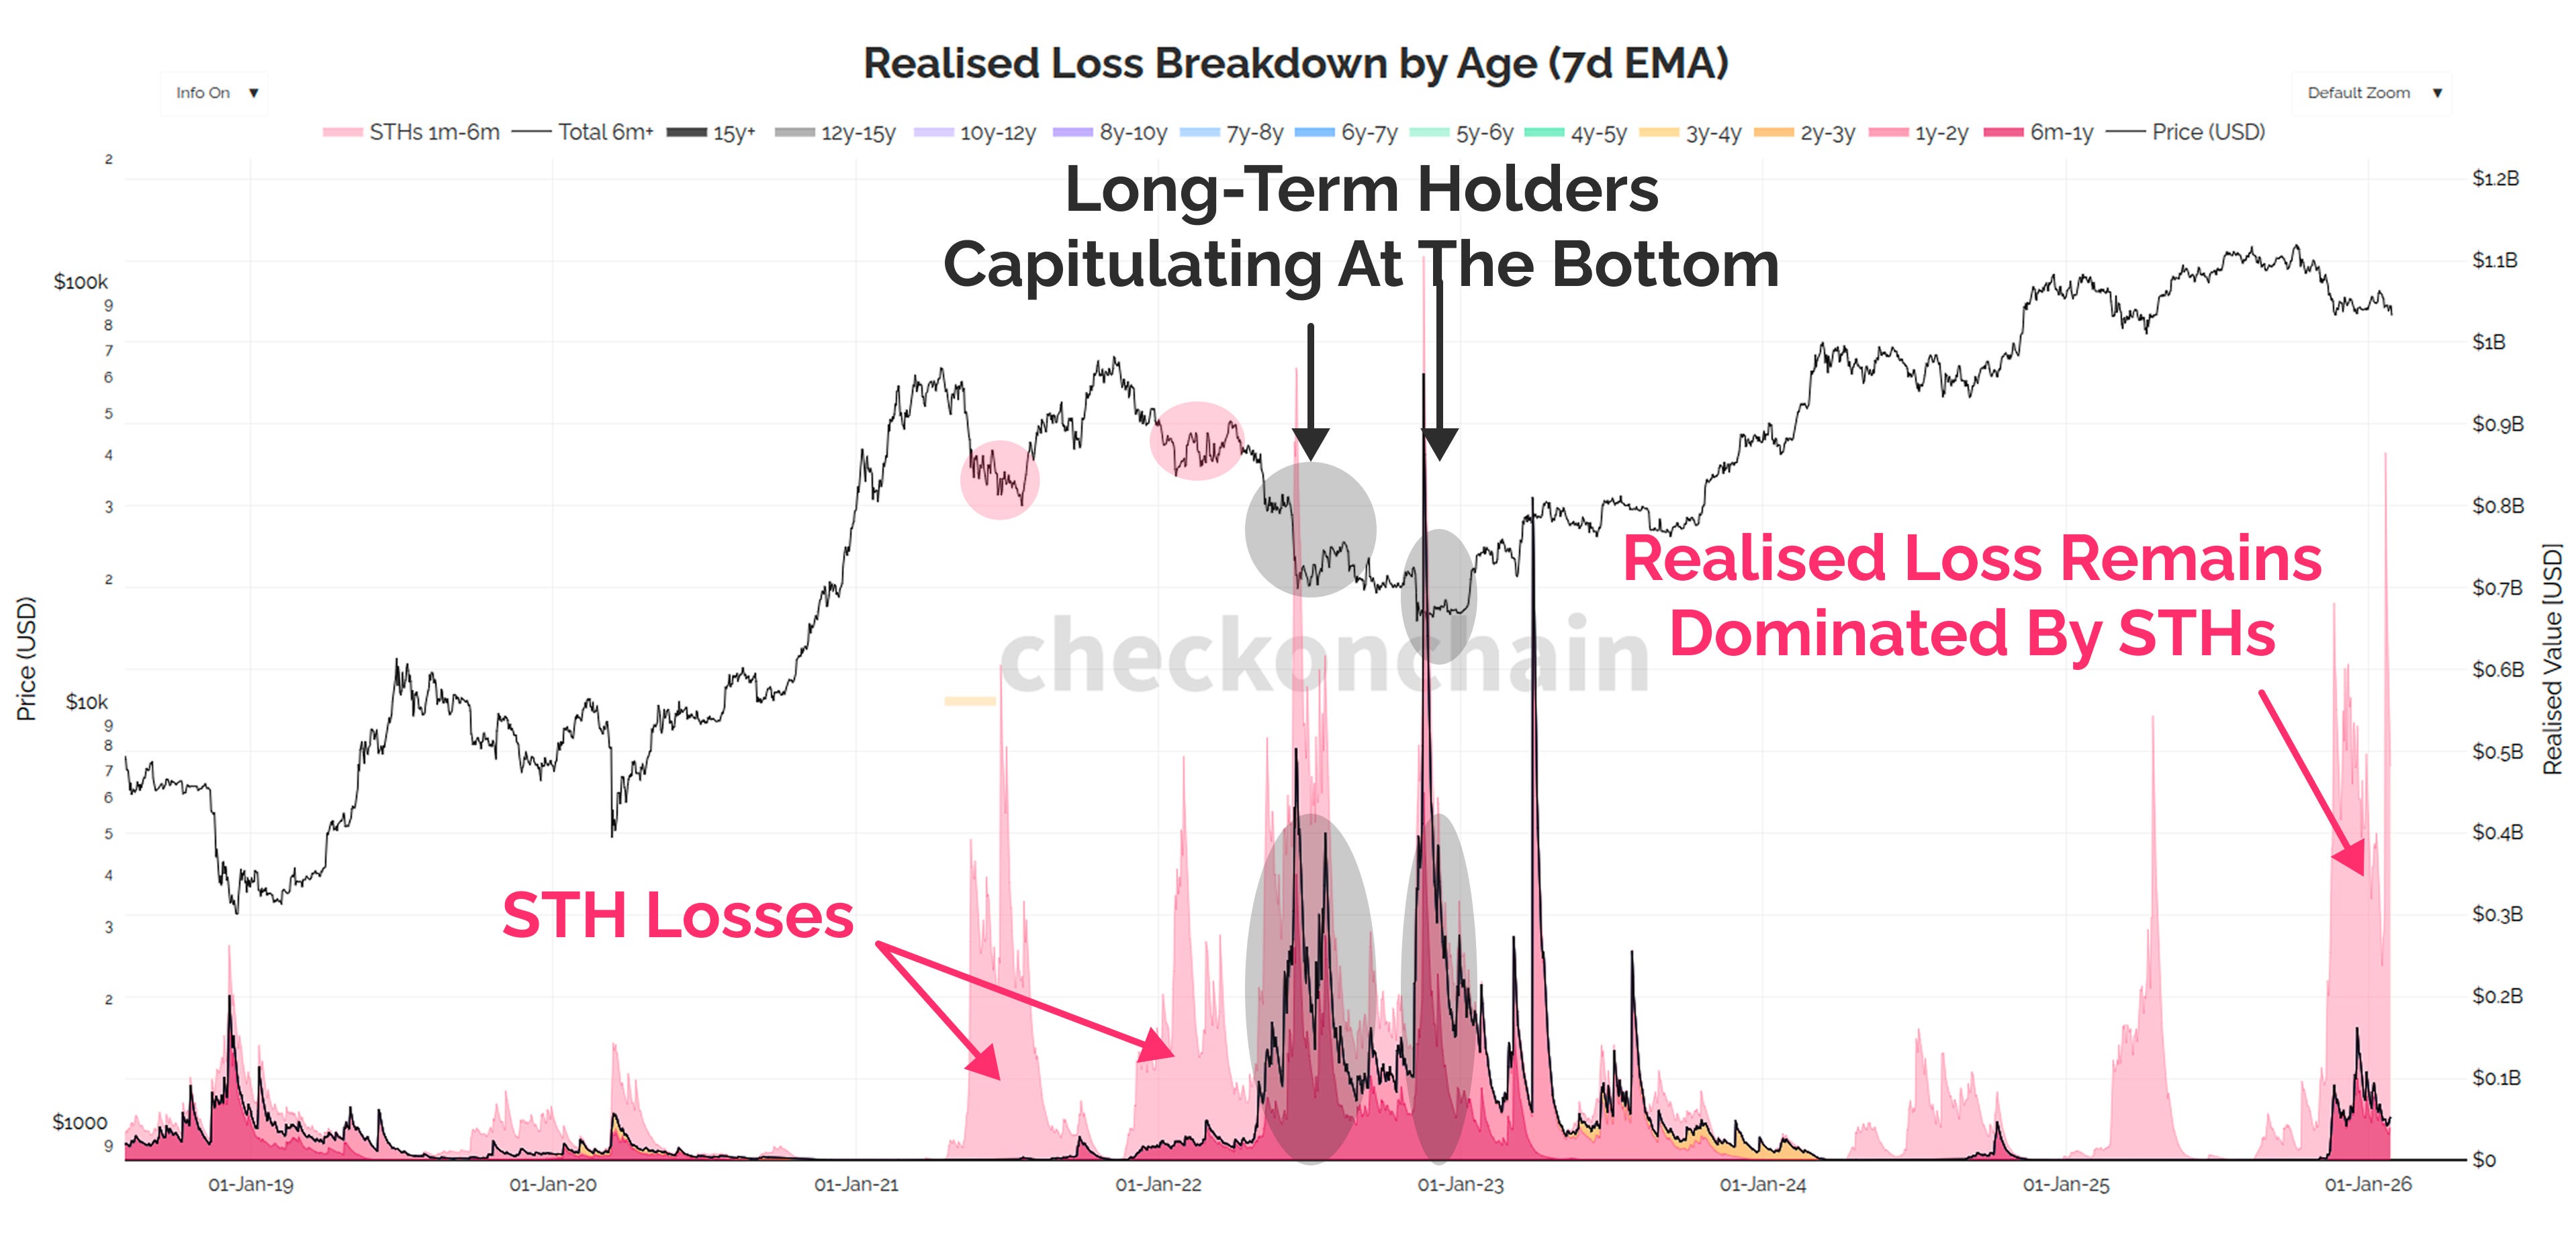
True capitulation events see not only Short-Term Holders, but also Long-Term Holders capitulating massive losses.
Those Long-Term Holders from the top often HODL the whole way down, through the bear, and then give up at the exact moment they should be doubling down.
As it stands today, most losses are dominated by Short-Term Holders (light red), and we have fairly minor contribution from Long-Term Holders (dark red).
Speculator Snapshot
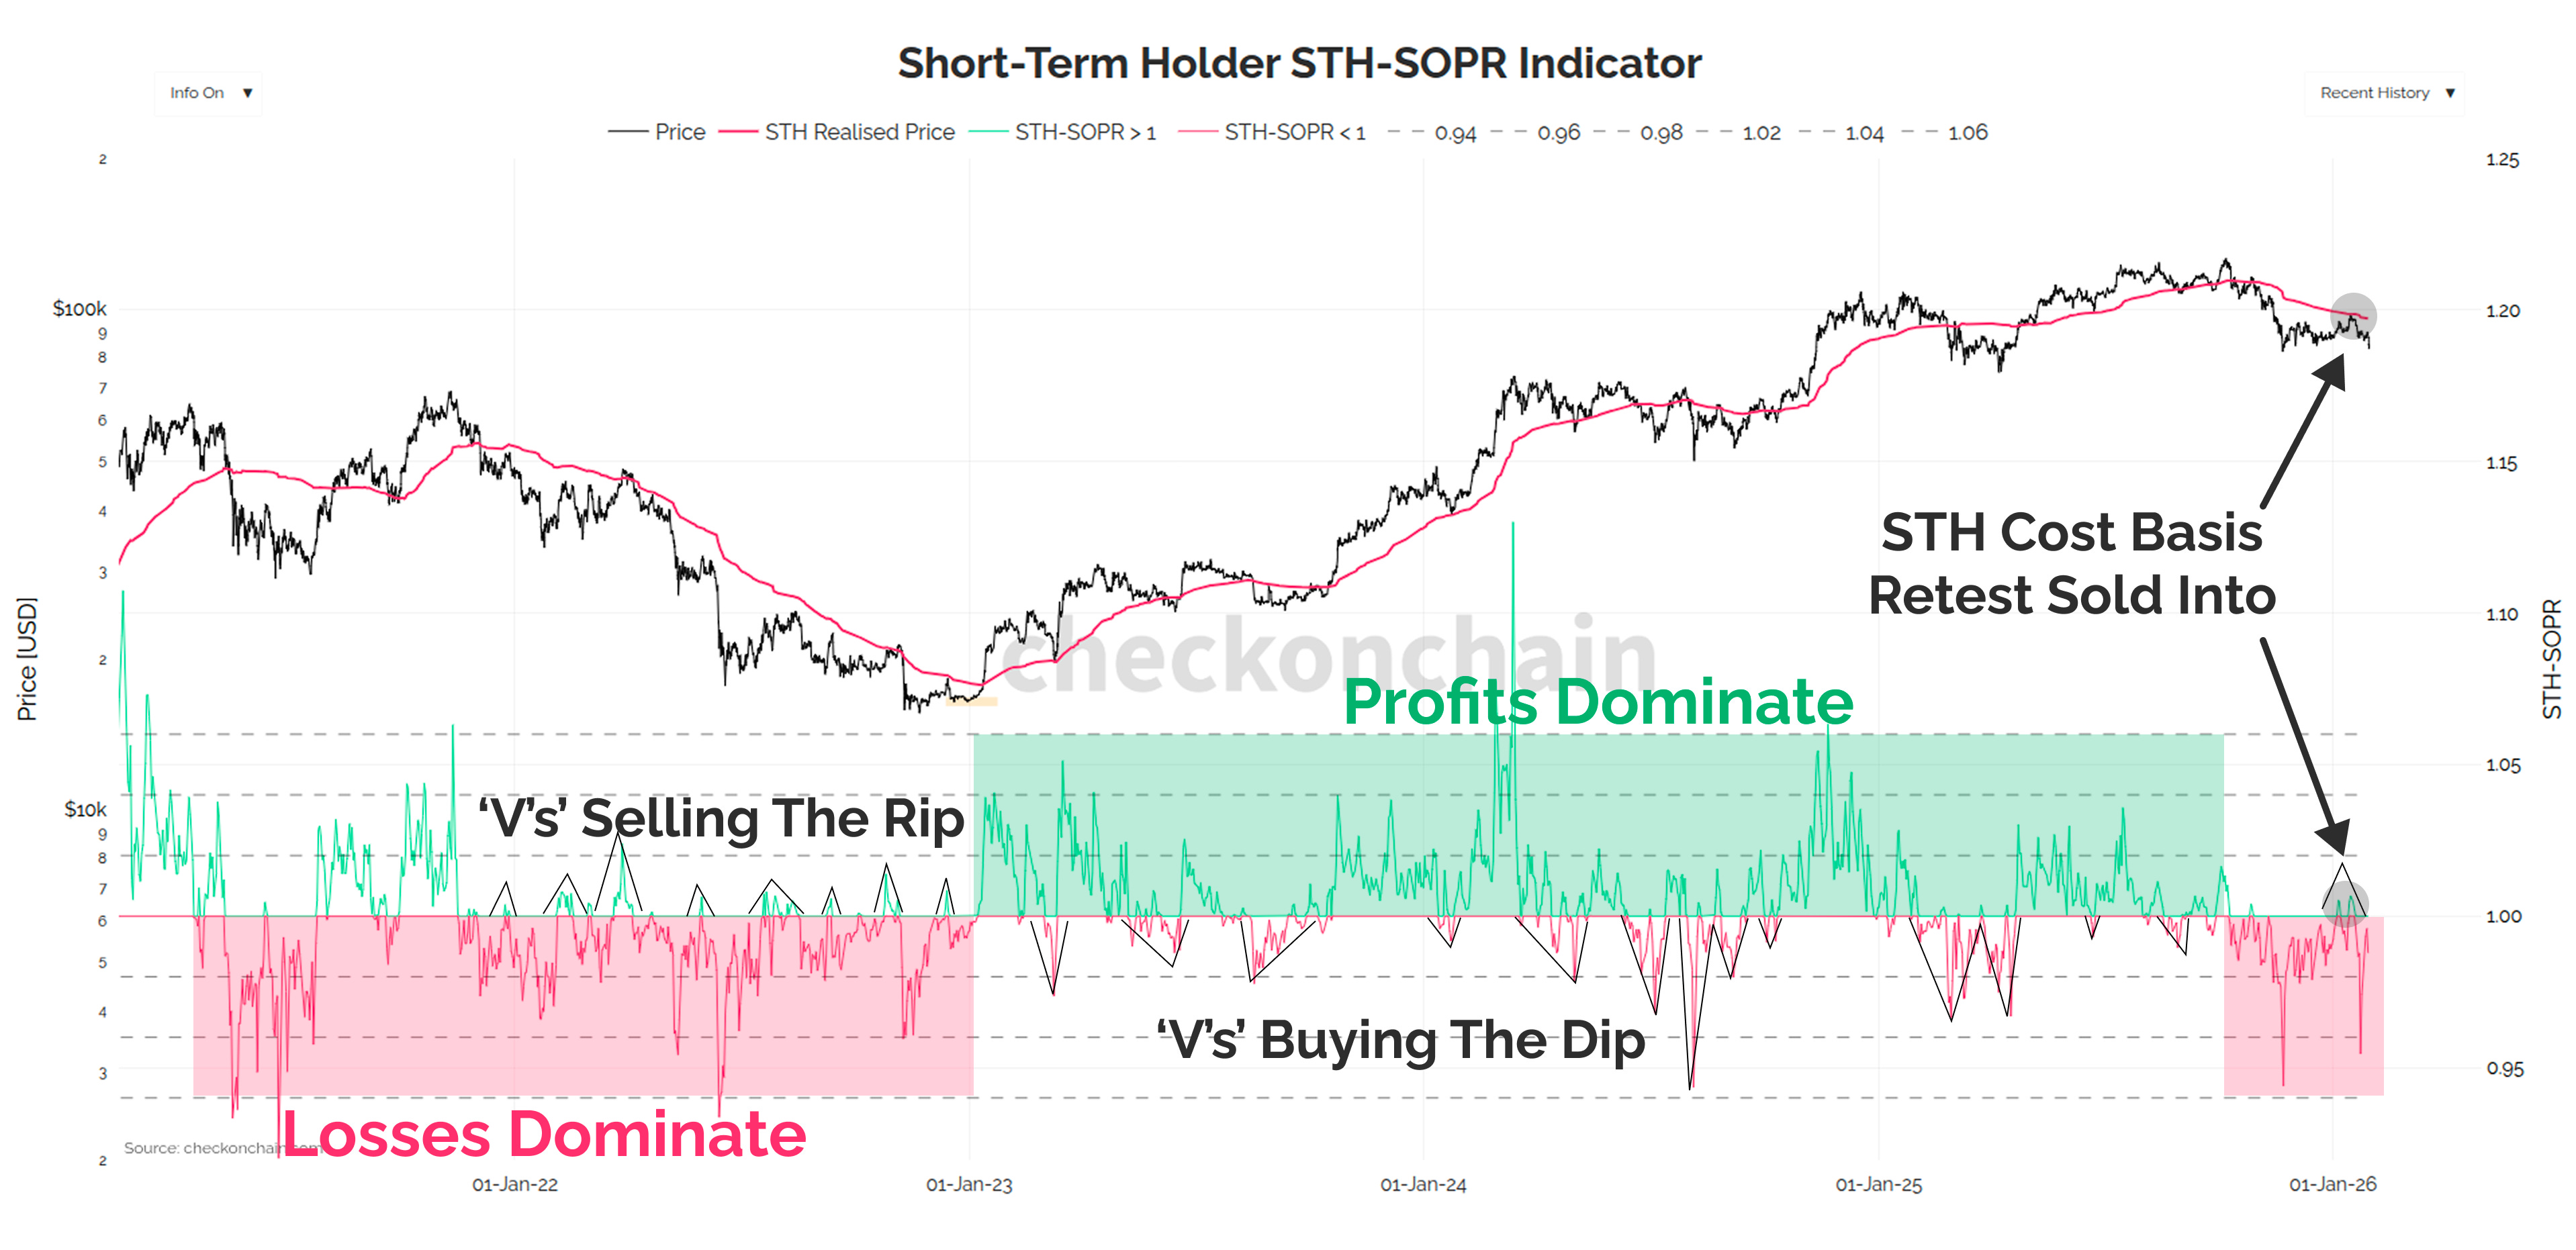
From an onchain perspective, the failed retest of the STH cost basis at $98k earlier in January, also signalled a bear market reversal in STH-SOPR.
We have moved from a regime of investors ‘buying-the-dip’ to one of ‘selling-the-rip’.
STH-SOPR is trading below 1.0 in loss territory most of the time, and every profitable bounce is being sold into, creating short, sharp ‘Vs’ above 1.0.
The first signal we get that the bear market has been slain will be a clean break above the STH cost basis, and a bullish structure reversal of STH-SOPR. Until then, be patient, and wait for opportunities.
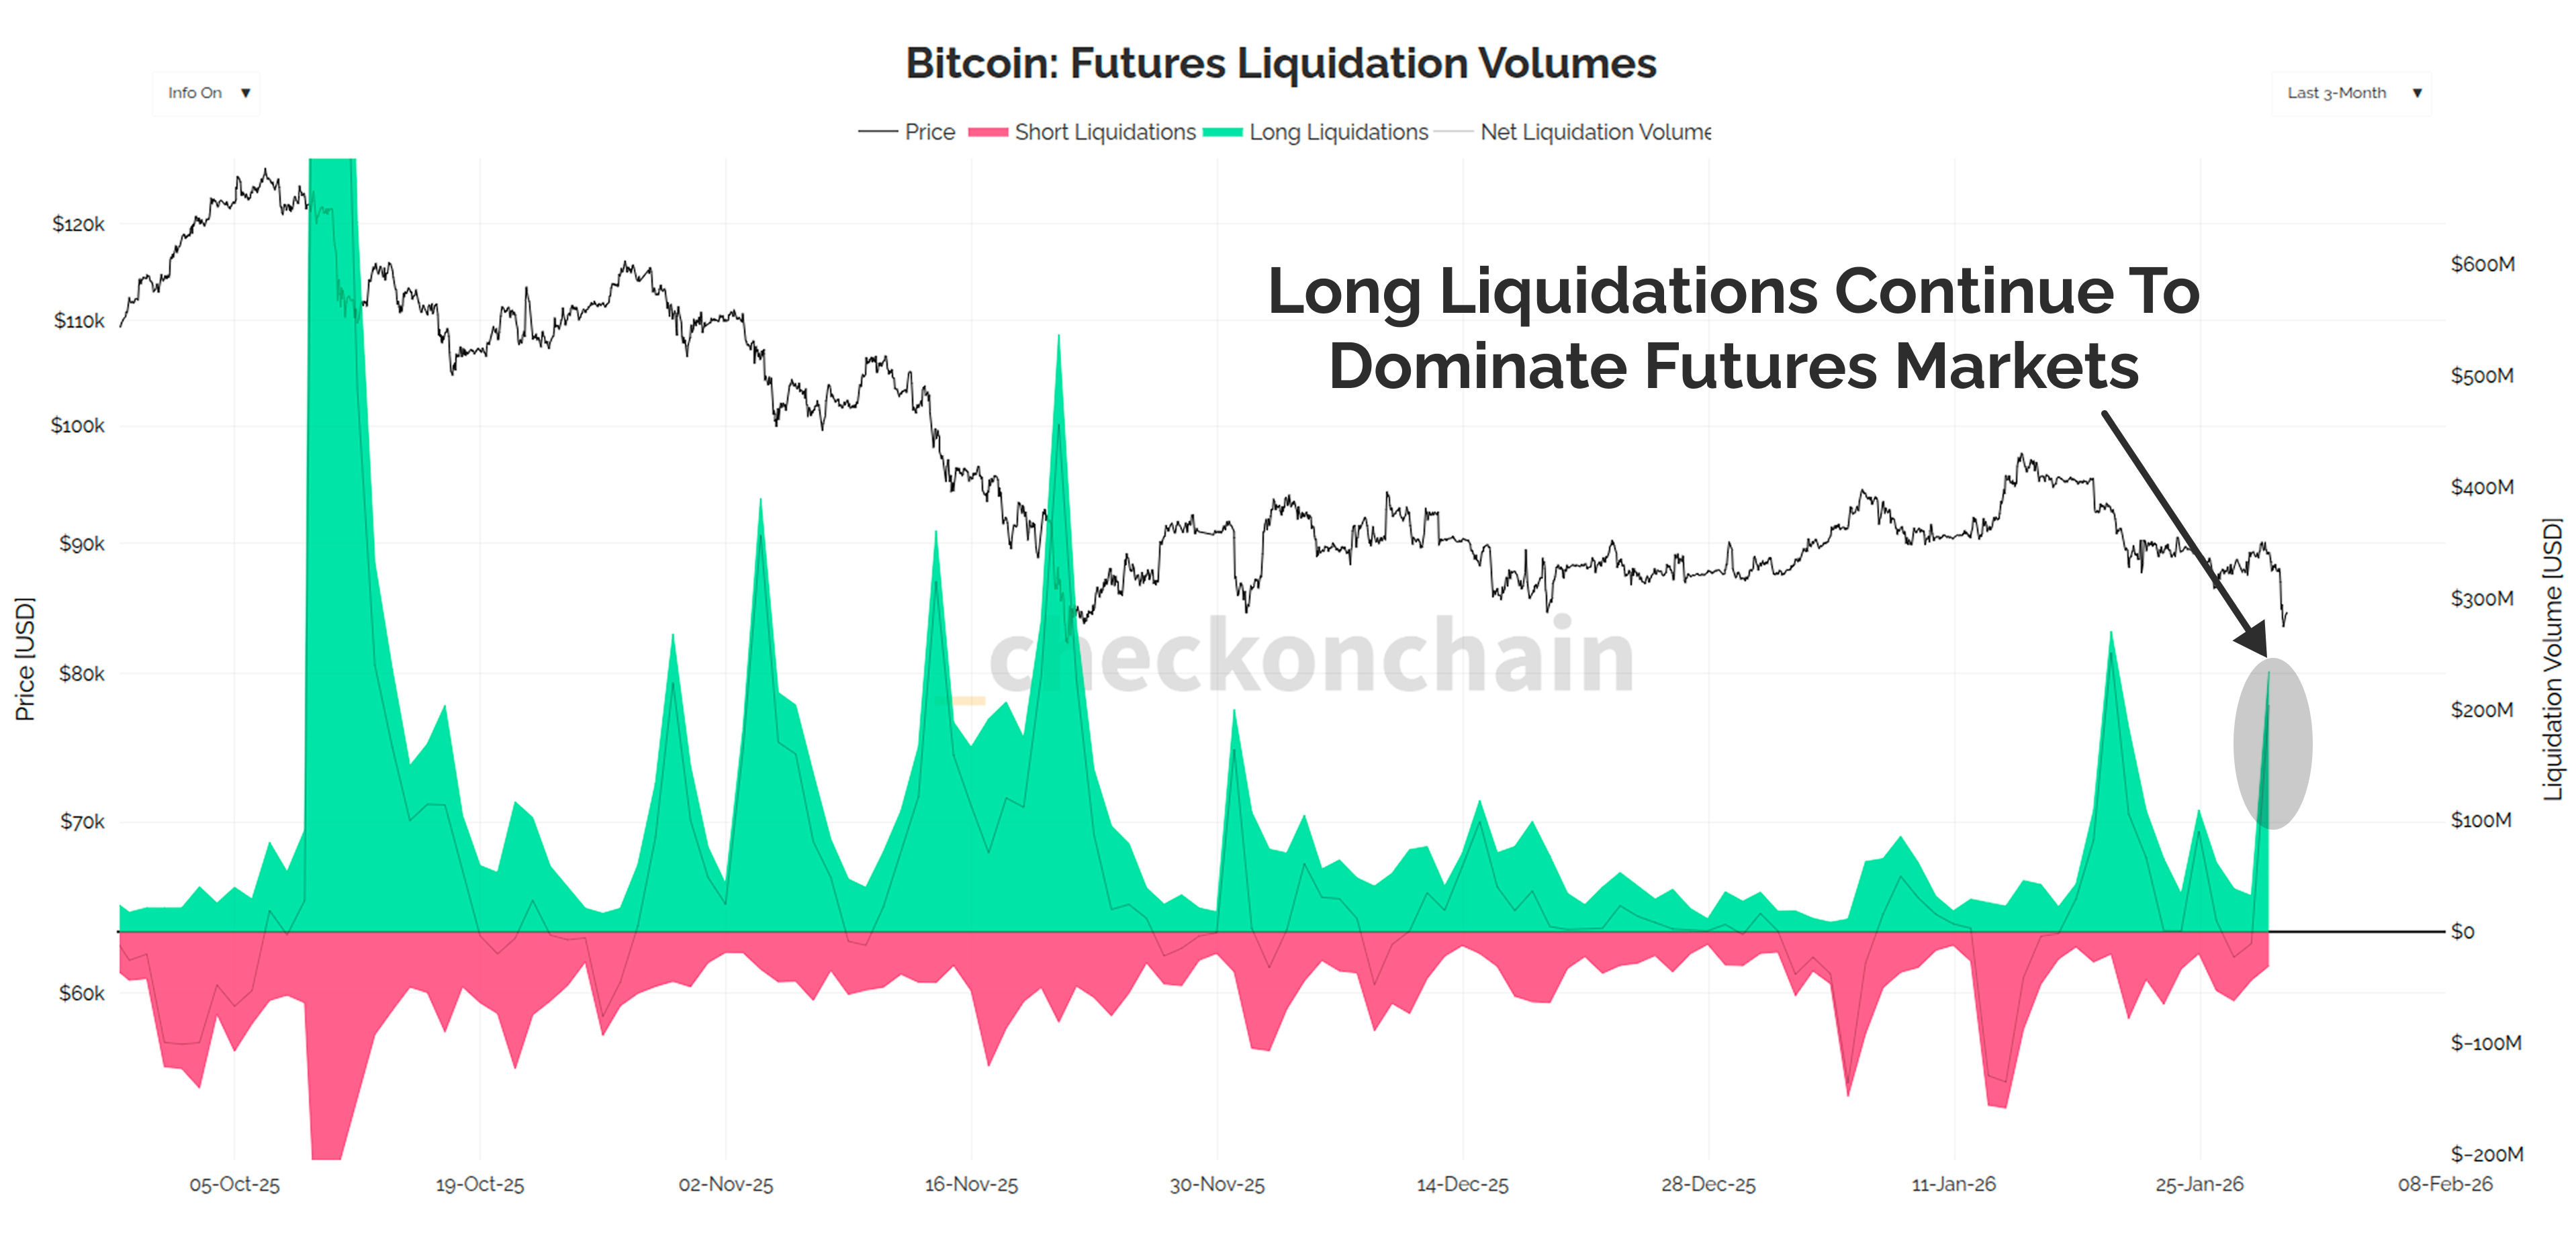
As I noted in recent reports, the leveraged futures traders have been leaning on the long-side, and their liquidation profile confirms that they now have smaller accounts.
Until the leveraged degens find their bear market confidence, and short the bottom, they will continue to add wood to their own flaming portfolio.
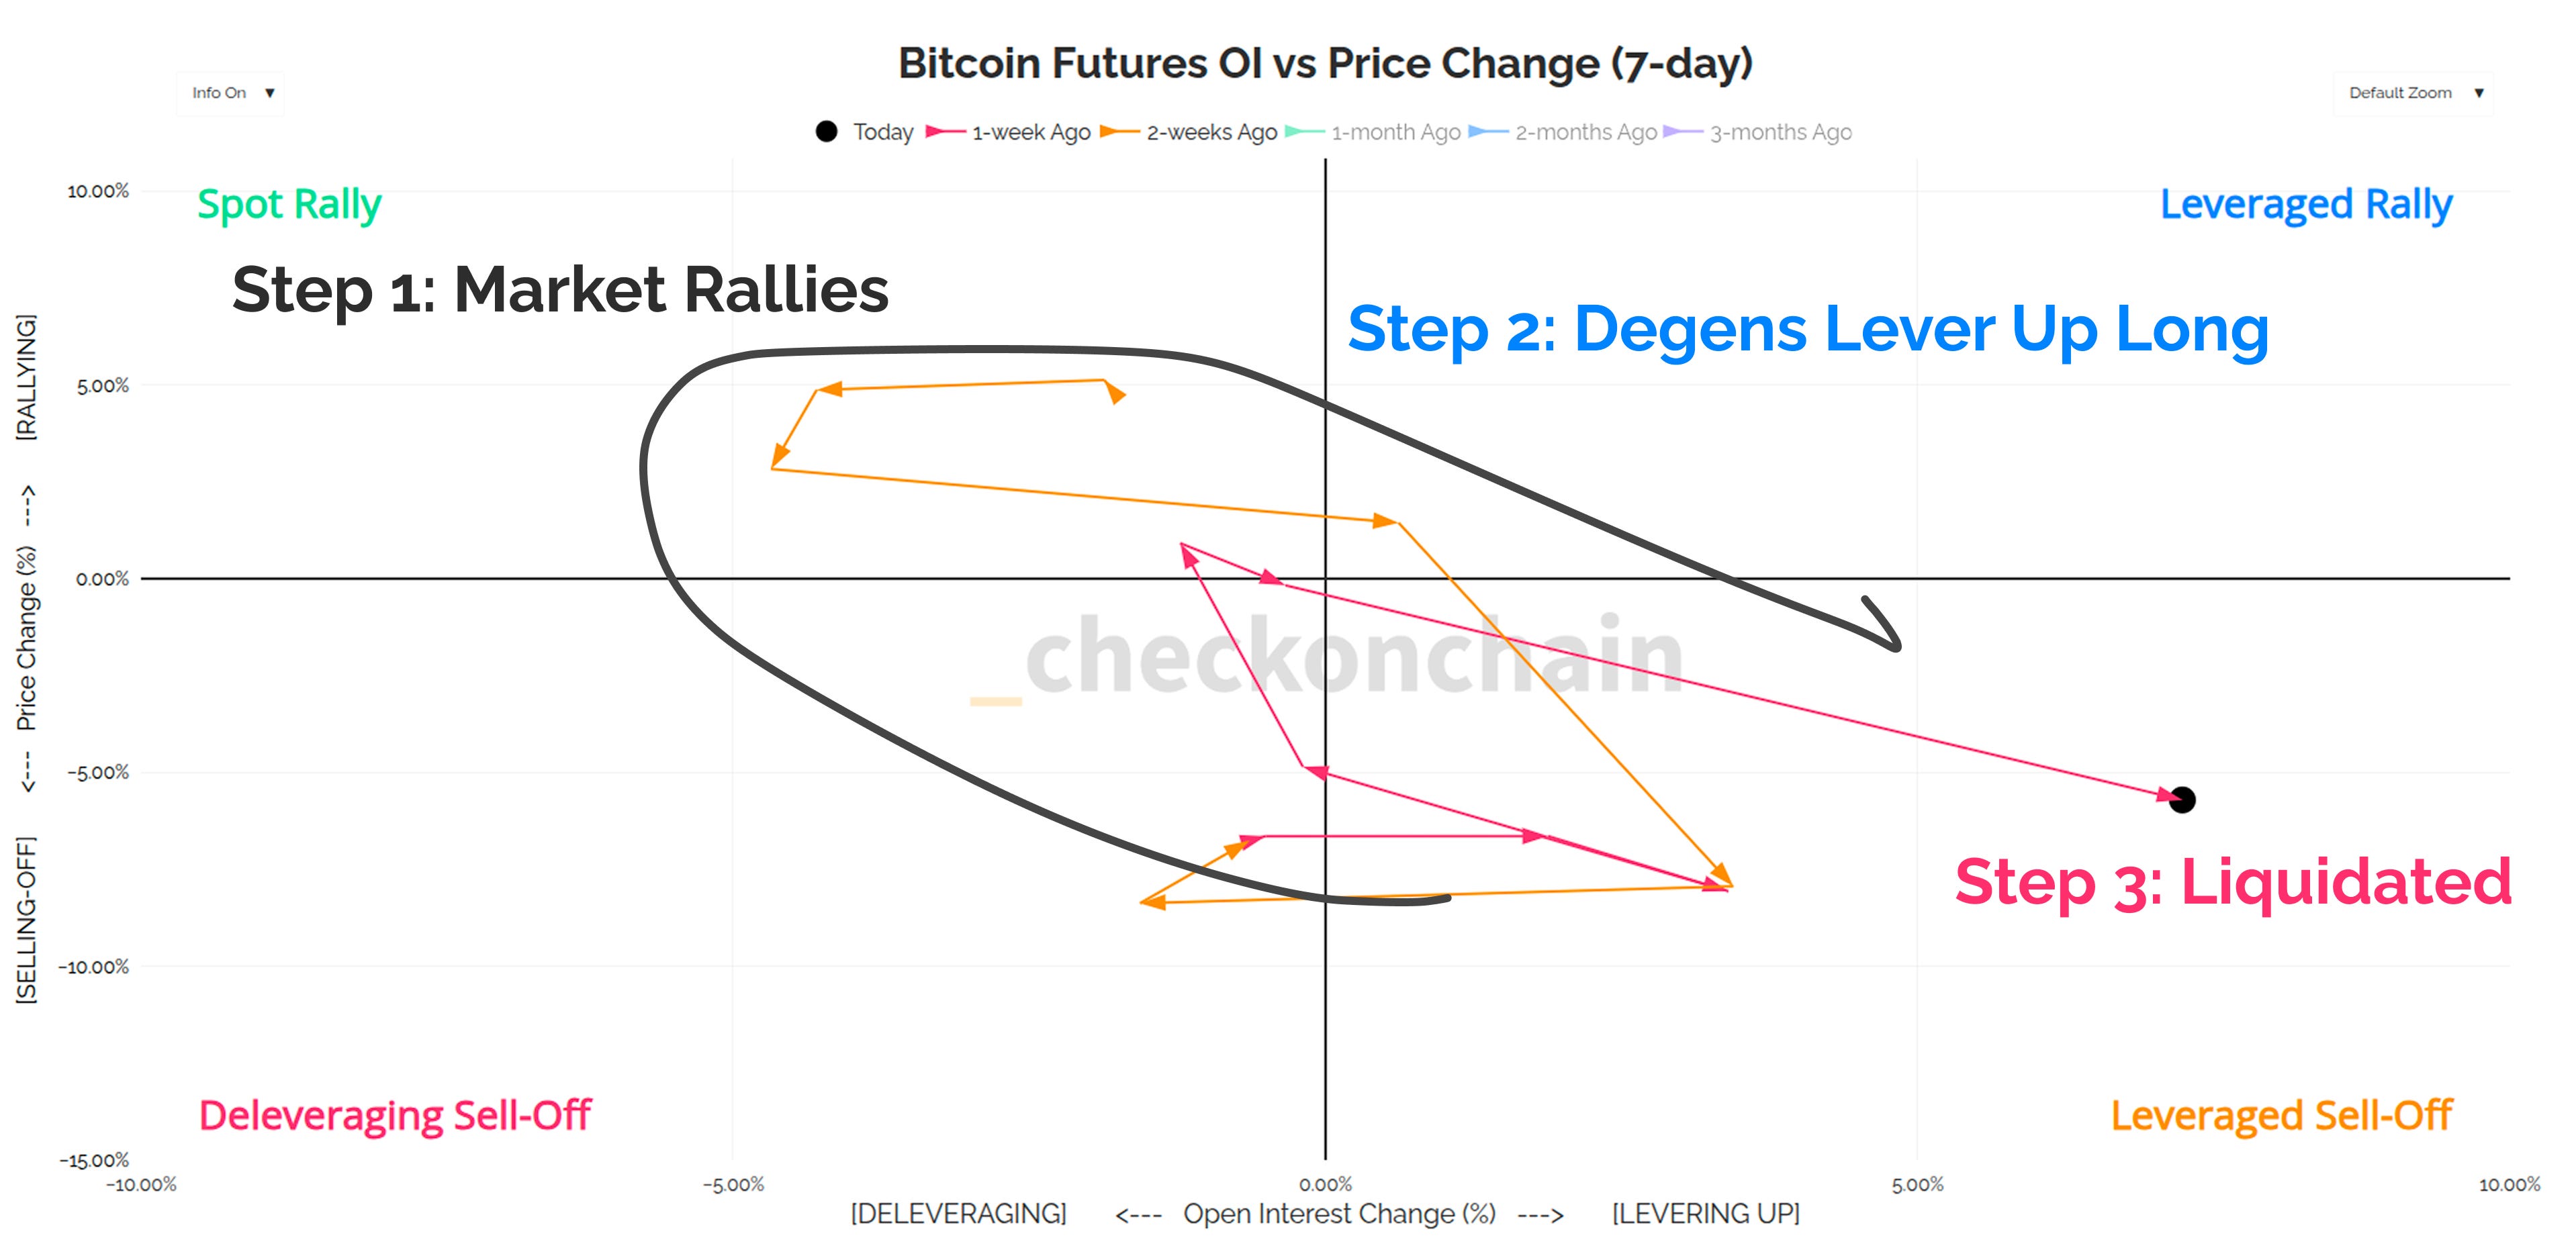
The chart below shows how futures open interest (X-axis) has responded to price performance (Y-axis) over the last two weeks.
Step 1: the market rallies on declining open interest (healthy).
Step 2: degenerate traders lever up on the long-side (not healthy).
Step 3: Account gets liquidated (healthy, but sucks for the rest of us).
This pattern will eventually reverse, once they have the confidence to short it in max size…right at the bottom.
Not there yet.
Pricing The Floor
Note: If you missed Monday’s report titled Where Is The Bottom Of This Bear?, I would encourage a read/watch of that one first to fully understand the charts below.
Ok, so the overall market setup we have in play is as follows:
We’re in a bear market, and look to be breaking down from a bear flag that has formed since November.
The air-pocket down to $70k looks ripe to be back-filled, and we will see how the market responds to that (base case is chopping around to find equilibrium).
We don’t have enough evidence of a major capitulation yet, but also, we probably are not too far away from it in price terms (somewhere in the 2024 chopsolidation zone).
Back in August, I published Wen Top?, which was a masterclass module explaining how to think about the Topping Cloud price model, and the probabilities baked into it.
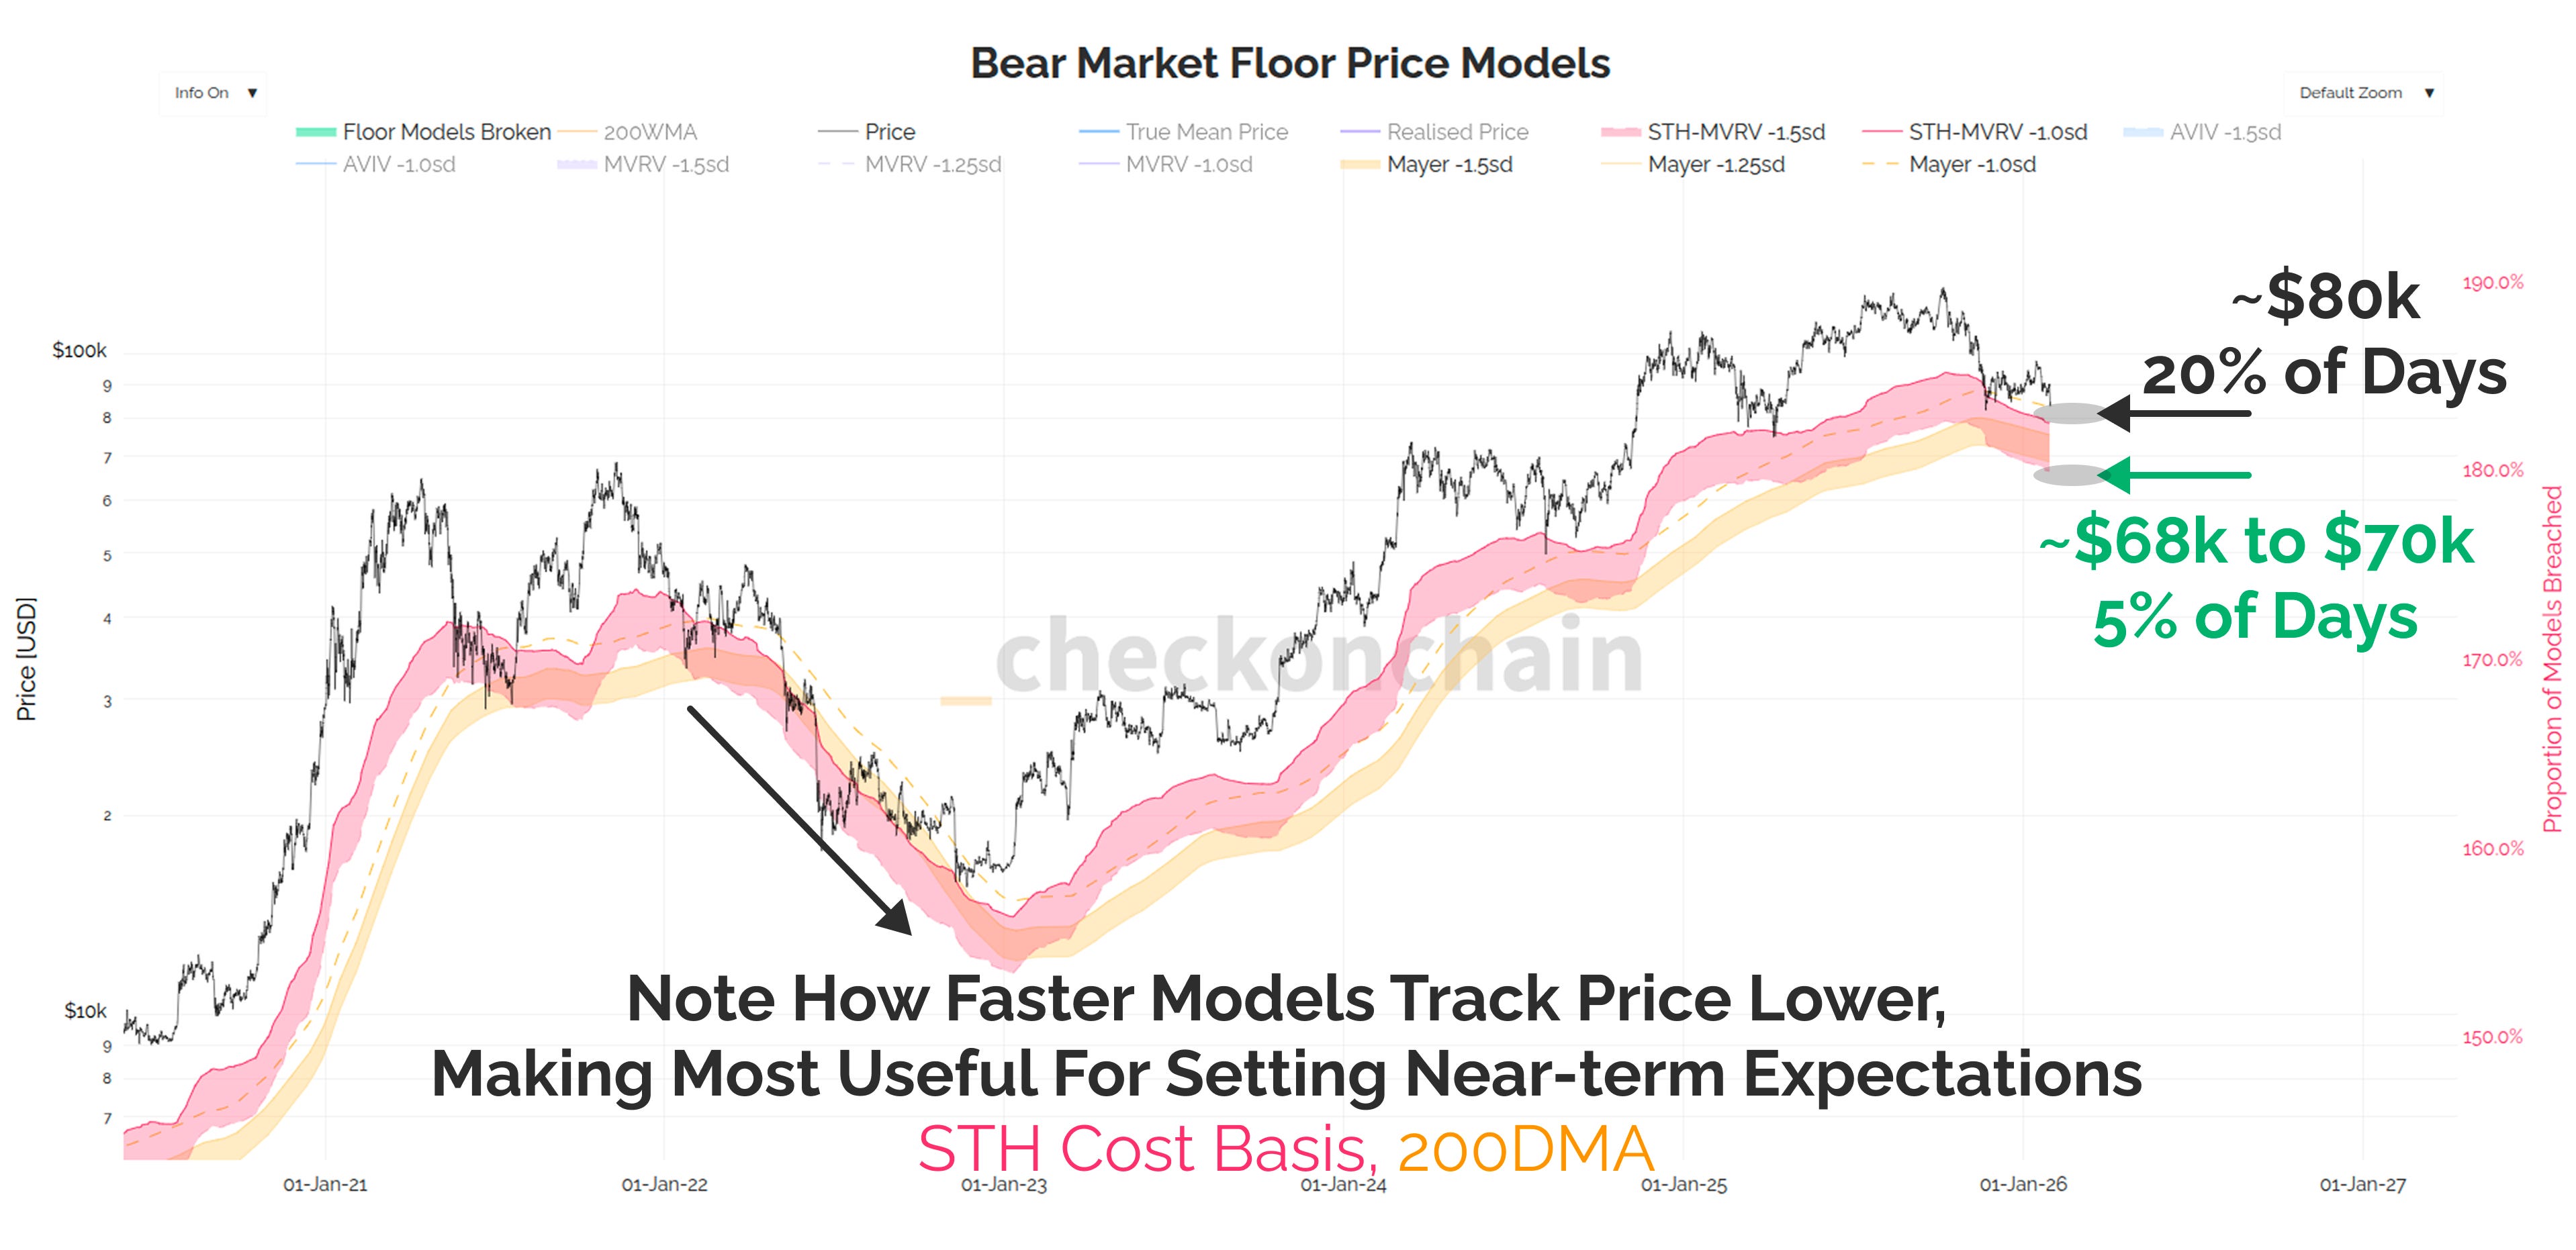
The chart below is the reverse of that, which takes all of the probabilities we assessed on Monday, and converts them into an aggregated cloud for bottom formation.
There are two groups of metrics:
Fast moving: being derived from STH-MVRV and the Mayer Multiple (price vs 200DMA). Think of these as models which price the likely floor with a few months look-ahead. They will follow price, but also act as a near-term rubber band for the price.
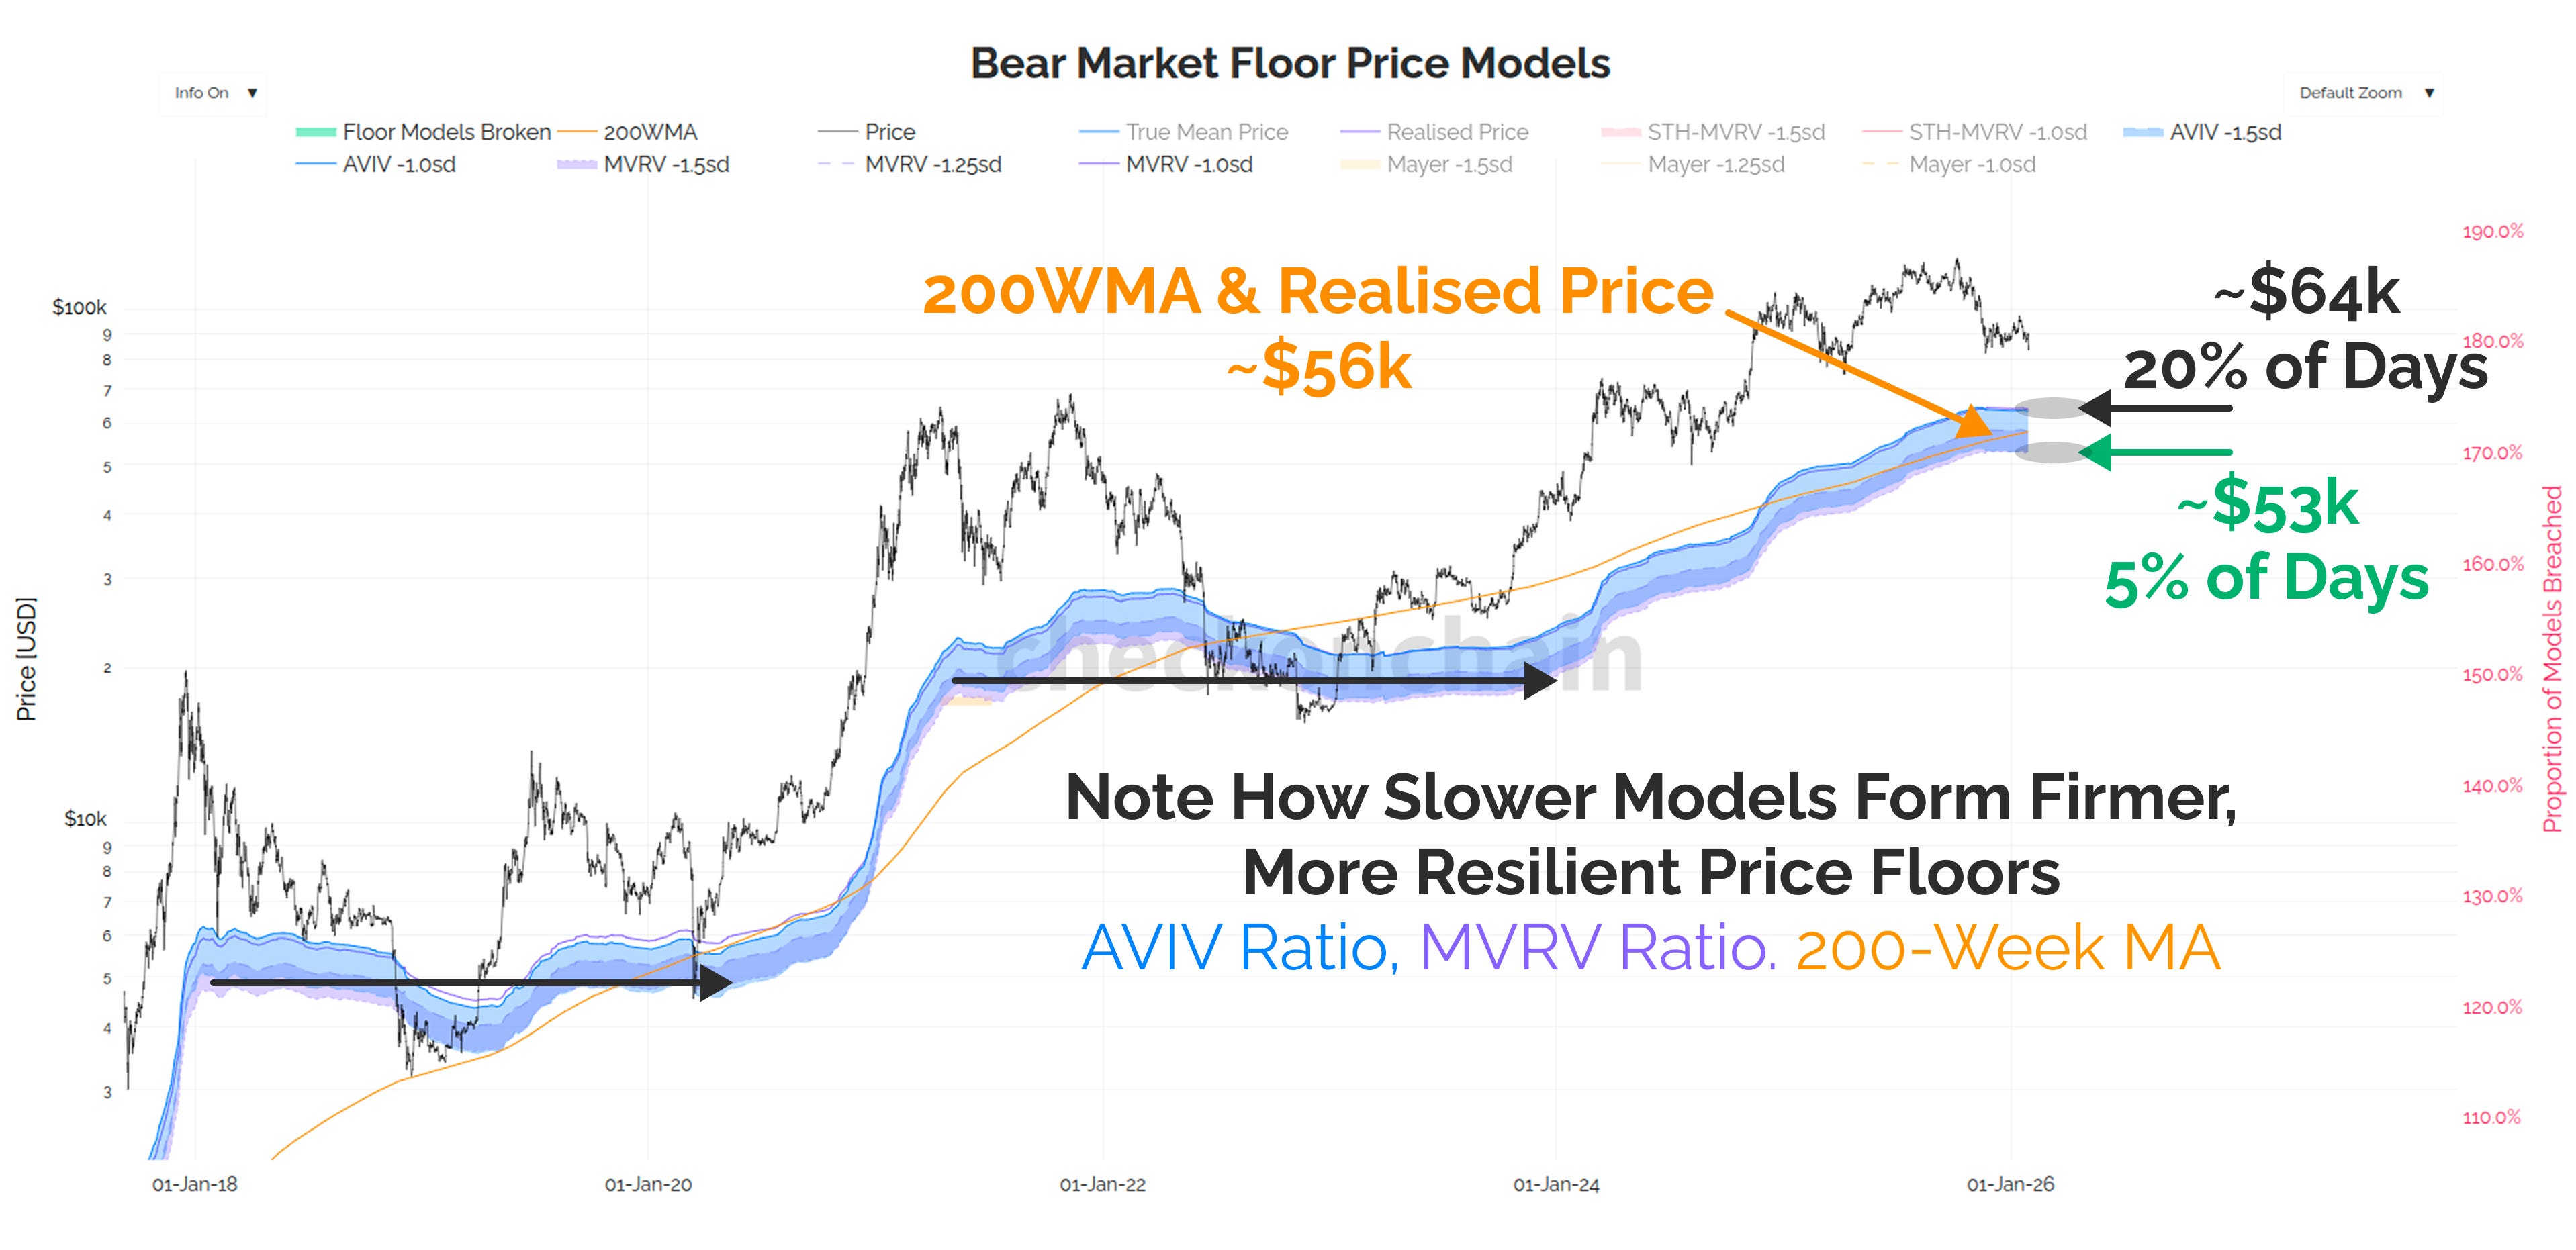
Slow moving: being derived from the MVRV, and AVIV Ratios. These models do not move around very much throughout the cycle, and are likely to stay in a similar place for several months at a time. These are more like a firm rubber mat below us.
The top-side of each model represents where only 20% of trading days have been below, and the lower band is 5% of days.
If we sell-off below $80k, in the immediate term, there is less than a 5% chance we move below $68k and stay there. It is more likely we sell-off, bounce, chop, and over time the STH cost basis and 200DMA will come down towards us.
From a longer-term perspective, the slower models suggest around 20% of days trade below $64k, and only 5% of days go below $53k.
In order to get to that 5% threshold, we would break below the Realised price, and the 200-Week MA, both of which are classic Bitcoin bear market floor levels.
This gives us a framework for thinking about what is likely, and where investor capitulation likely kicks in.
My base case is that we bottom within the 2024 chopsolidation range, and based on historical precedent, there is less than a 5% chance that we go under it’s lower bound of $53k. There is no such thing as zero probability outcomes, but I don’t design my base case off statistically improbable events.
I am of the view, that we enter the point of maximum opportunity below $70k, and if we reach those prices, Check the HODLer starts getting very hungry.
Concluding Thoughts
There are no guarantees in markets, and indeed in life.
The market is like the tide, and swimming against it only assures exhaustion, and getting dragged out to sea.
What is guaranteed, is that people will mass-capitulate on an asset all at the same time, at the exact moment they should be buying the opportunity.
That is because human emotions and markets are like oil and water. Our natural emotional hardware is perfectly design to avoid risk, and that causes us to:
Be extremely indecisive most of the time about good decisions (should I sell now…what if it goes up…but I just confirmed my bias over here…)
Be extremely impulsive about dumb decisions (I’m done with Bitcoin…this thing is dead, I should have bought gold…It will never recover…I may as well salvage what I can).
Do the opposite, and use onchain tools to track when others become impulsive.
Counter your own emotional hardware by observing when other people become impulsive. Watch for the moment when everyone capitulates at the same time, and do the opposite of the crowd.
Have a plan, write it down, and stick to it.
And whatever you do, don’t change the plan in the heat of battle, because that is your impulsive mind stepping back in, trying to make another dumb decision.
The point of maximum opportunity will come, the trick is to make sure you’re paying attention when it does.
Thanks for reading,
James
I’m very grateful for this deep research it really helps build confidence for what’s coming. There’s hope, even if rough times come. “Write it down; when it happens, stick to it.” Mark those words. Thank you, as always, for your incredible work.
As always, your insights give me confidence to stand on what brought me to bitcoin in the first place.
At this point, I'm vigorously hoping for low 70s. I have some capital to deploy!