Dip or Doom?
Bitcoin has sold off to retest the $60k level once again. In this dip or doom edition, we will check in to see if the strong hands are holding firm, and if the fast money are panic selling the lows.
G’day folks!
There is nothing quite like a Bitcoin dip heading into the halving to get you on the edge of your seat.
This post is titled Dip or Doom, and it will be a semi-regular but ad-hoc post format for checkonchain subscribers. The goal is for me to provide my raw unfiltered thoughts on what is happening right now, so you can get a peak inside my mind how I am thinking about flash sell-off events.
Note: This Dip or Doom edition will be available for both paid and free subscribers, however, all future editions will be exclusively for paid subscribers.
Disclaimer: This article is general in nature, and is for informational, and entertainment purposes only, and it shall not be relied upon for any investment or financial decisions.
📽️ Full Video Analysis
Watching Short-Term Holders
Bitcoin is currently threatening to break down below $60k, having tested the level twice in the last couple of days. As we highlighted in our post on Tuesday, the STH Cost Basis is currently trading at around the $58k-$59k region, and represents an important zone of interest, which we would hope to see hold as support.
Should we break below say $58k on a sustained basis, we do risk the market entering Top Heavy status, which **could** precede a more lengthy drawdown (but not necessarily).
Now, until proven otherwise, my personal bias is that the STH cost basis should act as support, at least in the first instance. During resilient up-trends, the Short-Term Holder cohort tend to buy coins at their cost basis, and tend to see it as a sort of ‘value zone’ (making it a dip).
What we need to watch out for is a bearish flip, where STH MVRV breaks below 1.0, and then finds resistance at that level. This could suggest a more bearish regime shift is underway (making it a doom).
This is much the same interpretation framework as STH-SOPR, which tracks the profit or loss locked in by the cohort. If we recall this chart from our first post, we can see the types of market structure we do and don’t want to see.
🟢 What We Want to See - SOPR and MVRV finding support around 1.0, with sharp undercuts and then recoveries actually being good signs, as it signifies a proper flush out of top buyers is occurring.
🔴 What We Don’t Want to See - SOPR and MVRV breaking below 1.0, and struggling to recover. If they start finding resistance at 1.0, that means STHs are selling their cost basis, taking panic exit liquidity.
Right now, we have a beautiful undercut of 1.0 by STH-SOPR, and I’d like to see this rebound over the next couple of days.
The Strong and the Lettuce
Glassnode has recently released some really powerful metrics which help us analyse onchain patterns at high resolution (1hr and 10min). What I am trying to solve for are two questions:
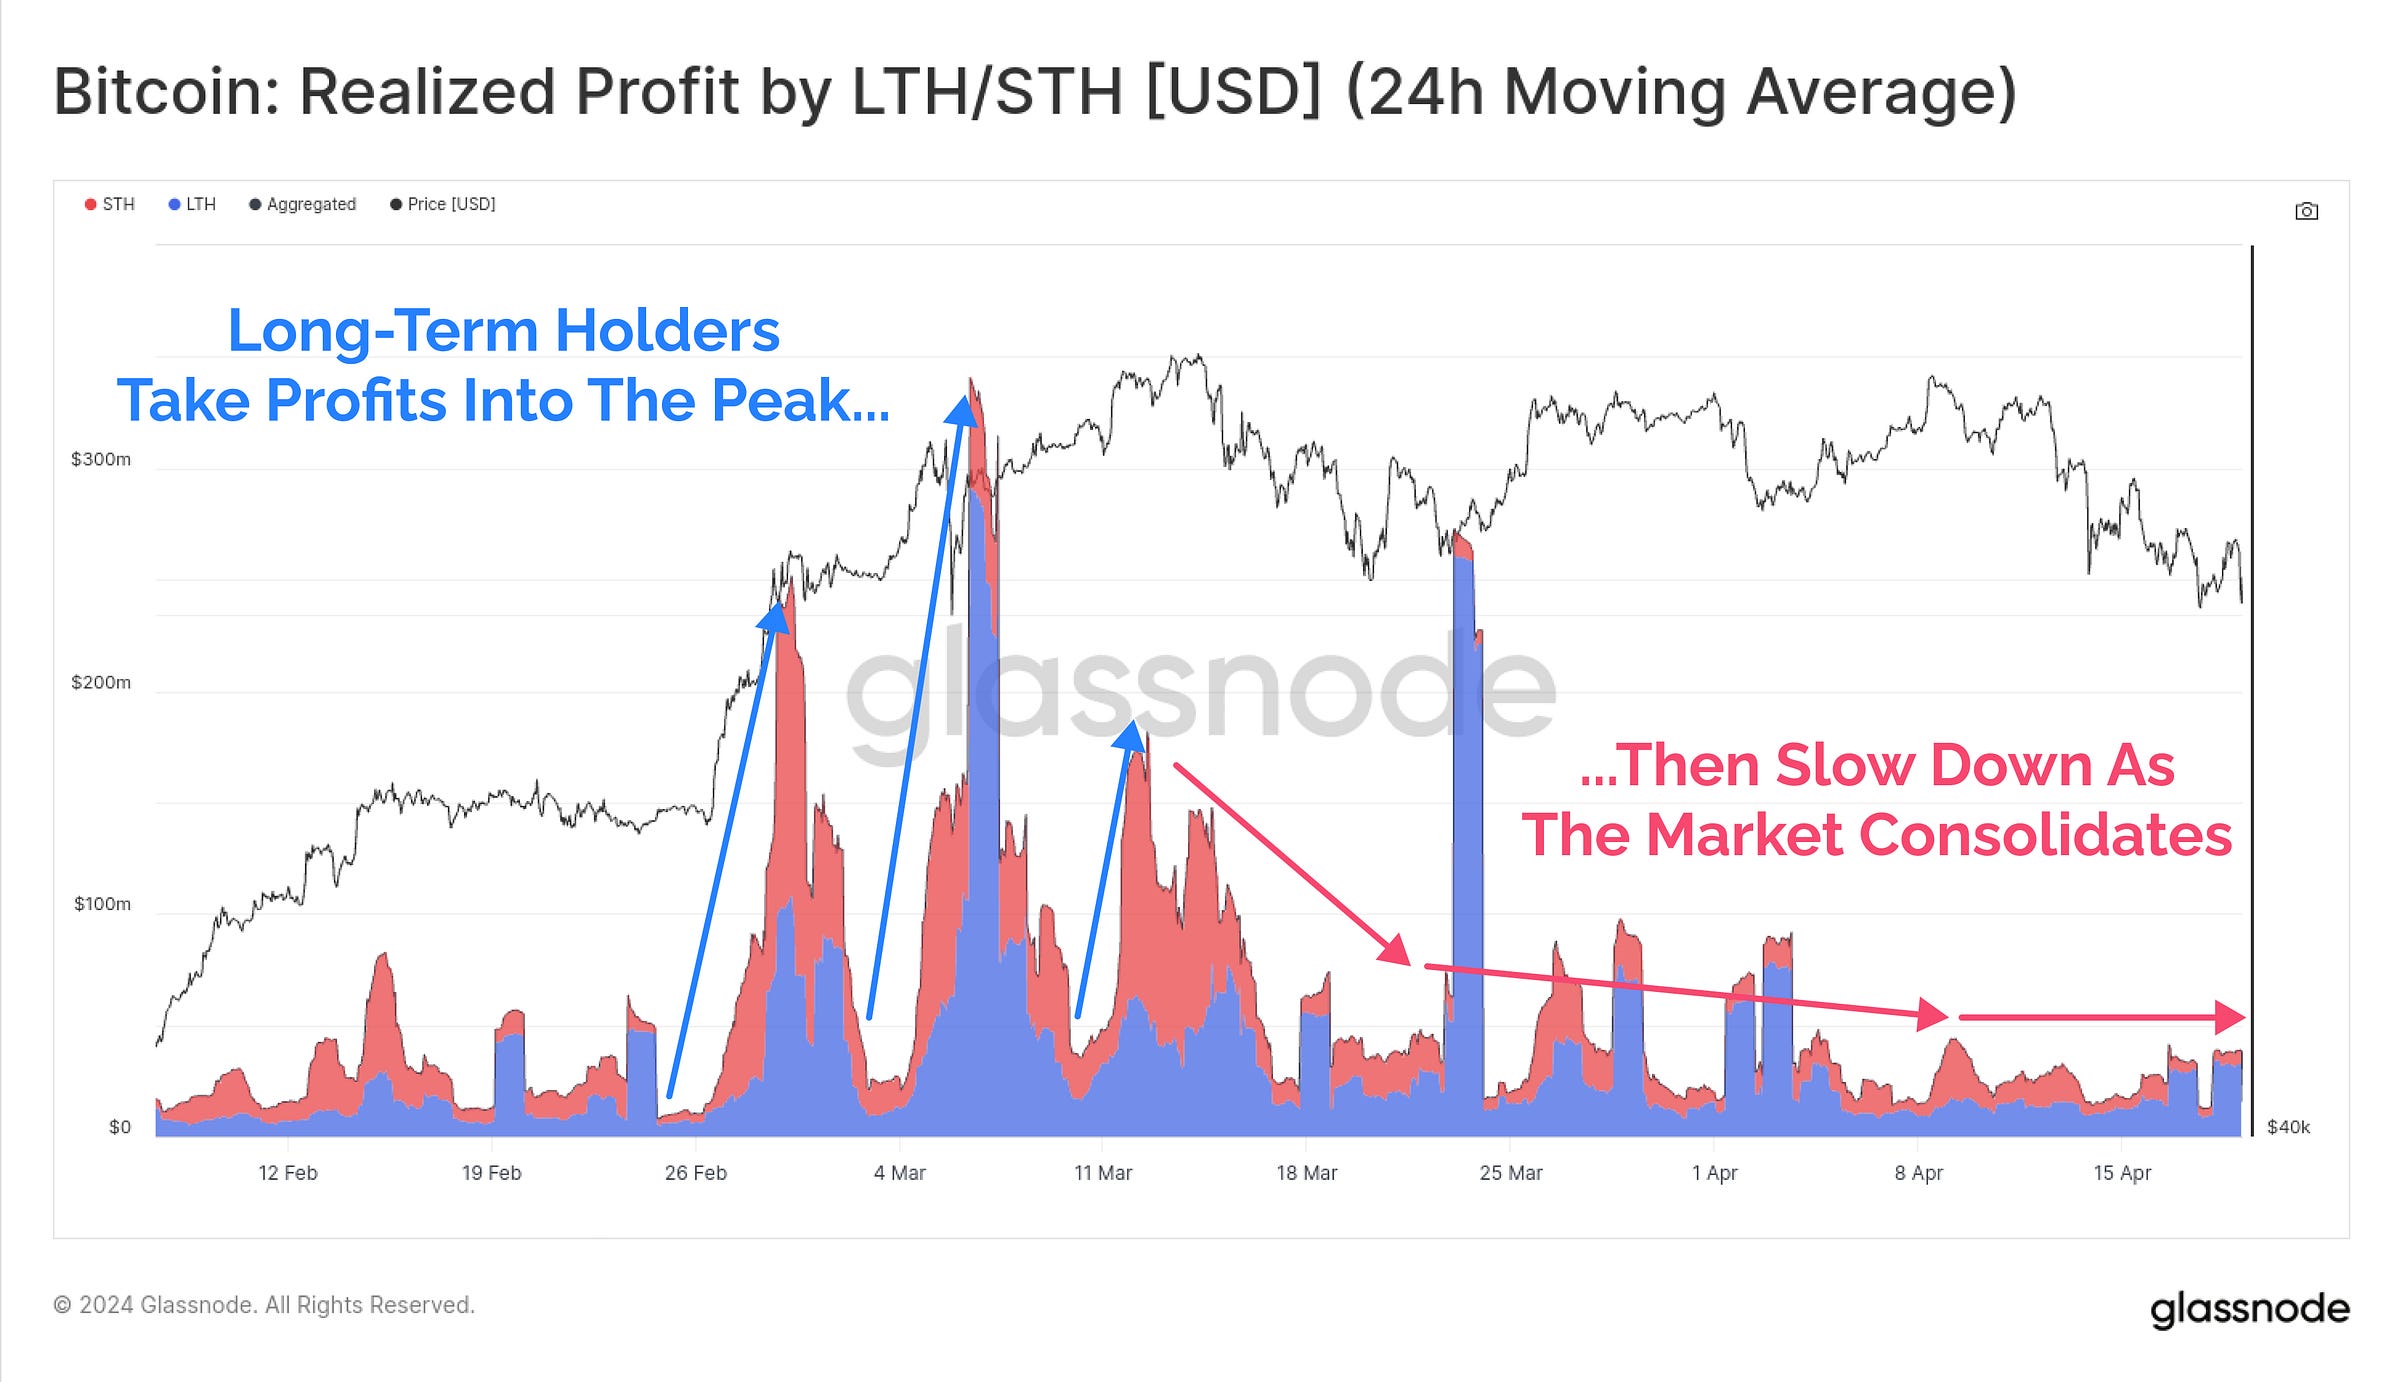
Are Long-Term Holders Taking Panic Profits?
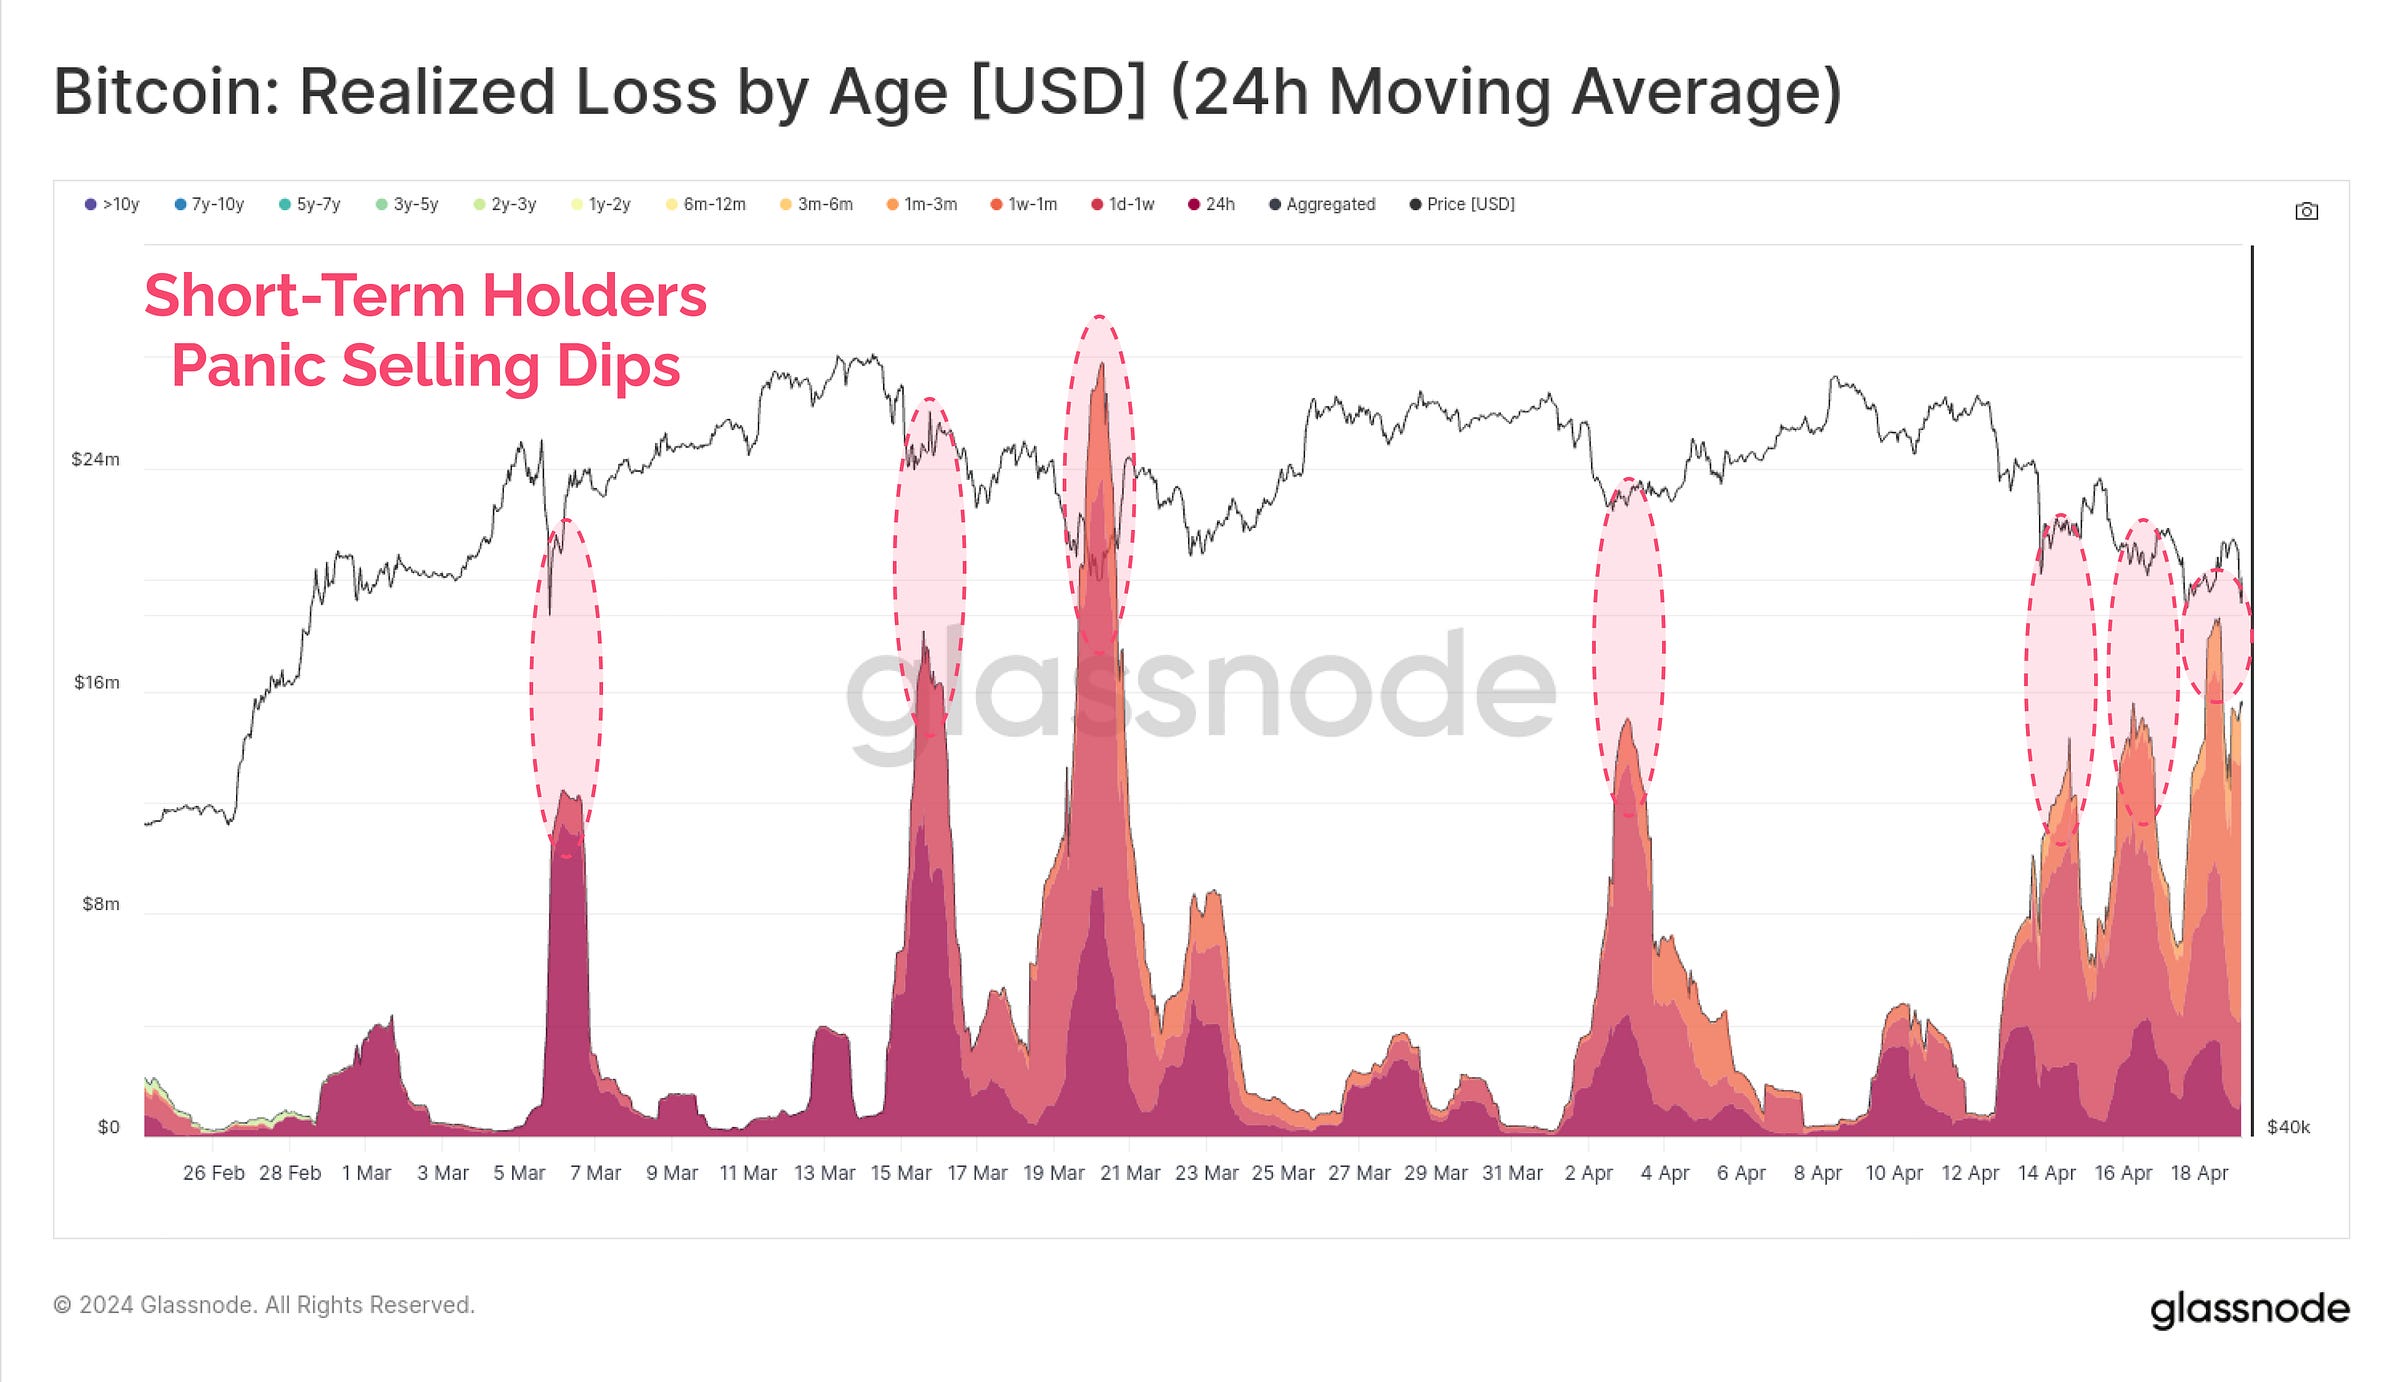
Are Short-Term Holder Panic Selling Dips?
If we look at Realised Profit taking over the last few months, we can see that Long-Term Holders (blue) have really slowed down their activity of late, and don’t seem to be participating a great deal.
As it stands, I don’t see a great deal of ‘panic’ from the strong handed Long-Term Holders, which is on net, a constructive thing to see.
On the flip side, Short-Term Holders do seem to be panic selling dips. Whilst this might sound concerning, this is actually what we want to see.
Markets are unforgiving places, and the human mind is not great at accepting and managing risk. This means that, many folks who buy when it feels great (when numba goes up)…then sell when it feels bad (when numba go down).
The reality is, they should often be doing the exact opposite, but our 100,000+ yr old hardware 🧠 isn’t equipped for the stresses markets create!
When Short-Term Holders panic sell, it actually provides us a contrarian signal that local top buyers, are becoming lettuce handed bottom sellers.
Summary
Holding Bitcoin is a test of your personal resolve, and surviving the ups, downs, and choppy middle ground is no easy feat. There is no shortage of headlines and excuses that the market is looking for to trade lower. After such an incredible 2023-24 so far, chopsolidation remains most likely, as we re-find equilibrium.
In the immediate term, I am still keeping my eye on the $58k to $59k range. If this uptrend is to remain robust, we should see that region be defended, which will be indicated by STH-MVRV and STH-SOPR rebounding strongly. If we lost that zone on a sustained basis, I would have to switch my personal bias, and put on the seatbelt on for a rockier ride, as we could enter top heavy status.
For now, I remain cautious, optimistic, and ready to be patient. Markets take time to digest a 160% gain since the ETFs went live, and patience can often be the hardest skill to master.
Note: I have just shipped both STH MVRV and SOPR in improved format to the checkonchain charting suite, found under Pricing Models (they will update once per day after 00:00 UTC).
Cheers,
James


You mentioned in one of your comments that your primary focus was on the long-term, but are there any metrics you would suggest that would be useful for people trading in the shorter time frames?
Great video update! 😃