

The Bulls Last Stand
This is it. The Bitcoin price has finally reached the long-discussed $95k price zone which we have called the Bulls Last Stand, and it get very hairy should price fall below it.

‘I don’t really care about Bitcoin cycle tops, what I really want to know, is when we hit the bottom.’ - Aussie Bitcoiner overheard at the pub
G’day Folks,
After what feels like an age discussing The Bulls Last Stand of $95k, we’re finally here.
There’s no two ways around it, this is THE line in the sand if the bulls want this market to continue higher, because things get very hairy below this price zone.
The quote above is paraphrased, but was actually said at one of the Sydney Bitcoin meetups. I think about it all the time, because in many ways, it captures the zeitgeist and motivation of the highest conviction Bitcoiners. It is also one of the main motivators for me doing this analysis, to identify and distinguish risky scenarios, from opportunities.
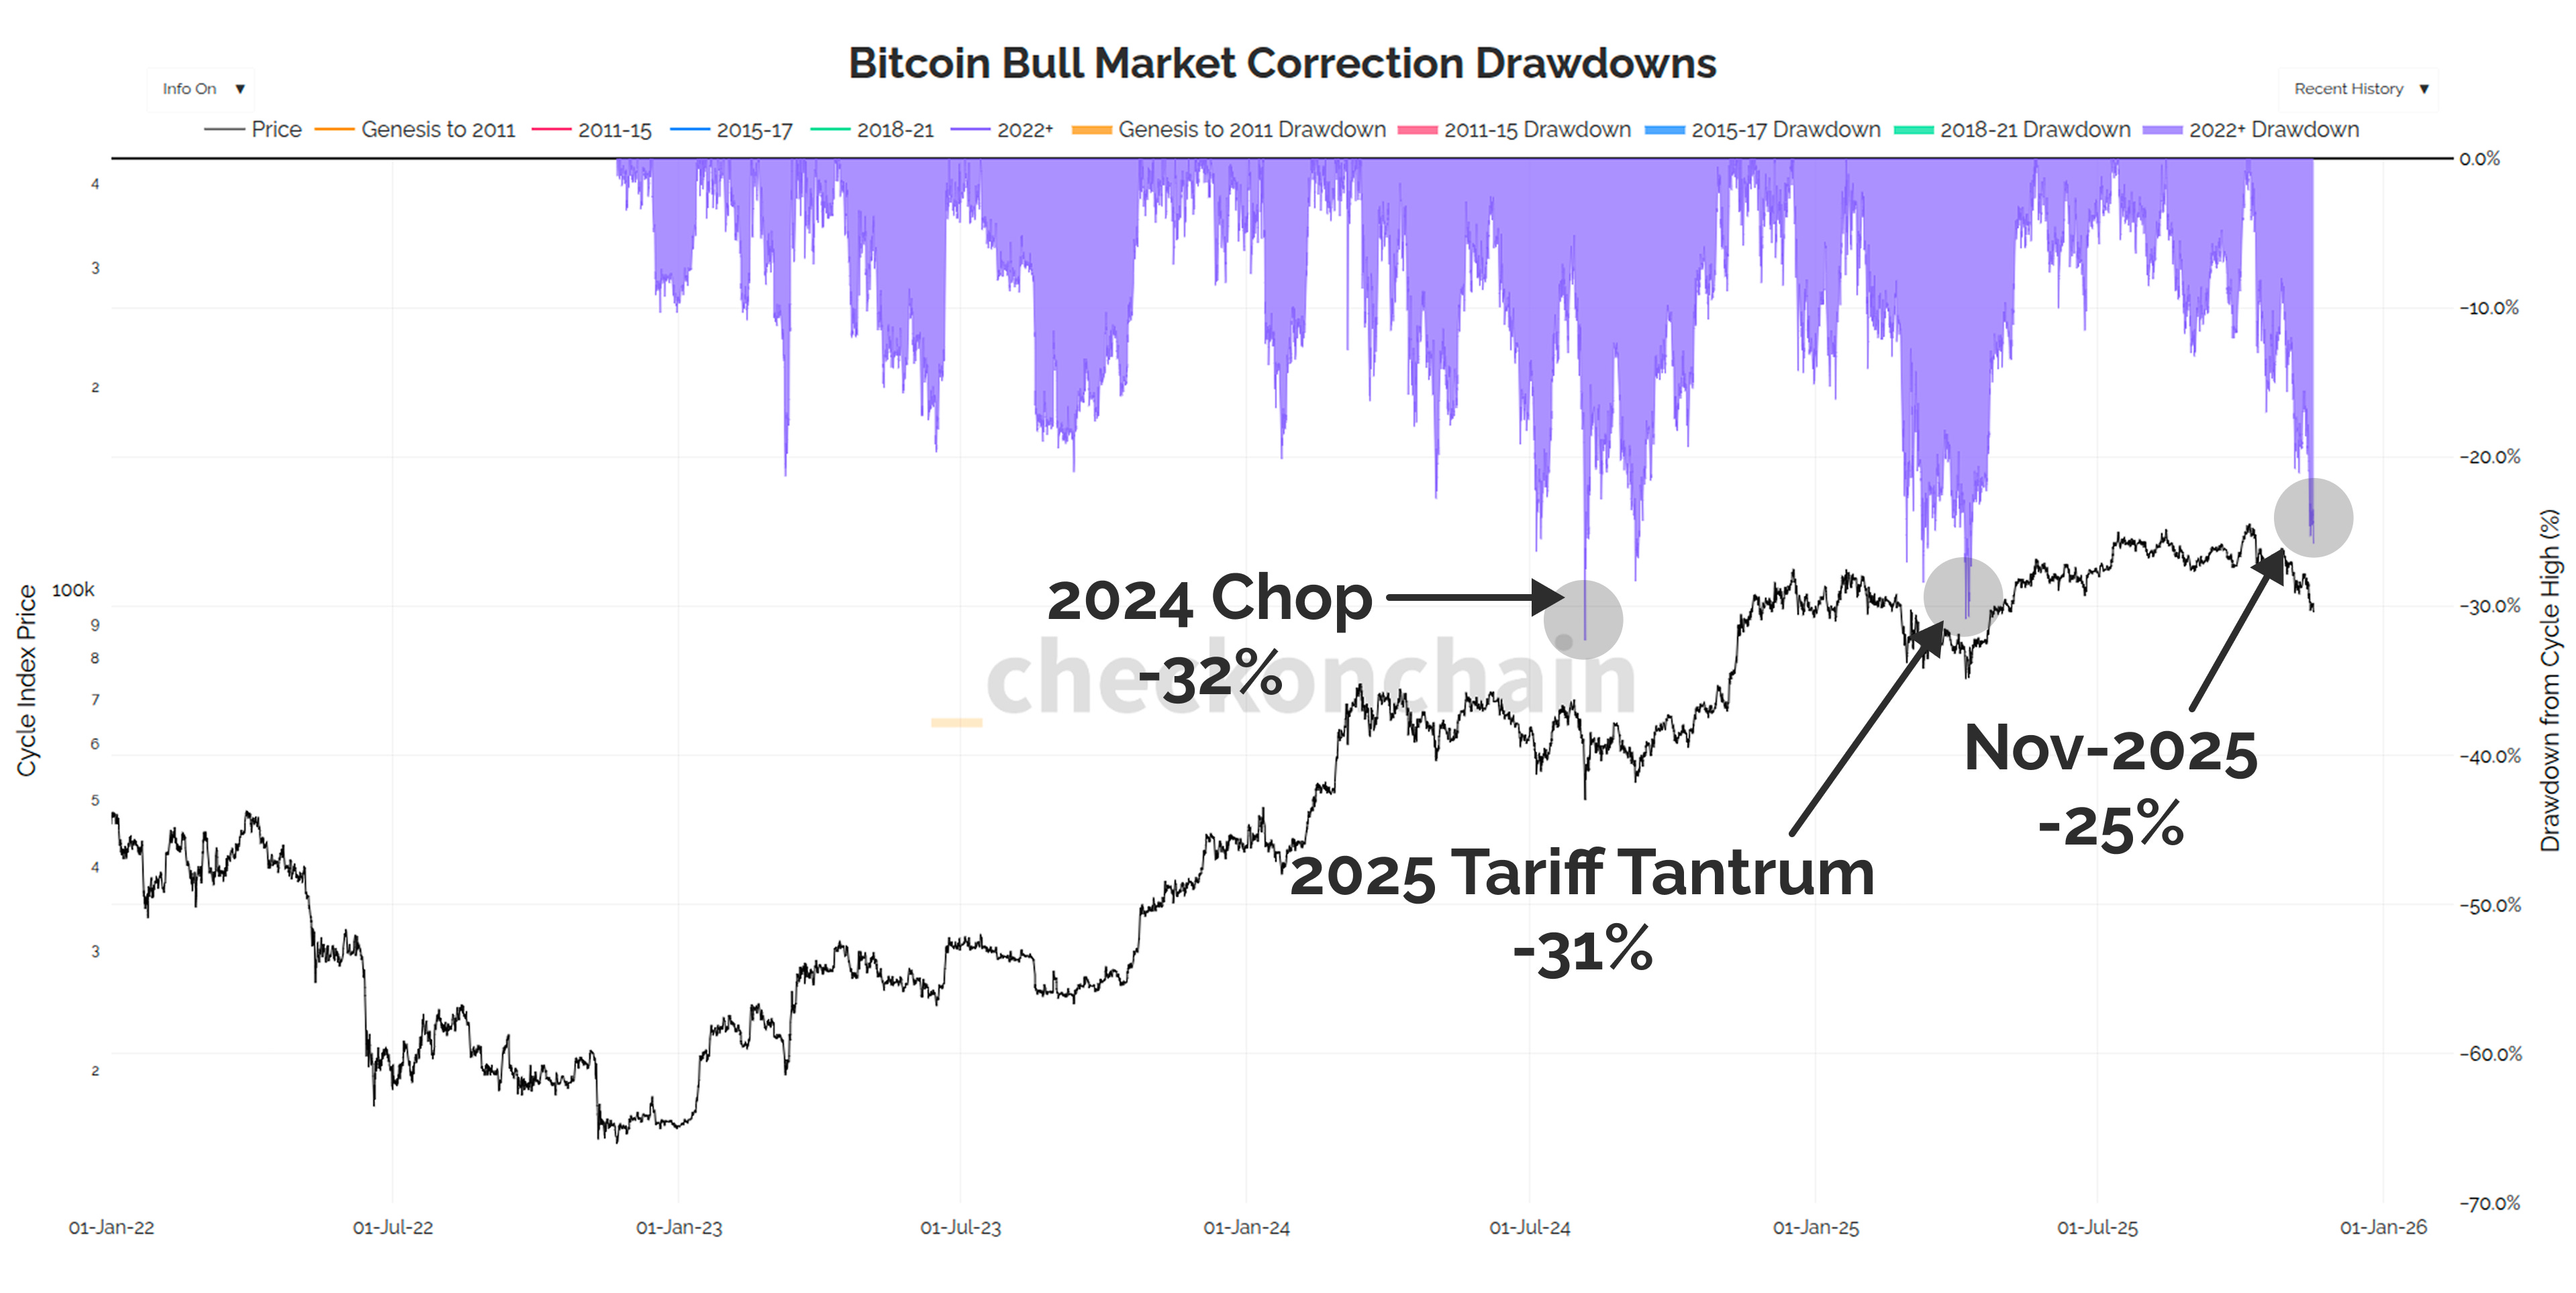
There comes a point in every Bitcoiner’s journey, when you start to really dislike shallow pullbacks of -10% or -15%, because the discount just isn’t big enough to get excited about…
…but once we start to get into the territory of -25%, or more in bears, you find your mind starts working out of all the ways you could raise capital to buy more.
Today’s post starts a new journey, as this downside volatility has broken us out of the endlessly boring sideways grind, and entered us into a new market regime.
We’re now looking for opportunities to capitalise on this drawdown.
We all know Bitcoin has a bright future ahead of it, and the mission from here onward is to look for oversold conditions where sat stacking risk reaches a local (and eventually a global) minimum.
📈 Reminder: you can find the charts from our articles on the Checkonchain Charting Website, and a guide in our Charts Tutorial Video.
Disclaimer: This article is general in nature, and is for informational, and entertainment purposes only, and it shall not be relied upon for any investment or financial decisions.
TL;DR
You will notice a very clear theme in today’s article, and I can broadly summarise my entire market outlook with the following bullet points:
The good news:
This is the most oversold we have been this cycle.
A great majority of mean reversion metrics are in the exact spot both the 2024 and 2025 dips bottomed.
Sell-side from smart money long-term holders appears to have peaked, and is starting to ease off.
This makes $95k the PERFECT spot for the price to bounce higher, and ‘The Bulls Last Stand’ is a very apt term for this level.
The bad news:
That bounce has a very high chance of setting a macro lower high, and rolling over into a bear market.
The bears clearly have the upper hand, and it will take a lot of work and demand to repair the price chart as it stands.
There are still a lot of people levering up in futures markets to long the bottom…and there’s a huge liquidation cluster right below us down to ~$90k.
Prepare as if Check the Analyst is right, and we have now entered a bear market (expecting mid $80ks, and to hammer out a floor above the 2024 chop range).
Hope that Check the HODLer’s gut feel is closer to the mark, and the bulls step in in a big way, creating the low of the dip we all want to see.
Full Premium Video
The Bulls Last Stand
Let’s start with a discussion around the current market conditions, to illustrate why the $95k zone is so important.
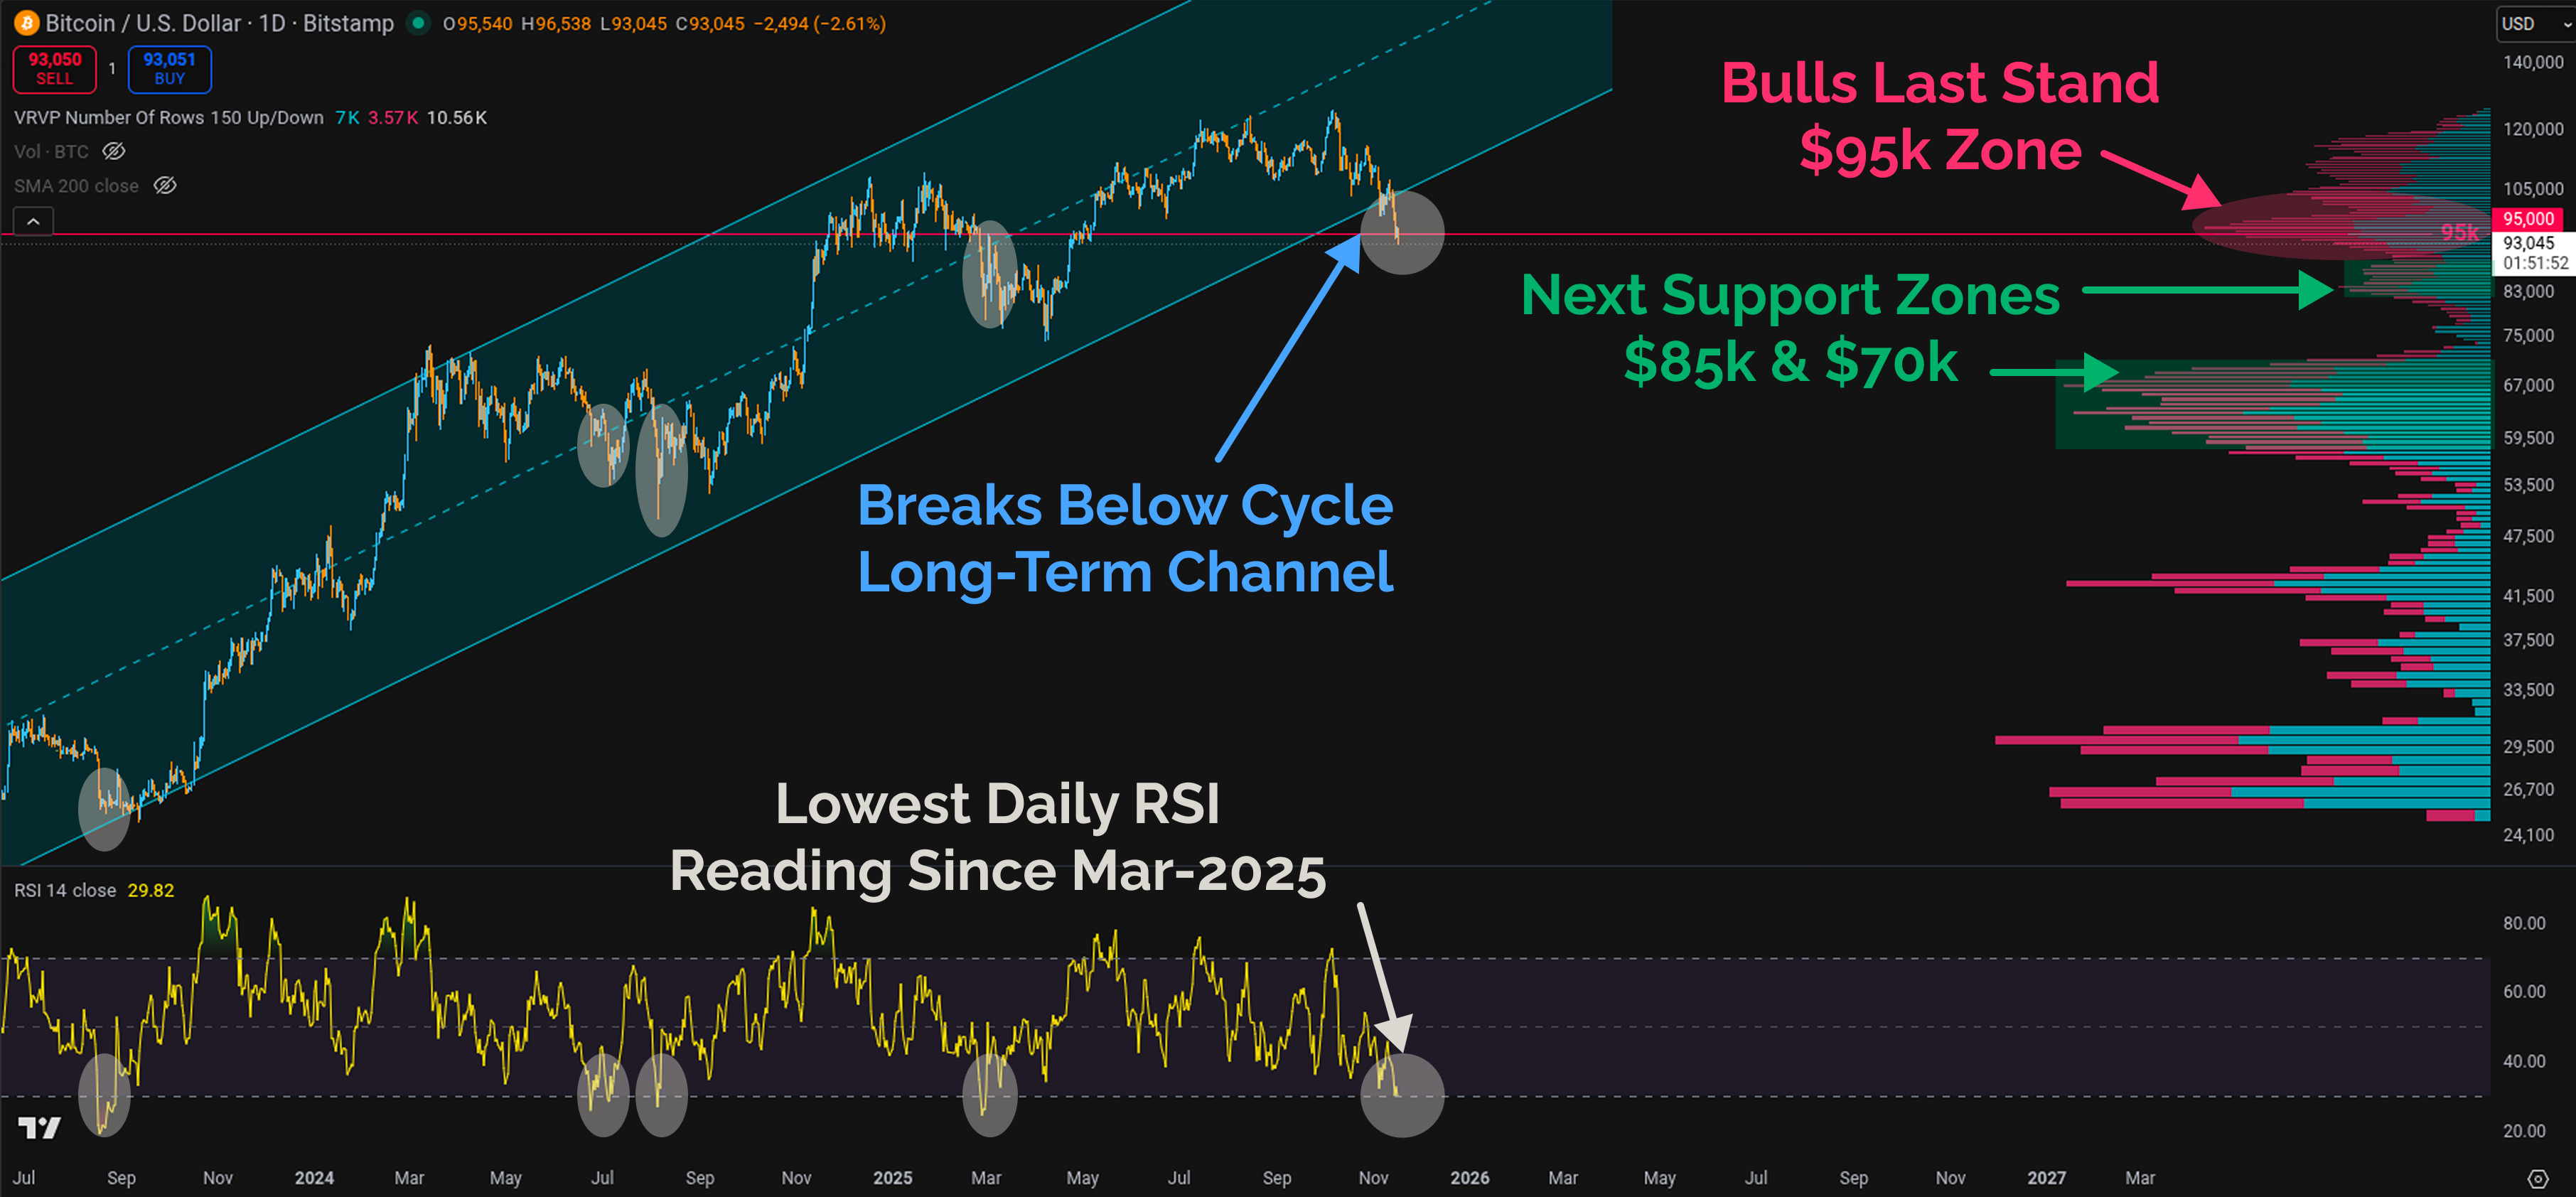
Bitcoin has been trading in a long-term channel since the FTX bottom in late-2022. This sell-off event has brought us outside the lower bound of that channel, which should immediately signal that conditions have changed.
The Bulls Last Stand at $95k has significant confluence between onchain and technical analysis, which makes it a very important price range of interest.
$95k is the base of The HODLers Wall, where the majority of invested capital has its onchain cost basis above it.
Almost all of the mean reversion oscillators I track have bottomed in this exact position in the 2024 and 2025 dips.
$95k is the lowermost ‘point of control’ from a volume profile perspective. Price often trades between zones where significant trade volume occurred in the past, as it represents a historical zone where a lot of demand met a lot of supply.
The daily RSI-14 has reached the most oversold conditions since Mar-2025. Whilst I don’t spend too much time looking at the RSI, I know a lot of institutional investors will, so this signal is important to note.
The next major volume clusters are much lower, down at $85k (small one), and then back into the 2024 chopsolidation range between $60k and $70k (major one).
From a simple technical chart analysis perspective, this is THE time for the market to bounce.
When we have such a large amount of confluence, aligned with an over-extension to the downside, it is a clear sign to the bulls that a lot of the immediate heat has been flushed out of the market.
However, if the price does not bounce hard over the coming week, it suggests the bulls simply don’t have any fight left in them, and it becomes very likely we head down into the $80k region.
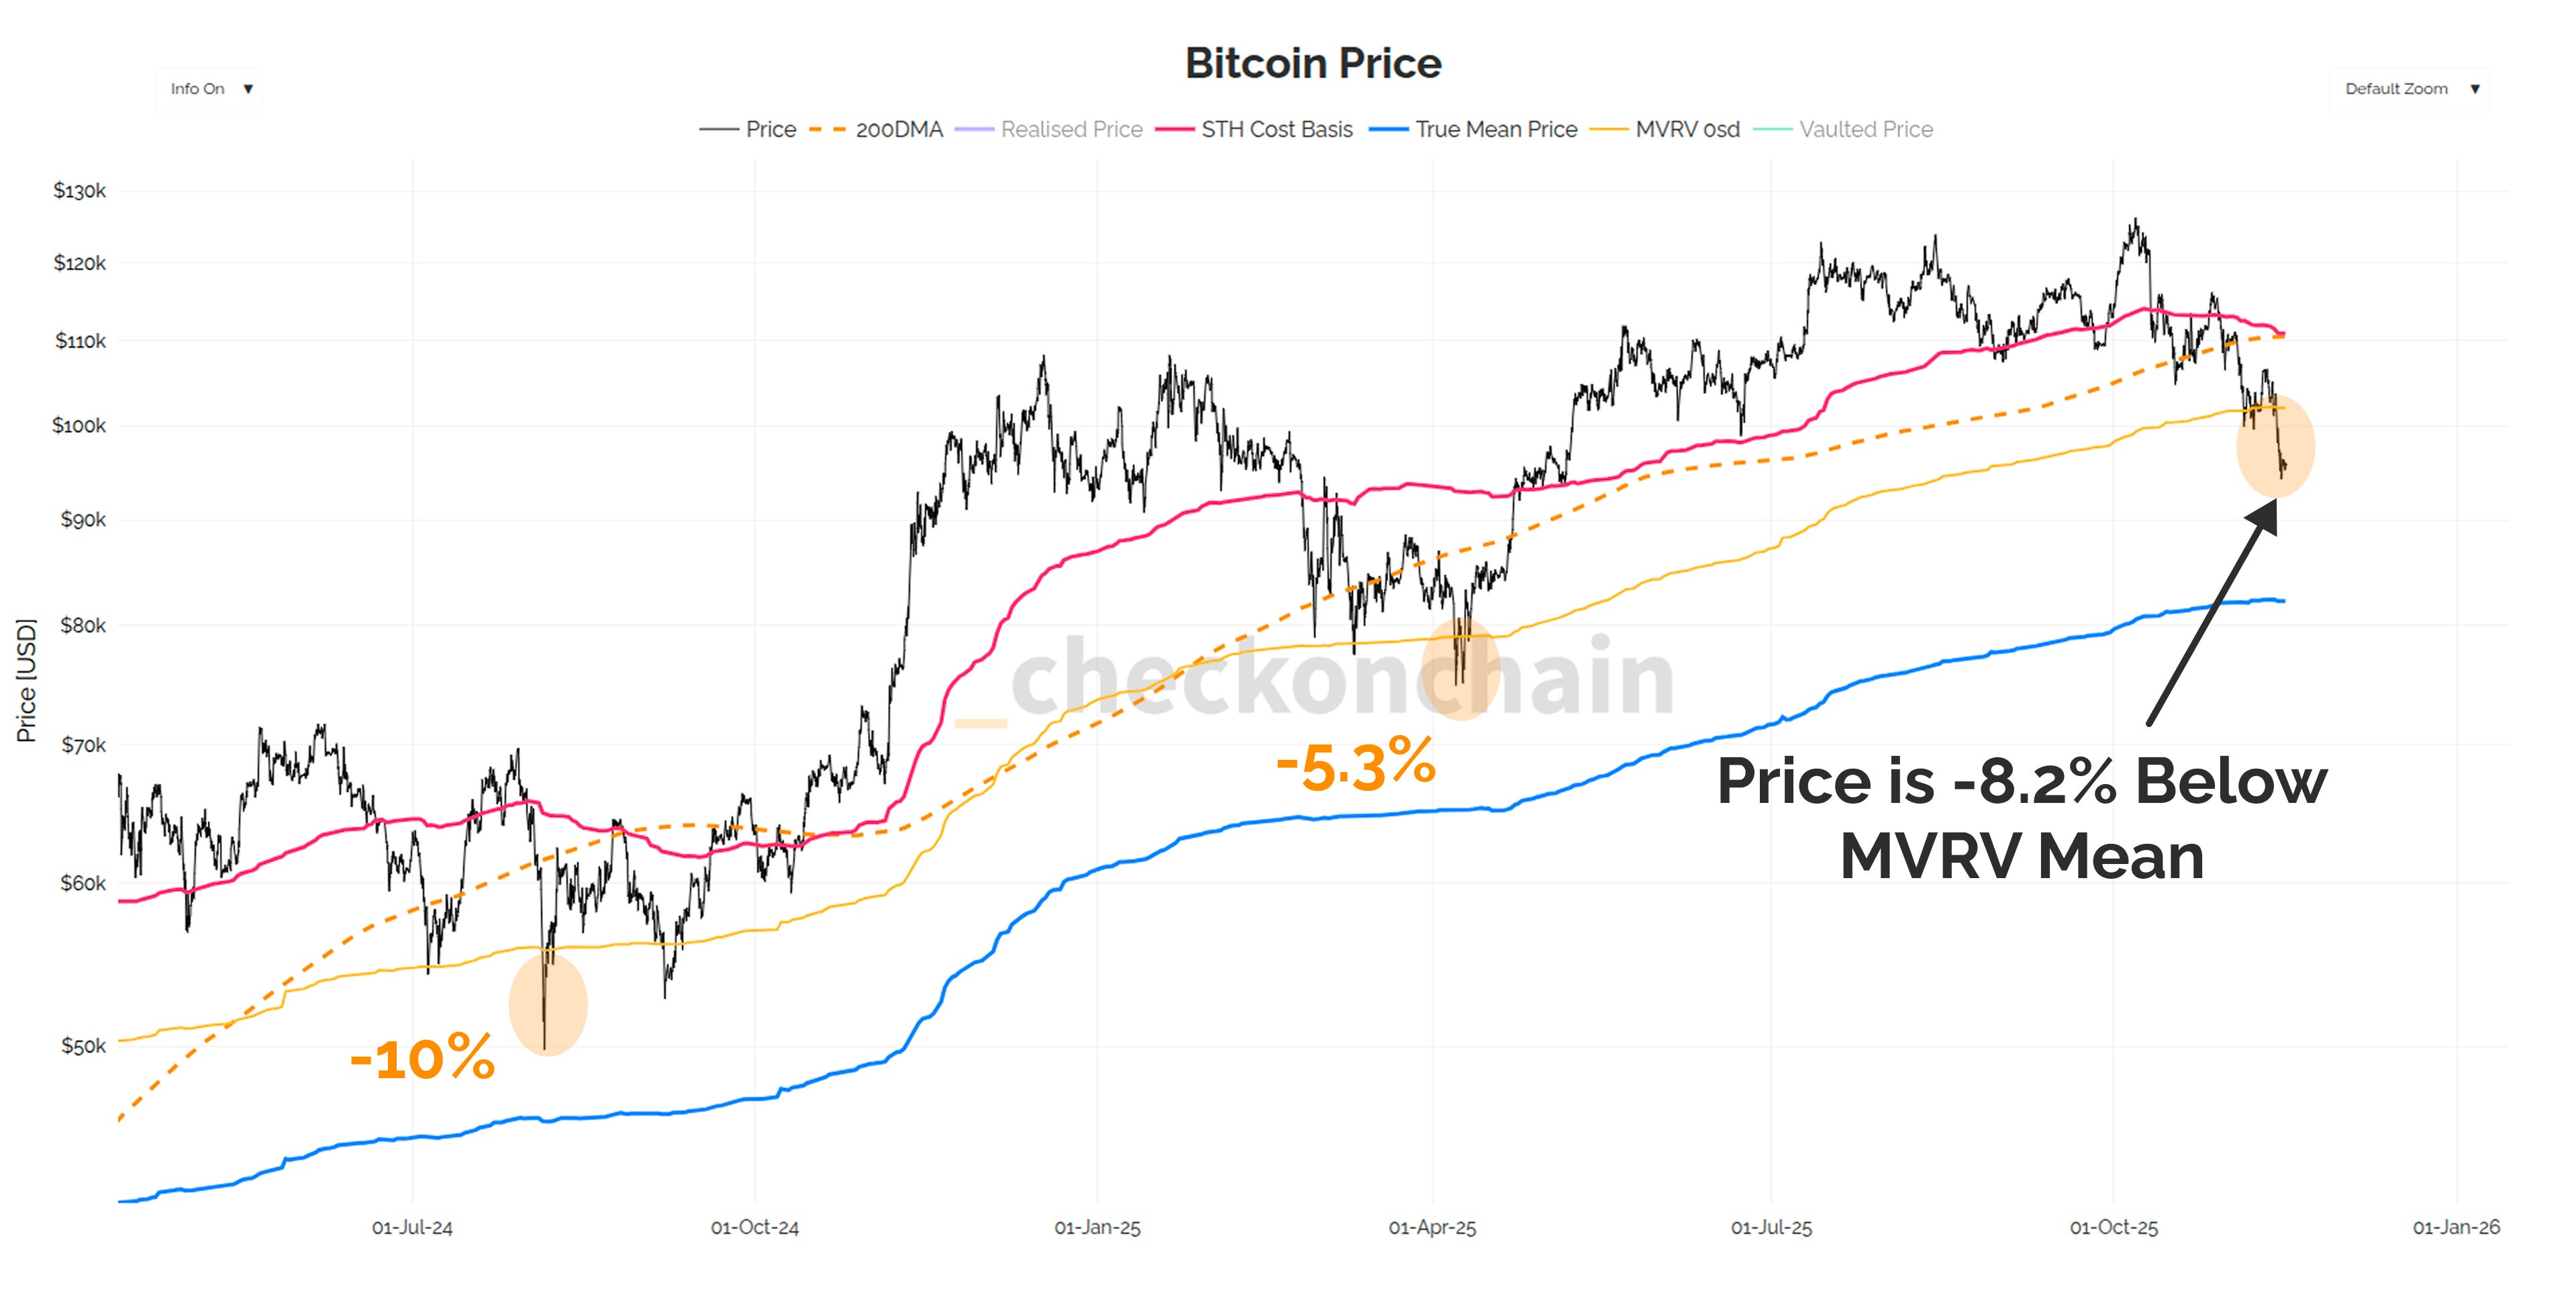
MVRV is an oscillator which describes the ROI held by the average unit of BTC held onchain. Over the long-term, it displays average value is around 1.8, which means the average coin typically holds an +80% return.
We can convert this insight into a price level which reflects this average portfolio value, shown in the chart below in yellow.
We’re currently trading -8.2% below this onchain price model, which is in line with the lows of the 2024 and 2025 dips. However, note that both of those events were brief, and followed by a sharp V-shaped recovery.
The price needs to recover from these levels quickly in my opinion. The longer we spend chopping around down here, the more likely we are to construct a technical bear flag, which would add more weight to this dip no longer being a dip.
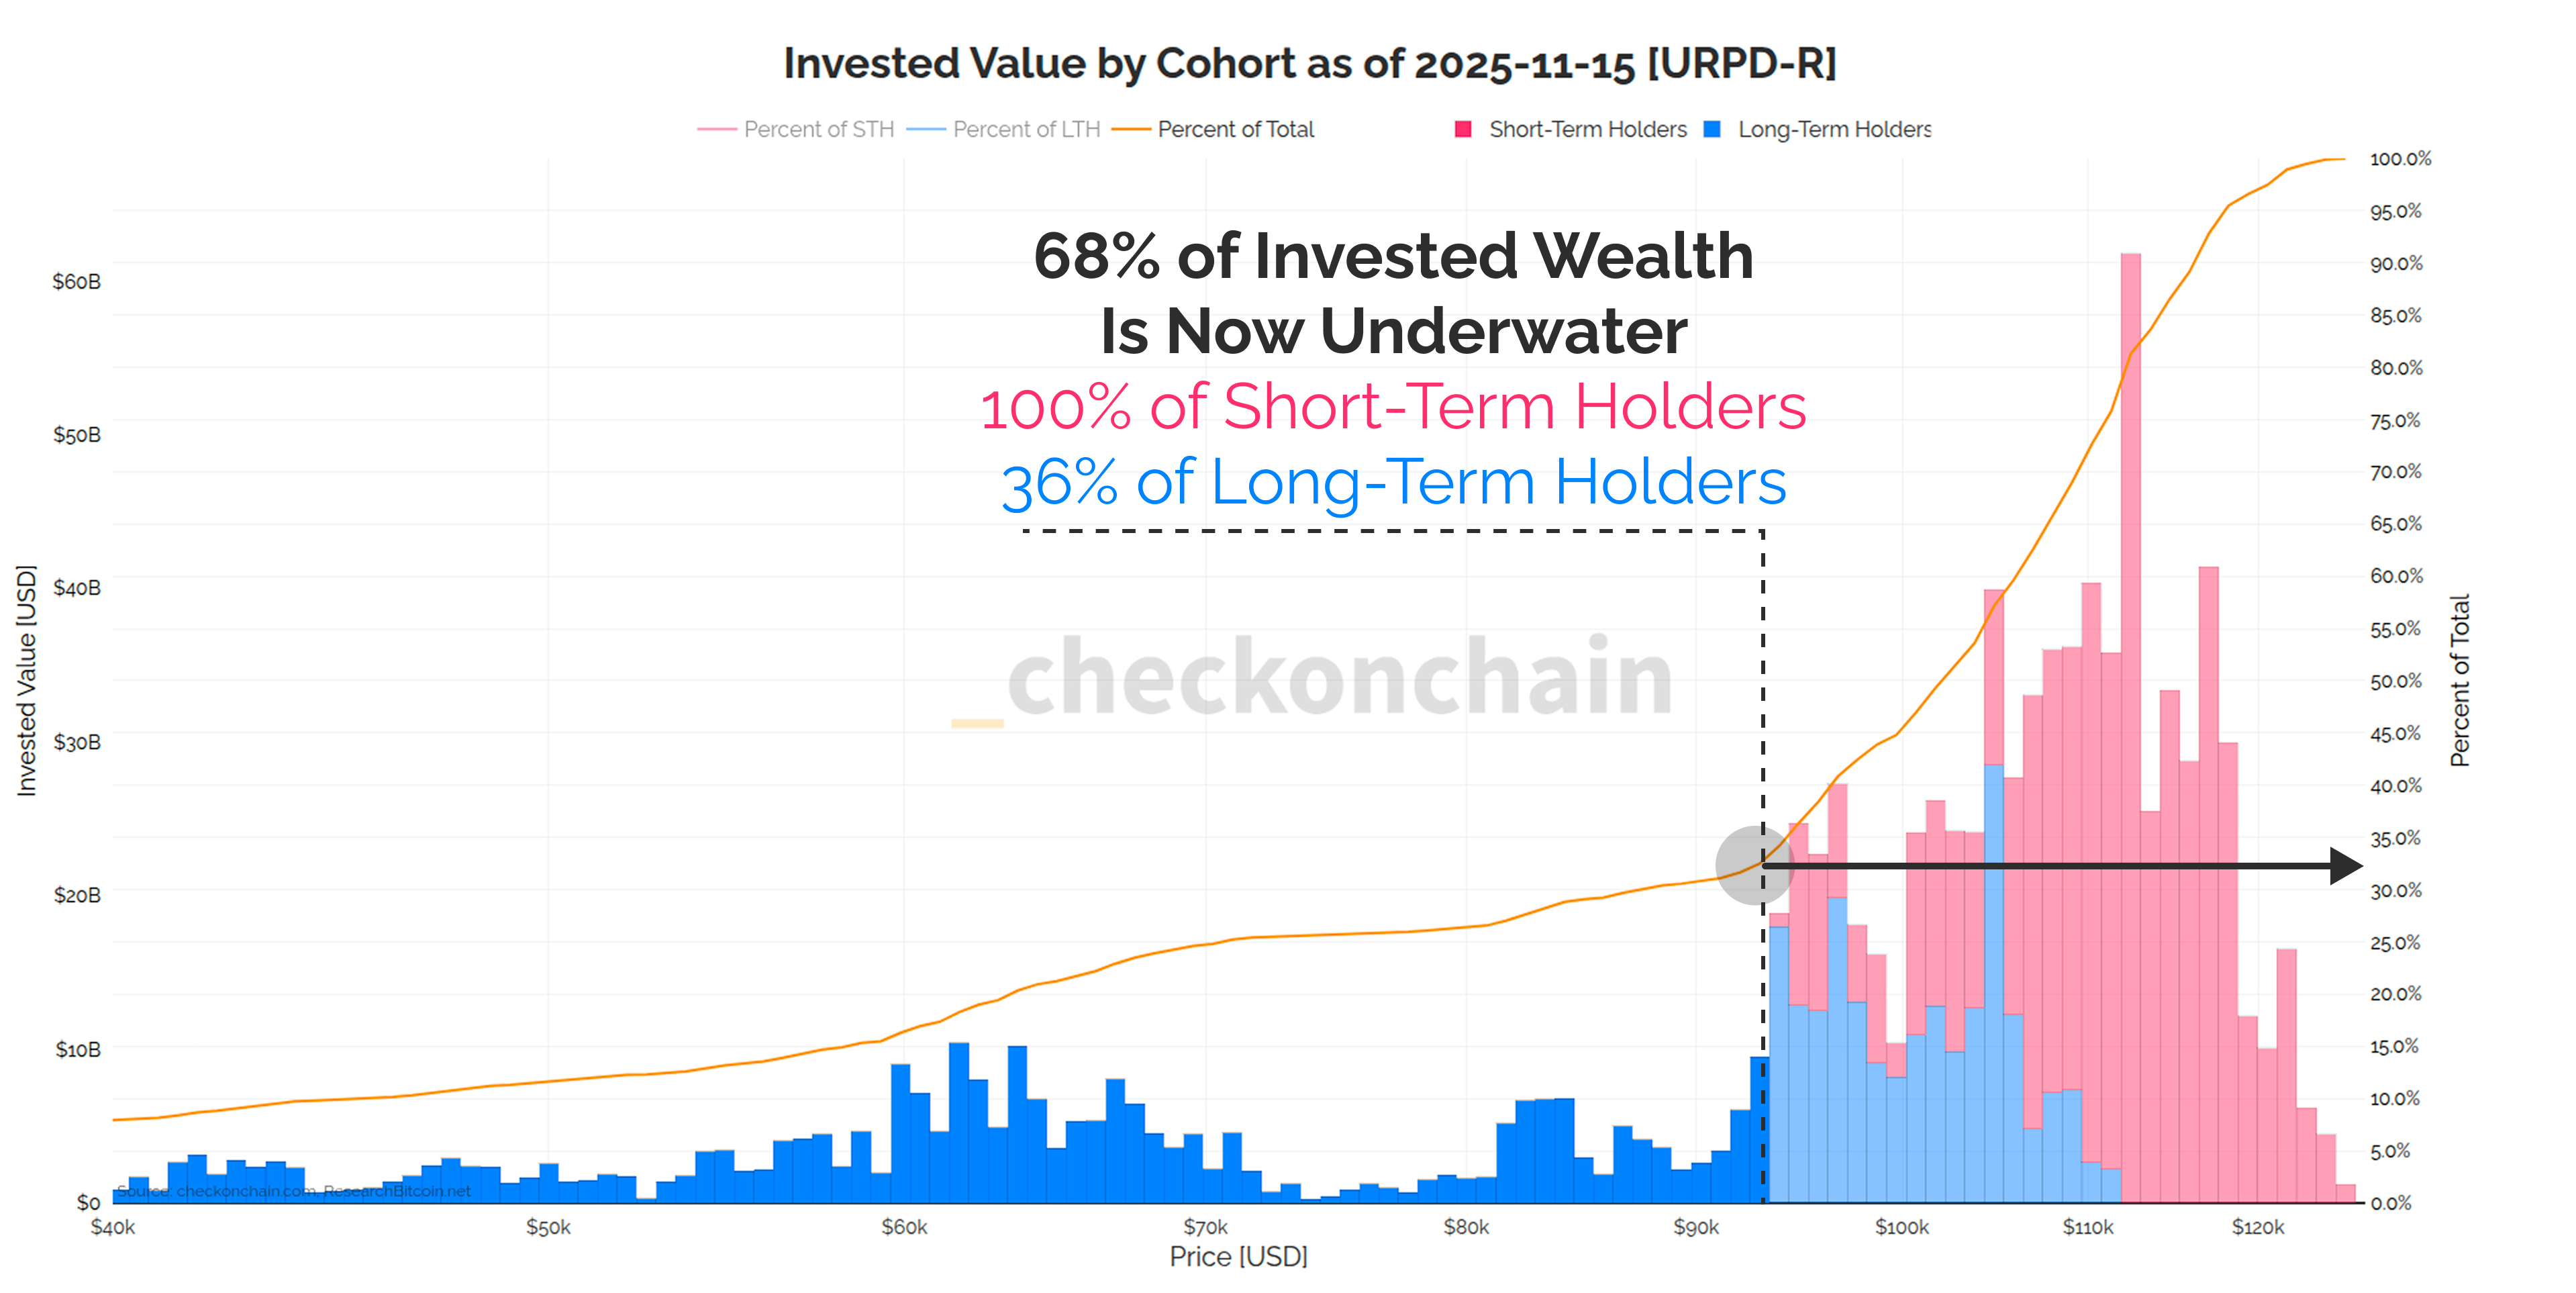
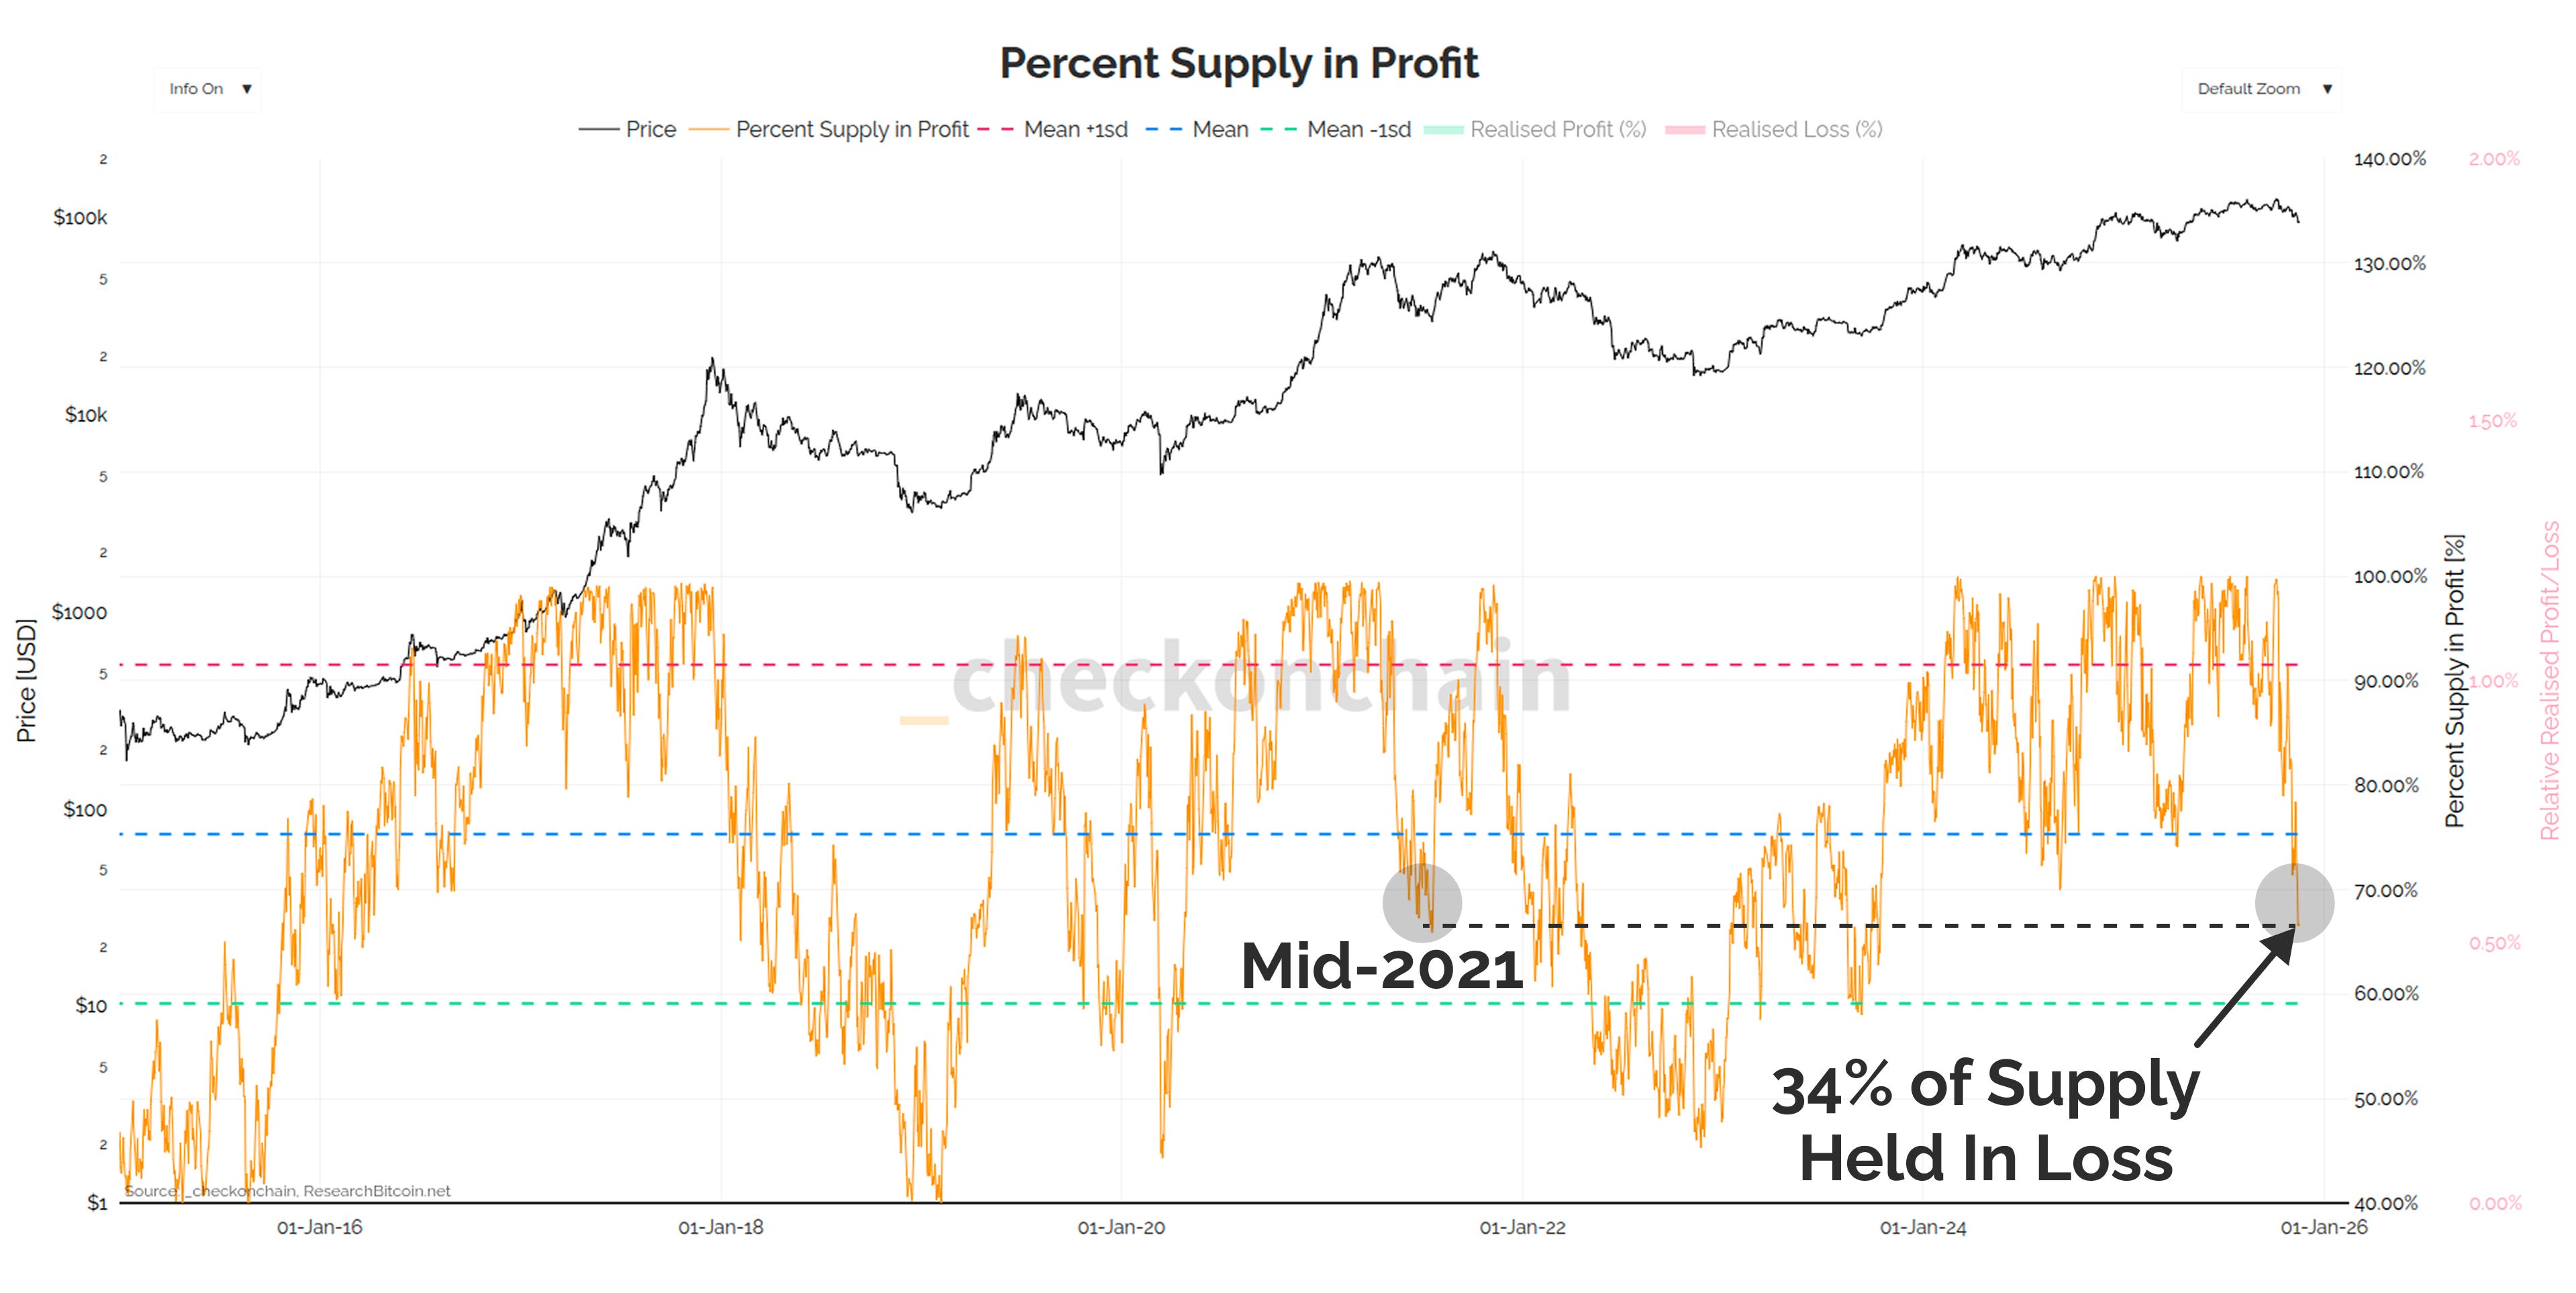
At $92k, 68% of the invested capital in Bitcoin is now underwater.
At this level, 100% of all Short-Term Holder capital, and 36% of all Long-Term Holder capital is sitting on an unrealised loss, which will be a meaningful headwind for sentiment moving forwards.
Note: this chart values each coin at the price it last moved onchain, and therefore reflects the USD denominated ‘capital invested’ in Bitcoin.
The total volume of supply (in BTC terms) which is underwater is 5.4M BTC (34% of supply), which is by far the most we have seen this cycle.
The only time we have seen this much supply held in loss during a technical bull market, was the sell-off in mid-2021…which to be fair, was also arguably the start of that bear market as we covered last week (at least in sentiment terms).
We’re even at the stage where 11% of Long-Term Holder coins are now underwater, which is about as bad as the worst day in Aug-2024.
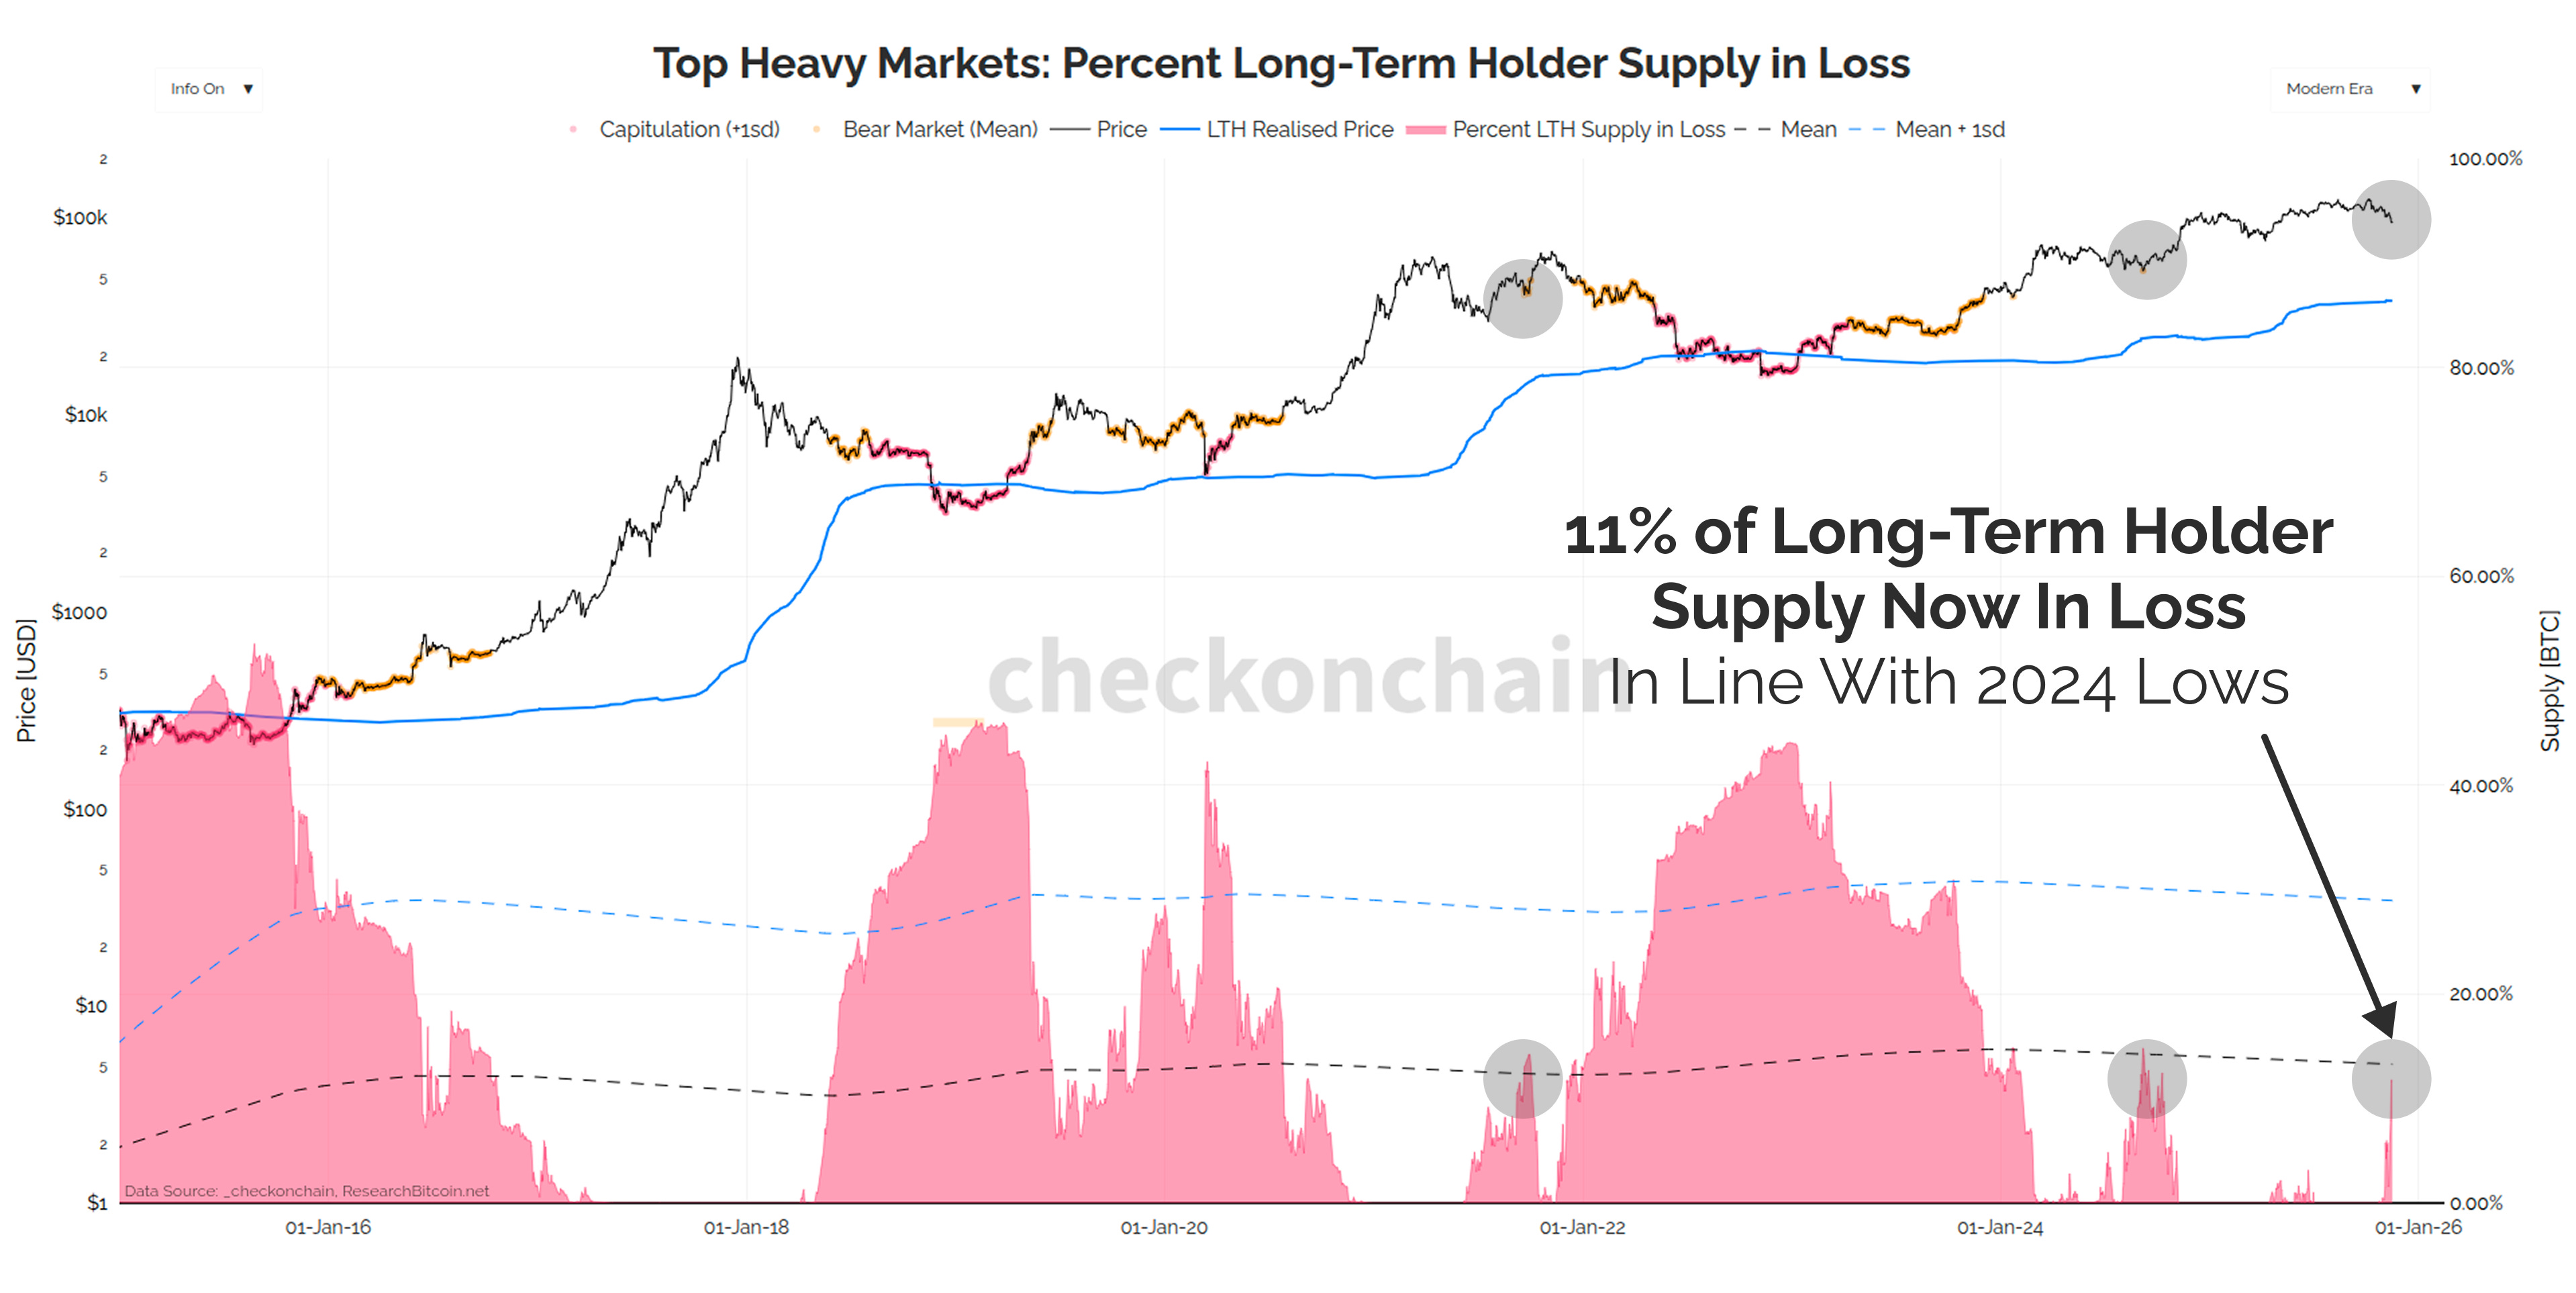
Now just because a coin is ‘in loss’, doesn’t necessarily mean it is in loss by a large margin. The chart above simply looks at whether the spot price is above or below the onchain cost basis, and a coin will be ‘in loss’ even if it is under by 1-cent.
Every Bitcoiner knows that their latest buy probably goes underwater by at least a few percentage points, and -5% to -10% dips rarely affect our collective mood.
However, as the magnitude of the loss grows, so too does the hit to our near-term sentiment.
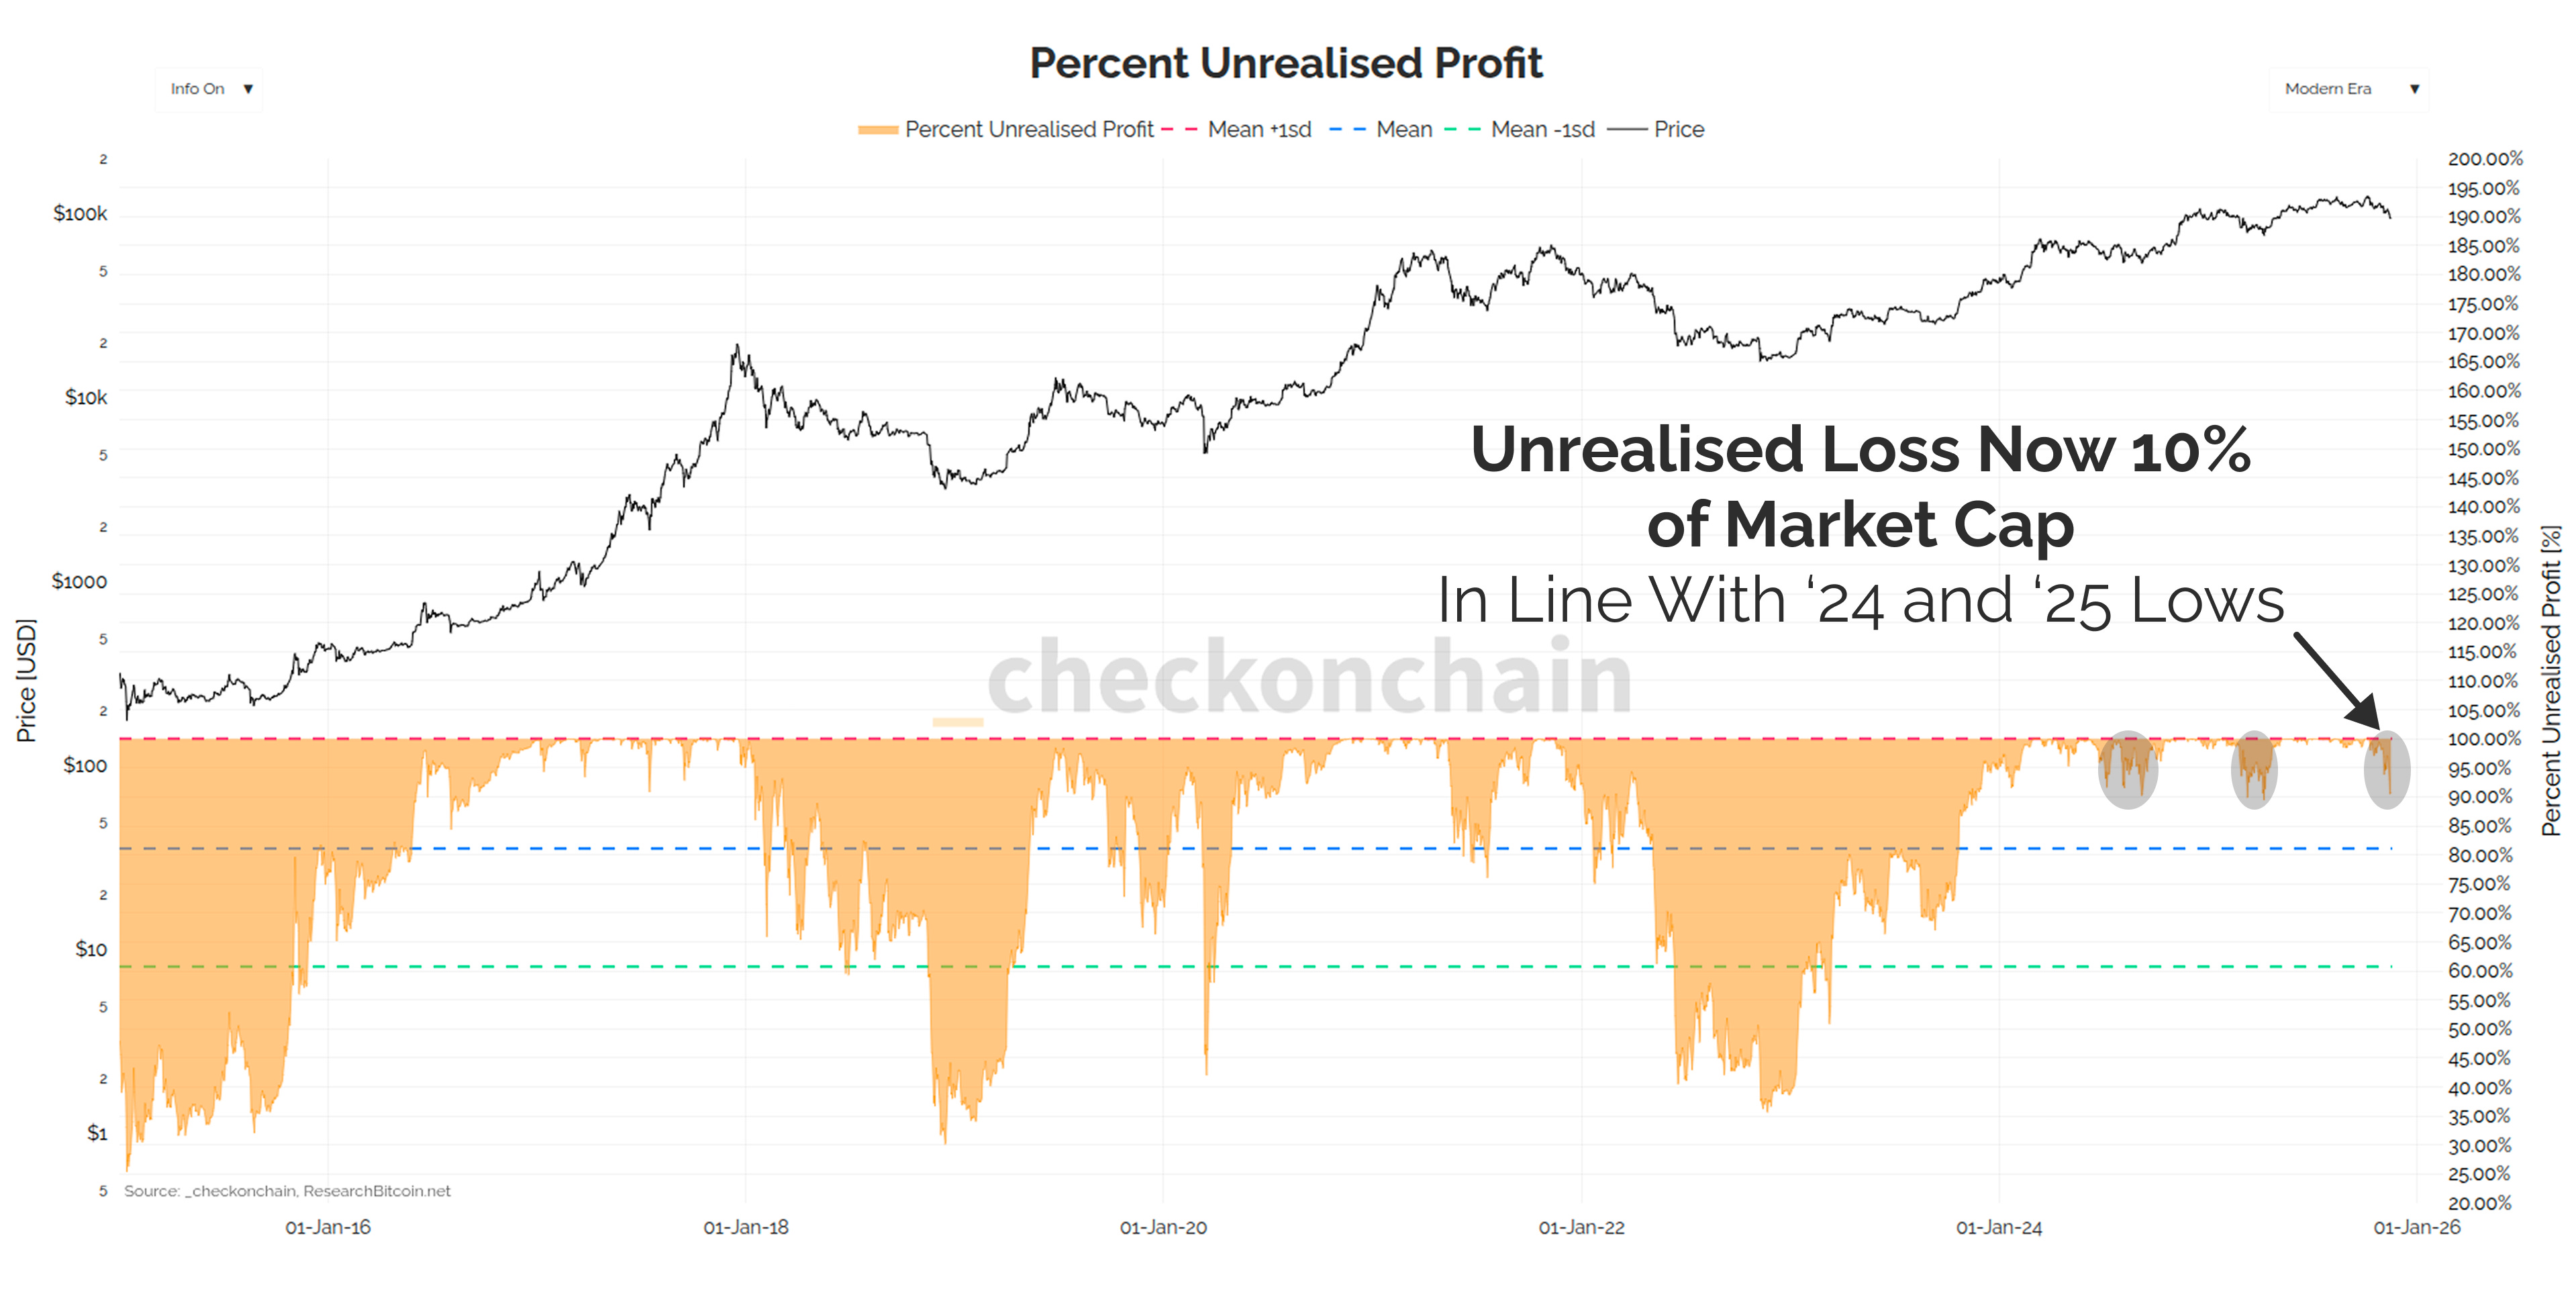
This is why I prefer to measure the ‘damage’ in terms of unrealised loss, being the aggregate USD size of the losses we all hold.
Unrealised losses are currently equivalent to -10% of the market cap, which is just as bad as it was at the 2024 and 2025 lows.
If the price goes lower, we start testing the pain threshold of investors that is historically associated with bear markets, and not dips.
Mean Reversion
The above metrics describe the ‘damage dealt’ by this sell-off, measuring the scale of unrealised losses held by investors.
Another way to assess market conditions is using mean reversion oscillators, which describe how the Bitcoin price oscillates around some long term anchor.
All markets are mean reverting, which means price tends to run away from that anchor (upside and downside), but eventually it gets hauled back towards the centre. The trick of course is picking the correct anchor point, and there are several candidates for this from both an onchain and technical perspective.
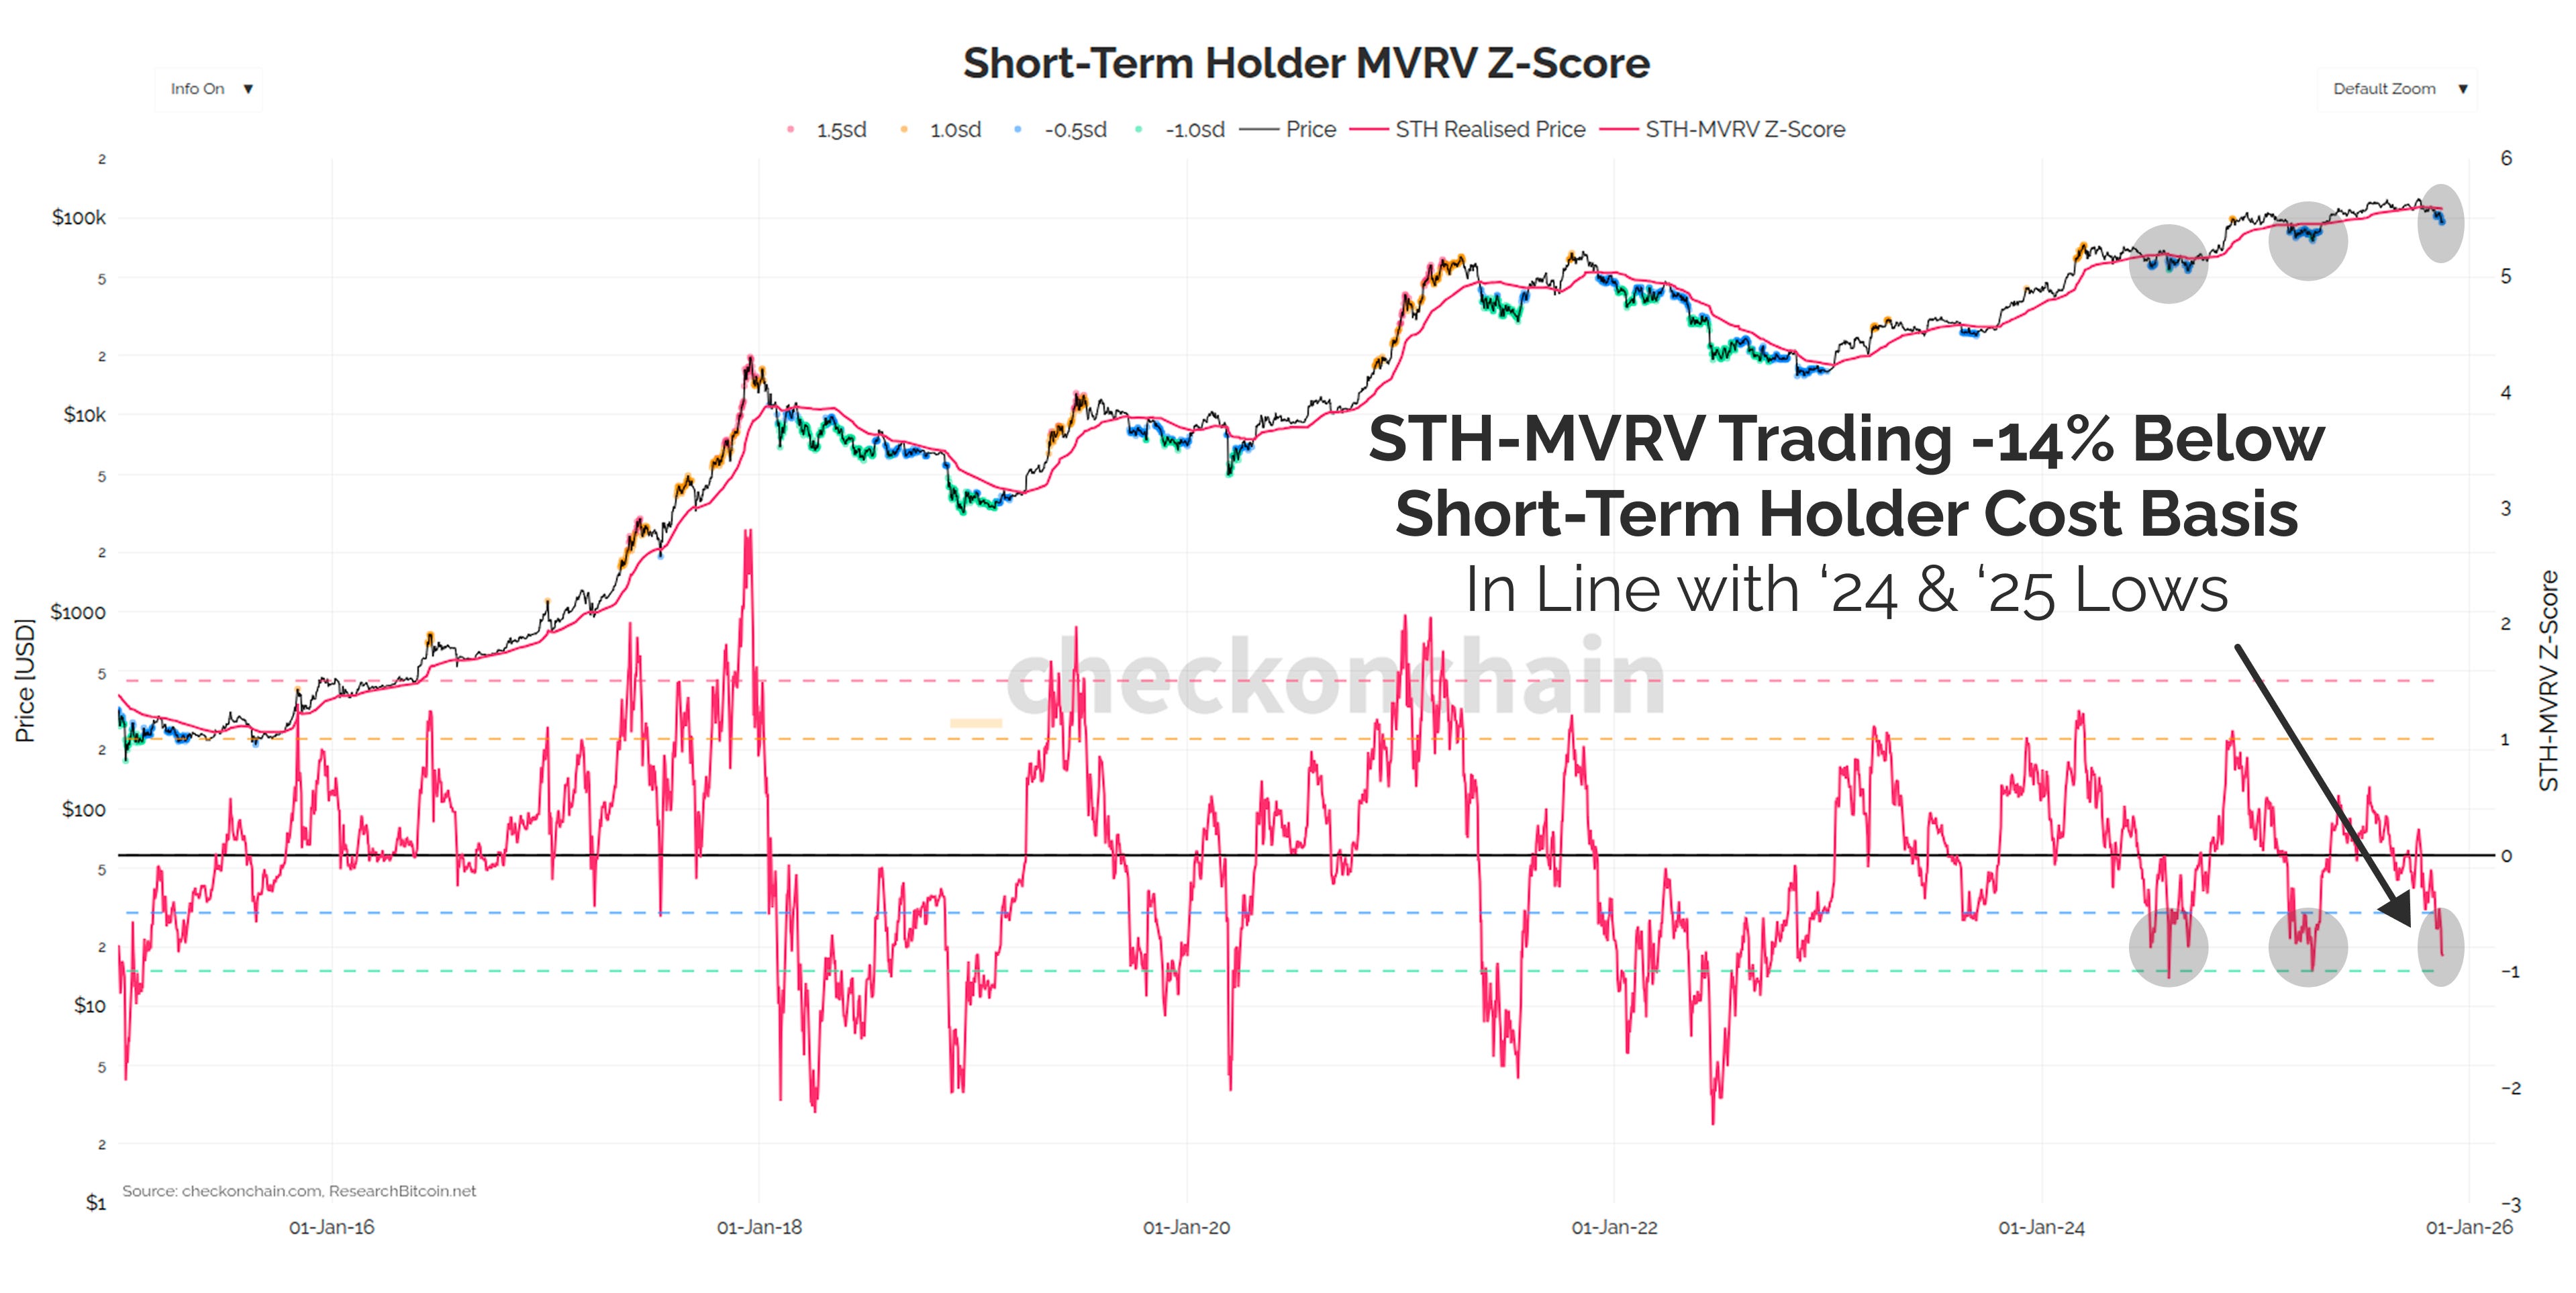
The price is currently trading -14% below the 200-day moving average, which is where we bottomed in 2023, 2024 and 2025 this cycle.
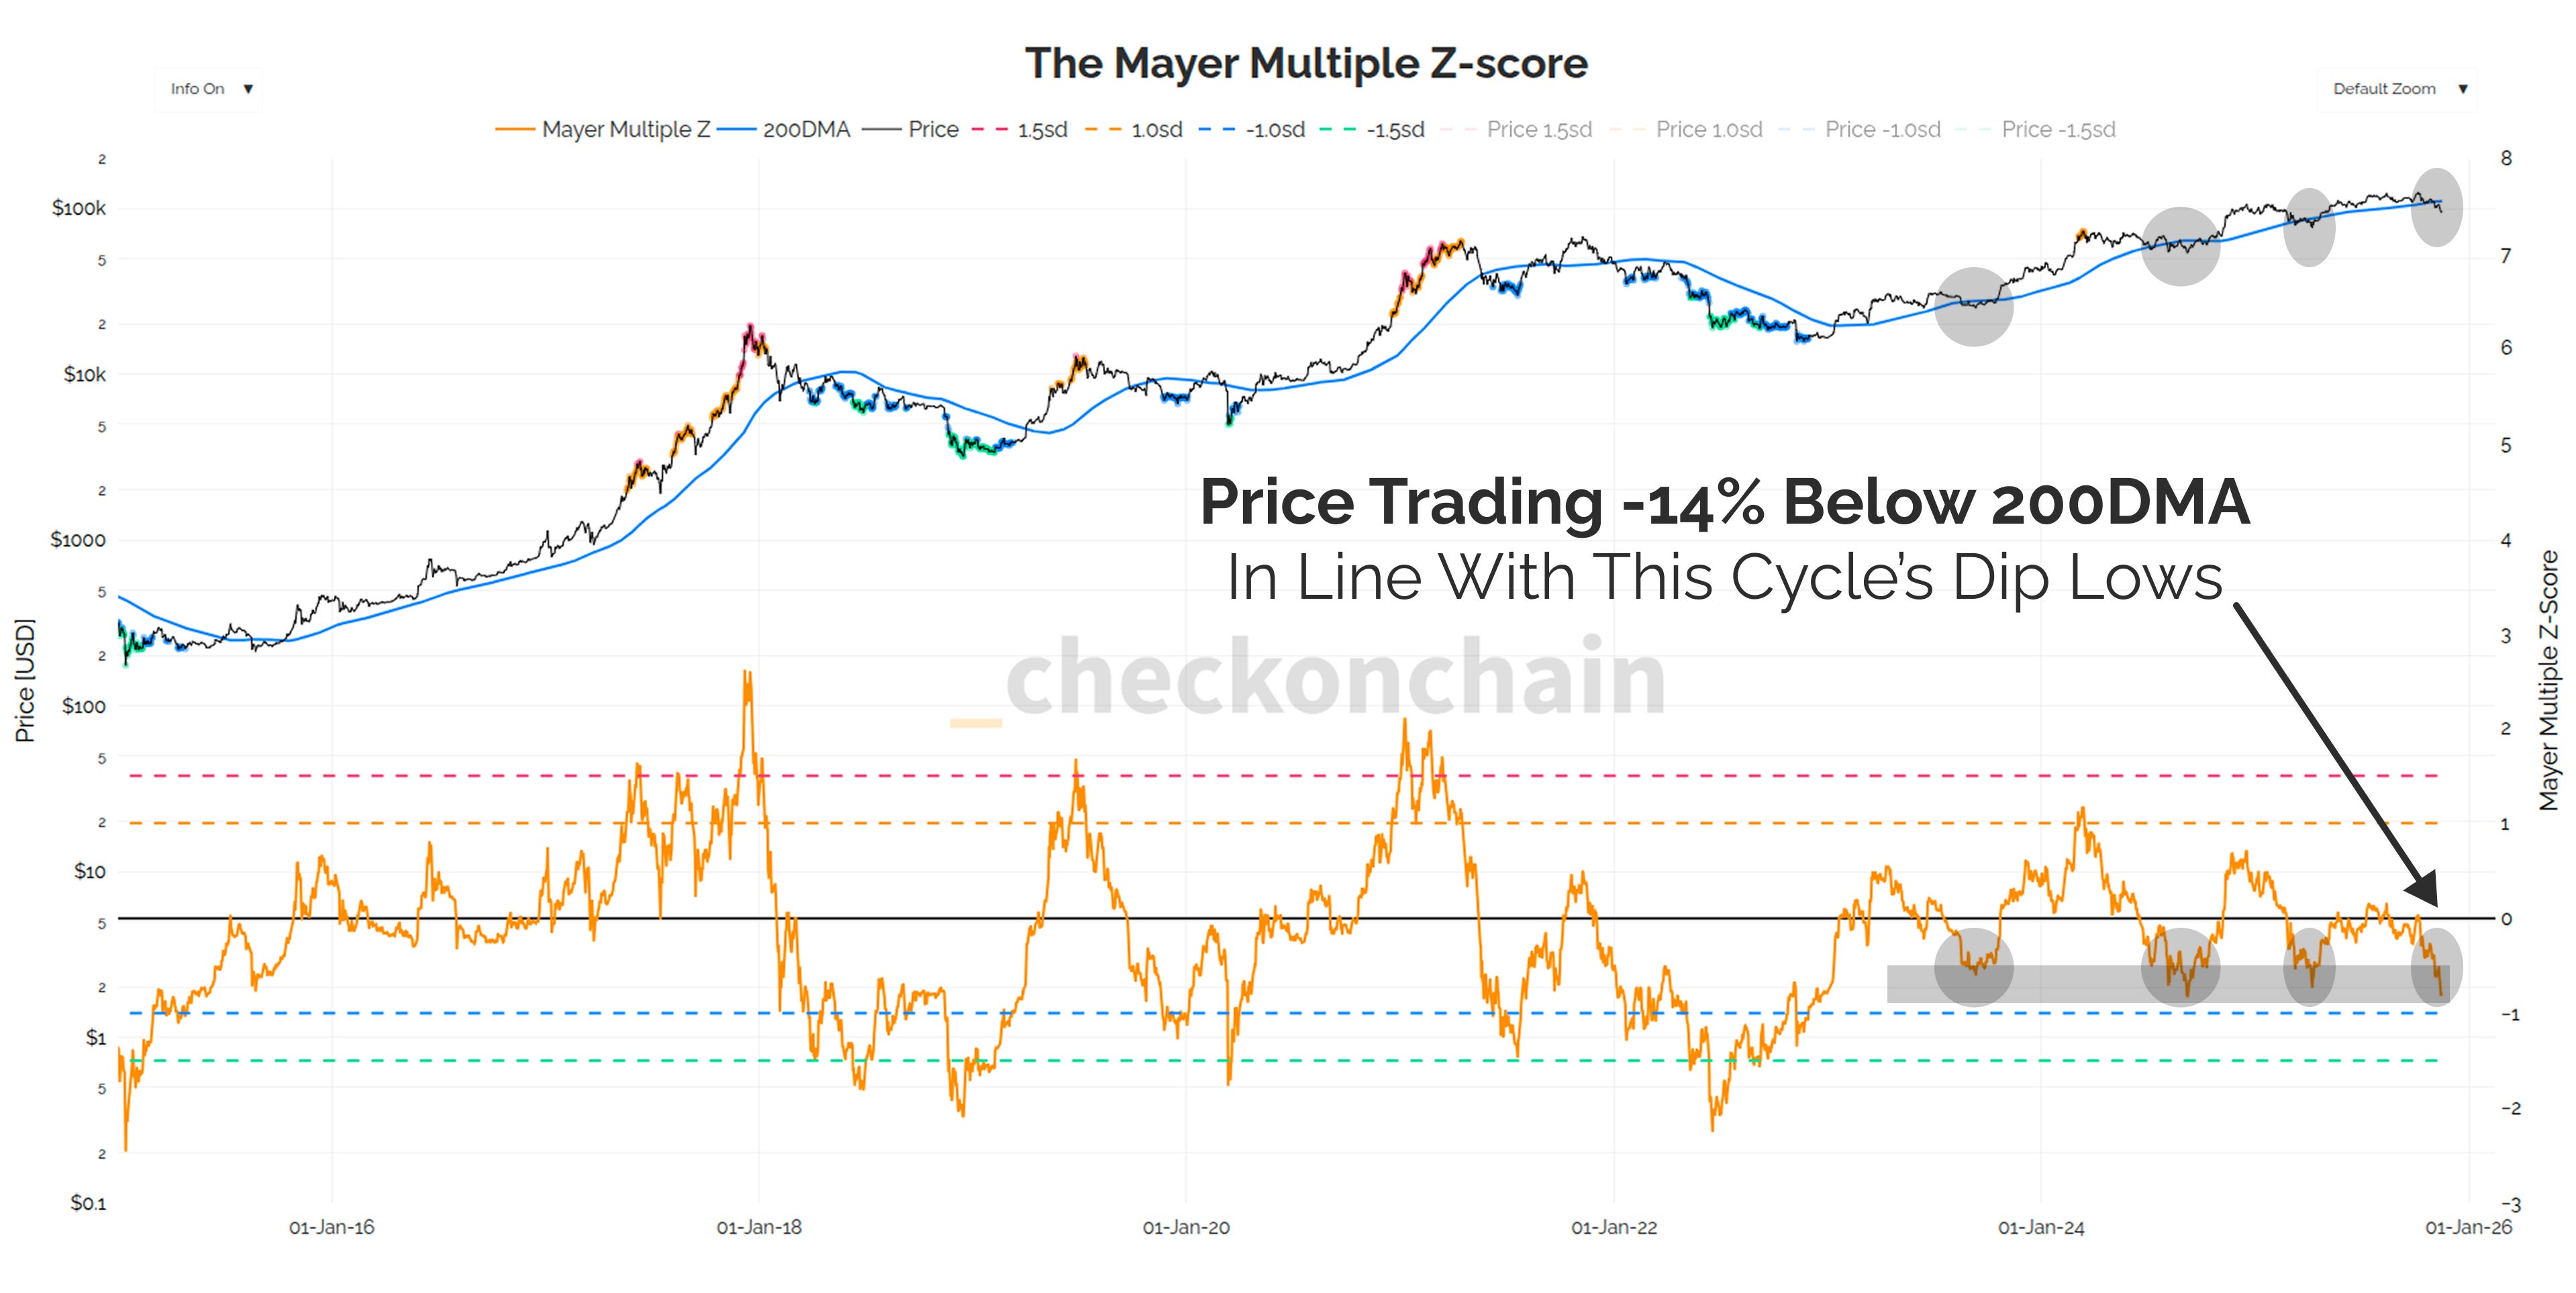
The 200-day moving average is also dead on the Short-Term Holder cost basis at $110.9k, which means the price is also -14% below that level.
Once again, this is THE time for the dip to be arrested, else we enter bear market territory.
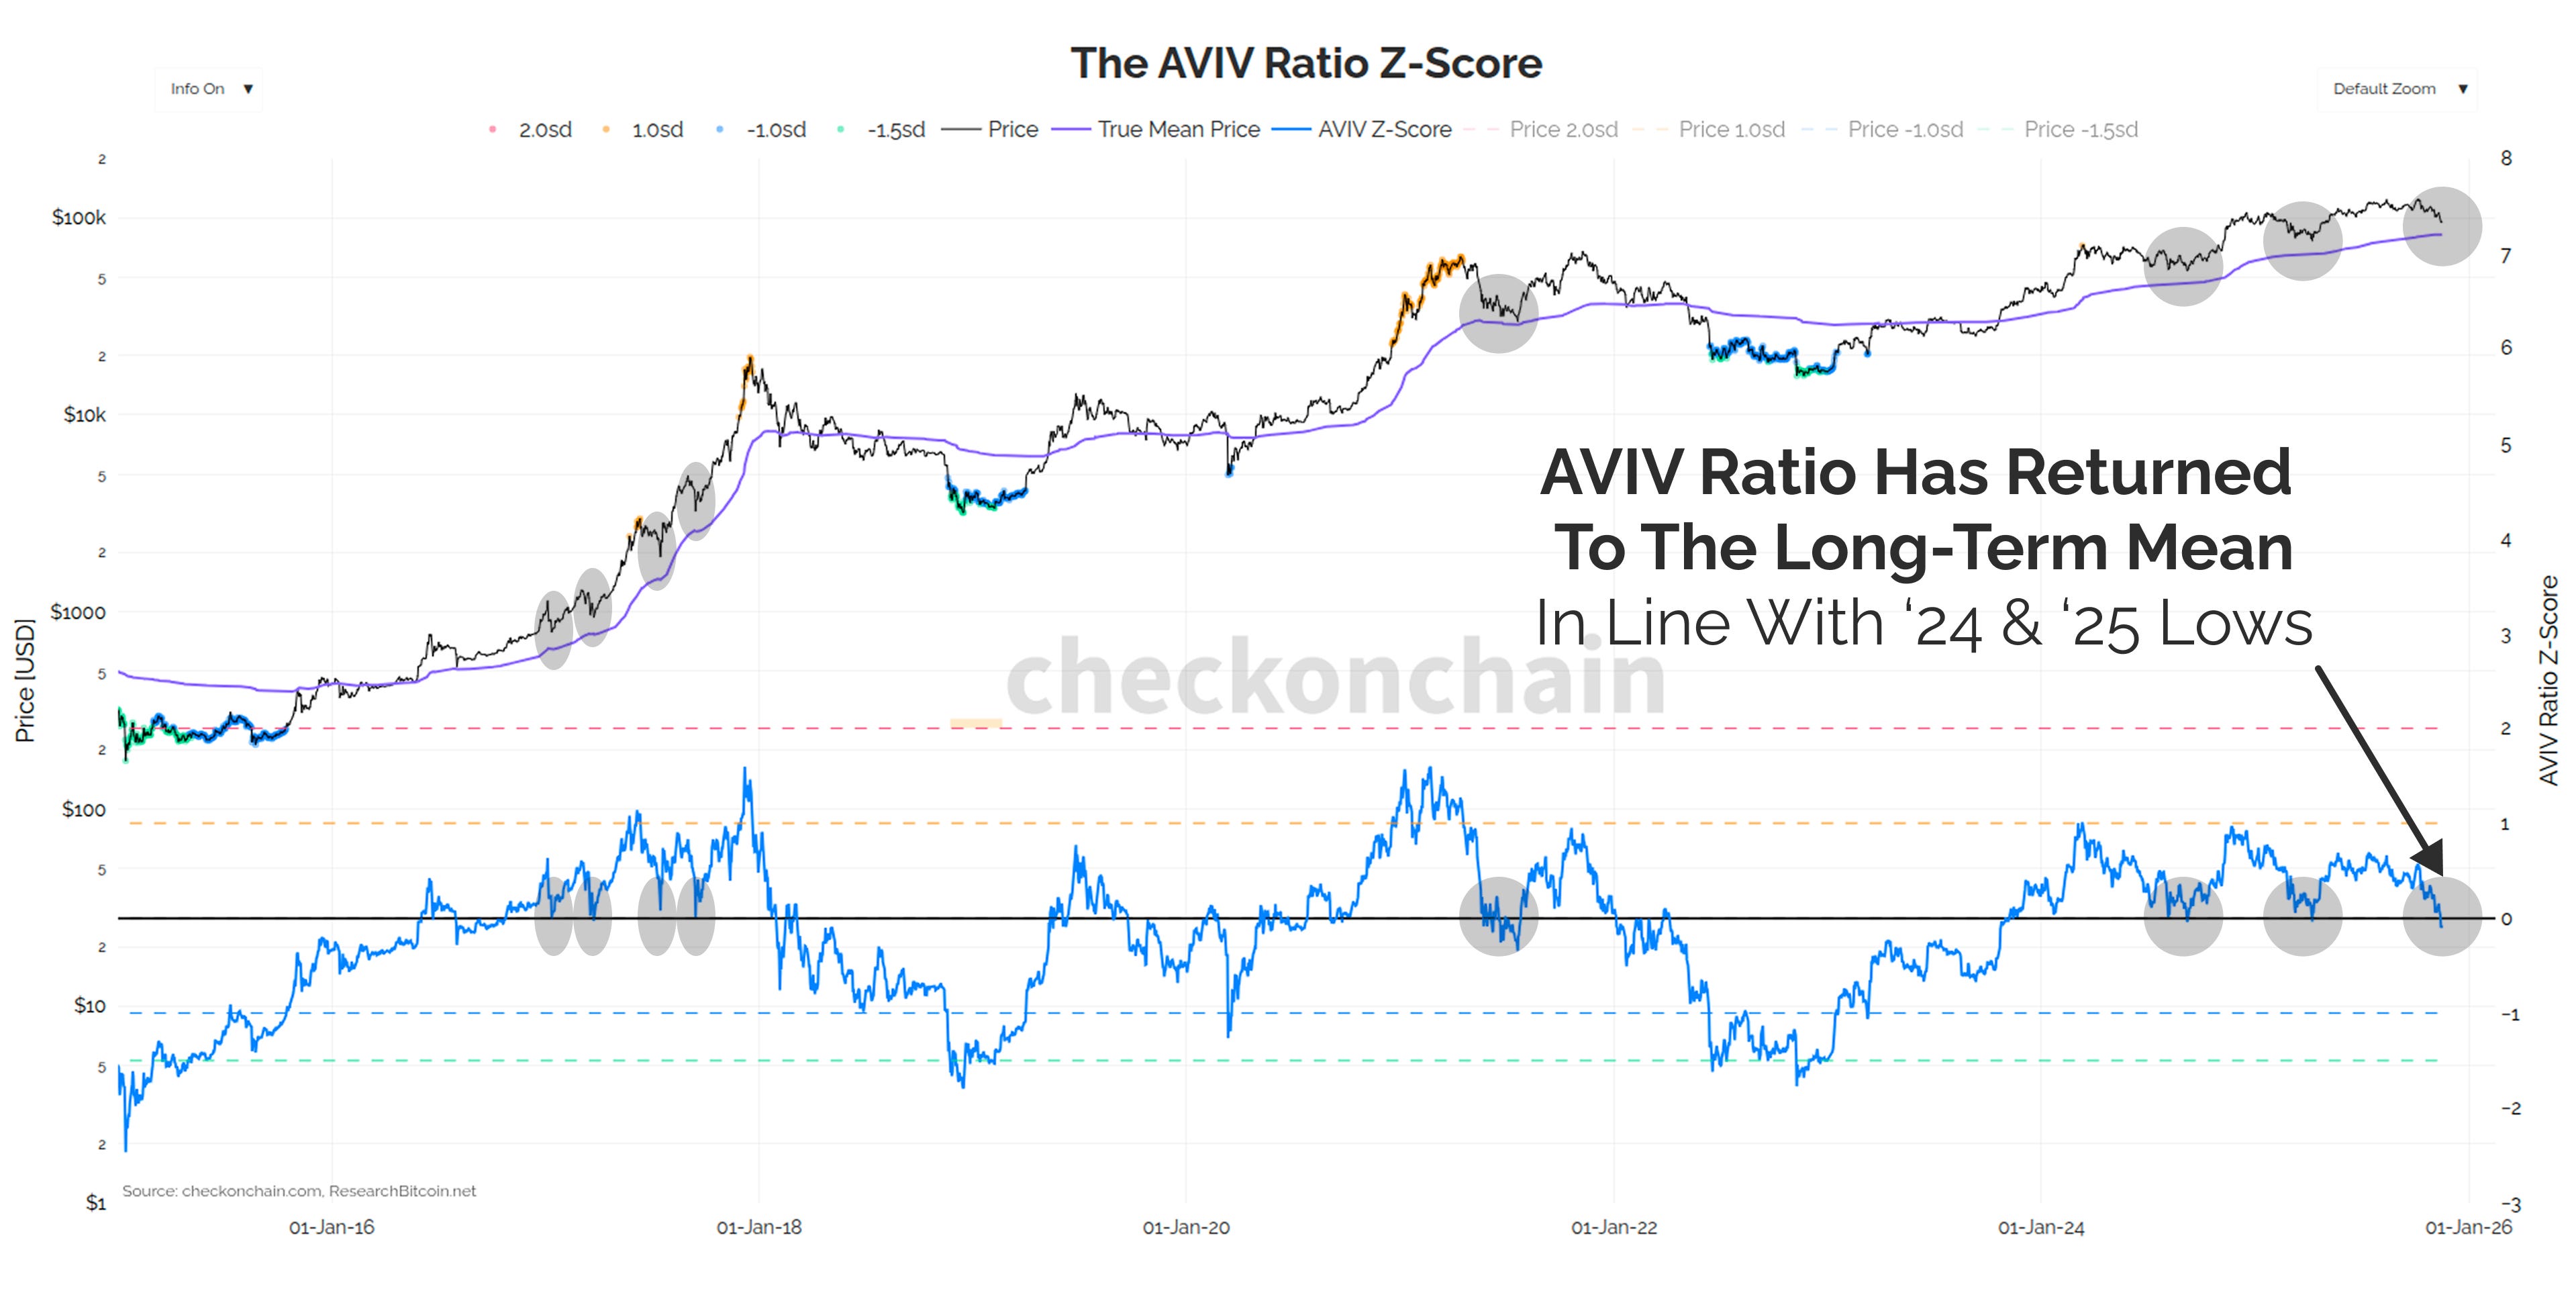
The True Market Mean is, in my opinion, the most effective anchor for the price. David Puell and I developed this onchain price model from first principles in Cointime Economics, where it describes the average cost basis for active investors. It achieves this by discounting long-dormant supply, much of which is lost and therefore cannot respond to market volatility.
Instead, it focuses on active investors, and the supply which is participating in the current market cycle.
All those old coins which have come back to life are automatically accounted for as they are spent onchain.
AVIV Ratio is the ‘MVRV equivalent’ for this price model, and it too has returned to its long-term average value.
It is very obvious that the $95k zone has tremendous amounts of confluence, and frankly, must be defended by the bulls to avoid a proper bear market.
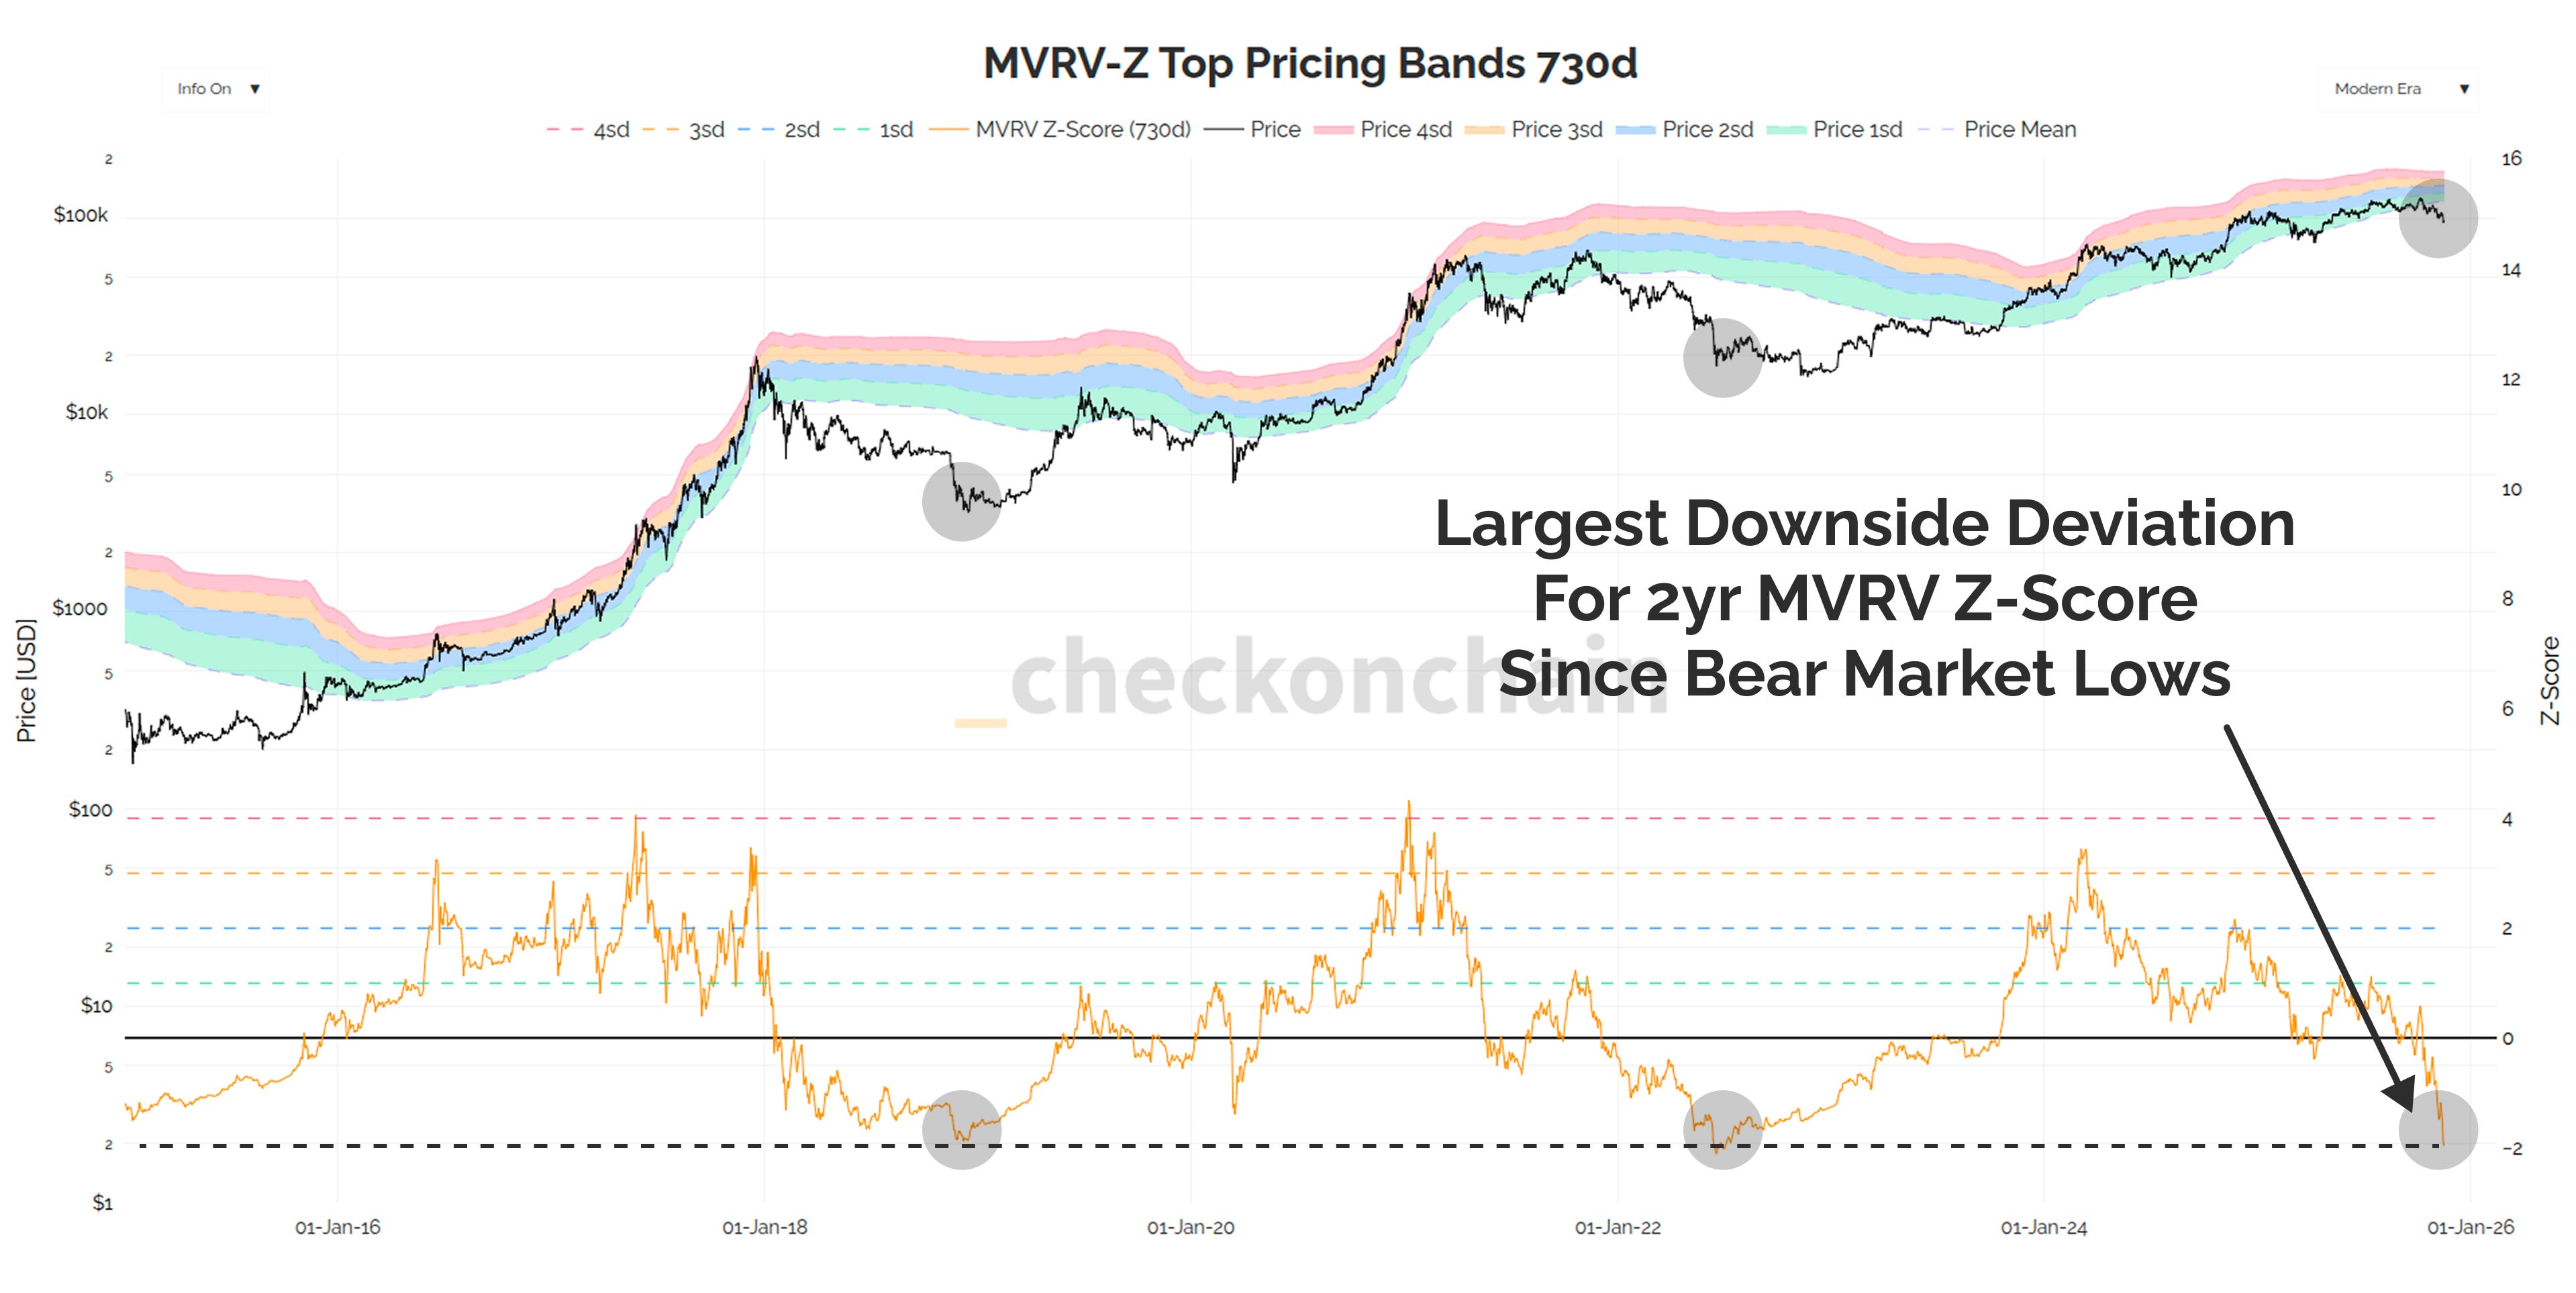
Lastly on this topic, the 2yr MVRV topping clouds was highlighted in the Checkonchain chat as having reached literal bear market bottom levels.
Now, these topping clouds are one of my attempts to model bull market conditions, and the goal is to compare the average profit multiple held today, to the average over the last 2yrs. In other words, I am comparing bull market conditions, to bull market conditions.
Therefore, the interpretation of this is one of the following are true:
This is the most oversold condition in a bull market EVER.
We’re no longer in a bull market, and this has been one of the fastest transitions into a bear we have seen.
If the market does not bounce here, then I believe the only sane conclusion is the second bullet point.
No matter which indicator or tool I look at, this $95k price range is THE PERFECT SPOT FOR THE BOTTOM TO FORM…and therefore if it does not form, then we’re no longer in a bull market.
How Have Investors Responded?
We now have a pretty simple market thesis on our hands:
If defend_95k == True:
   market_condition = 'we're so back'
Else:
   market_condition = 'it's so over'
Any analyst or investor worth their salt is likely running this code right now, so we can now look at metrics which describe how people are behaving.
In my view, the next week will be highly instructive, as we will find out just how serious the bulls are about keeping the party going.
We either recover strongly and never look back, or the price will start painting a bear flag, triggering more people to de-risk and back away for a while.
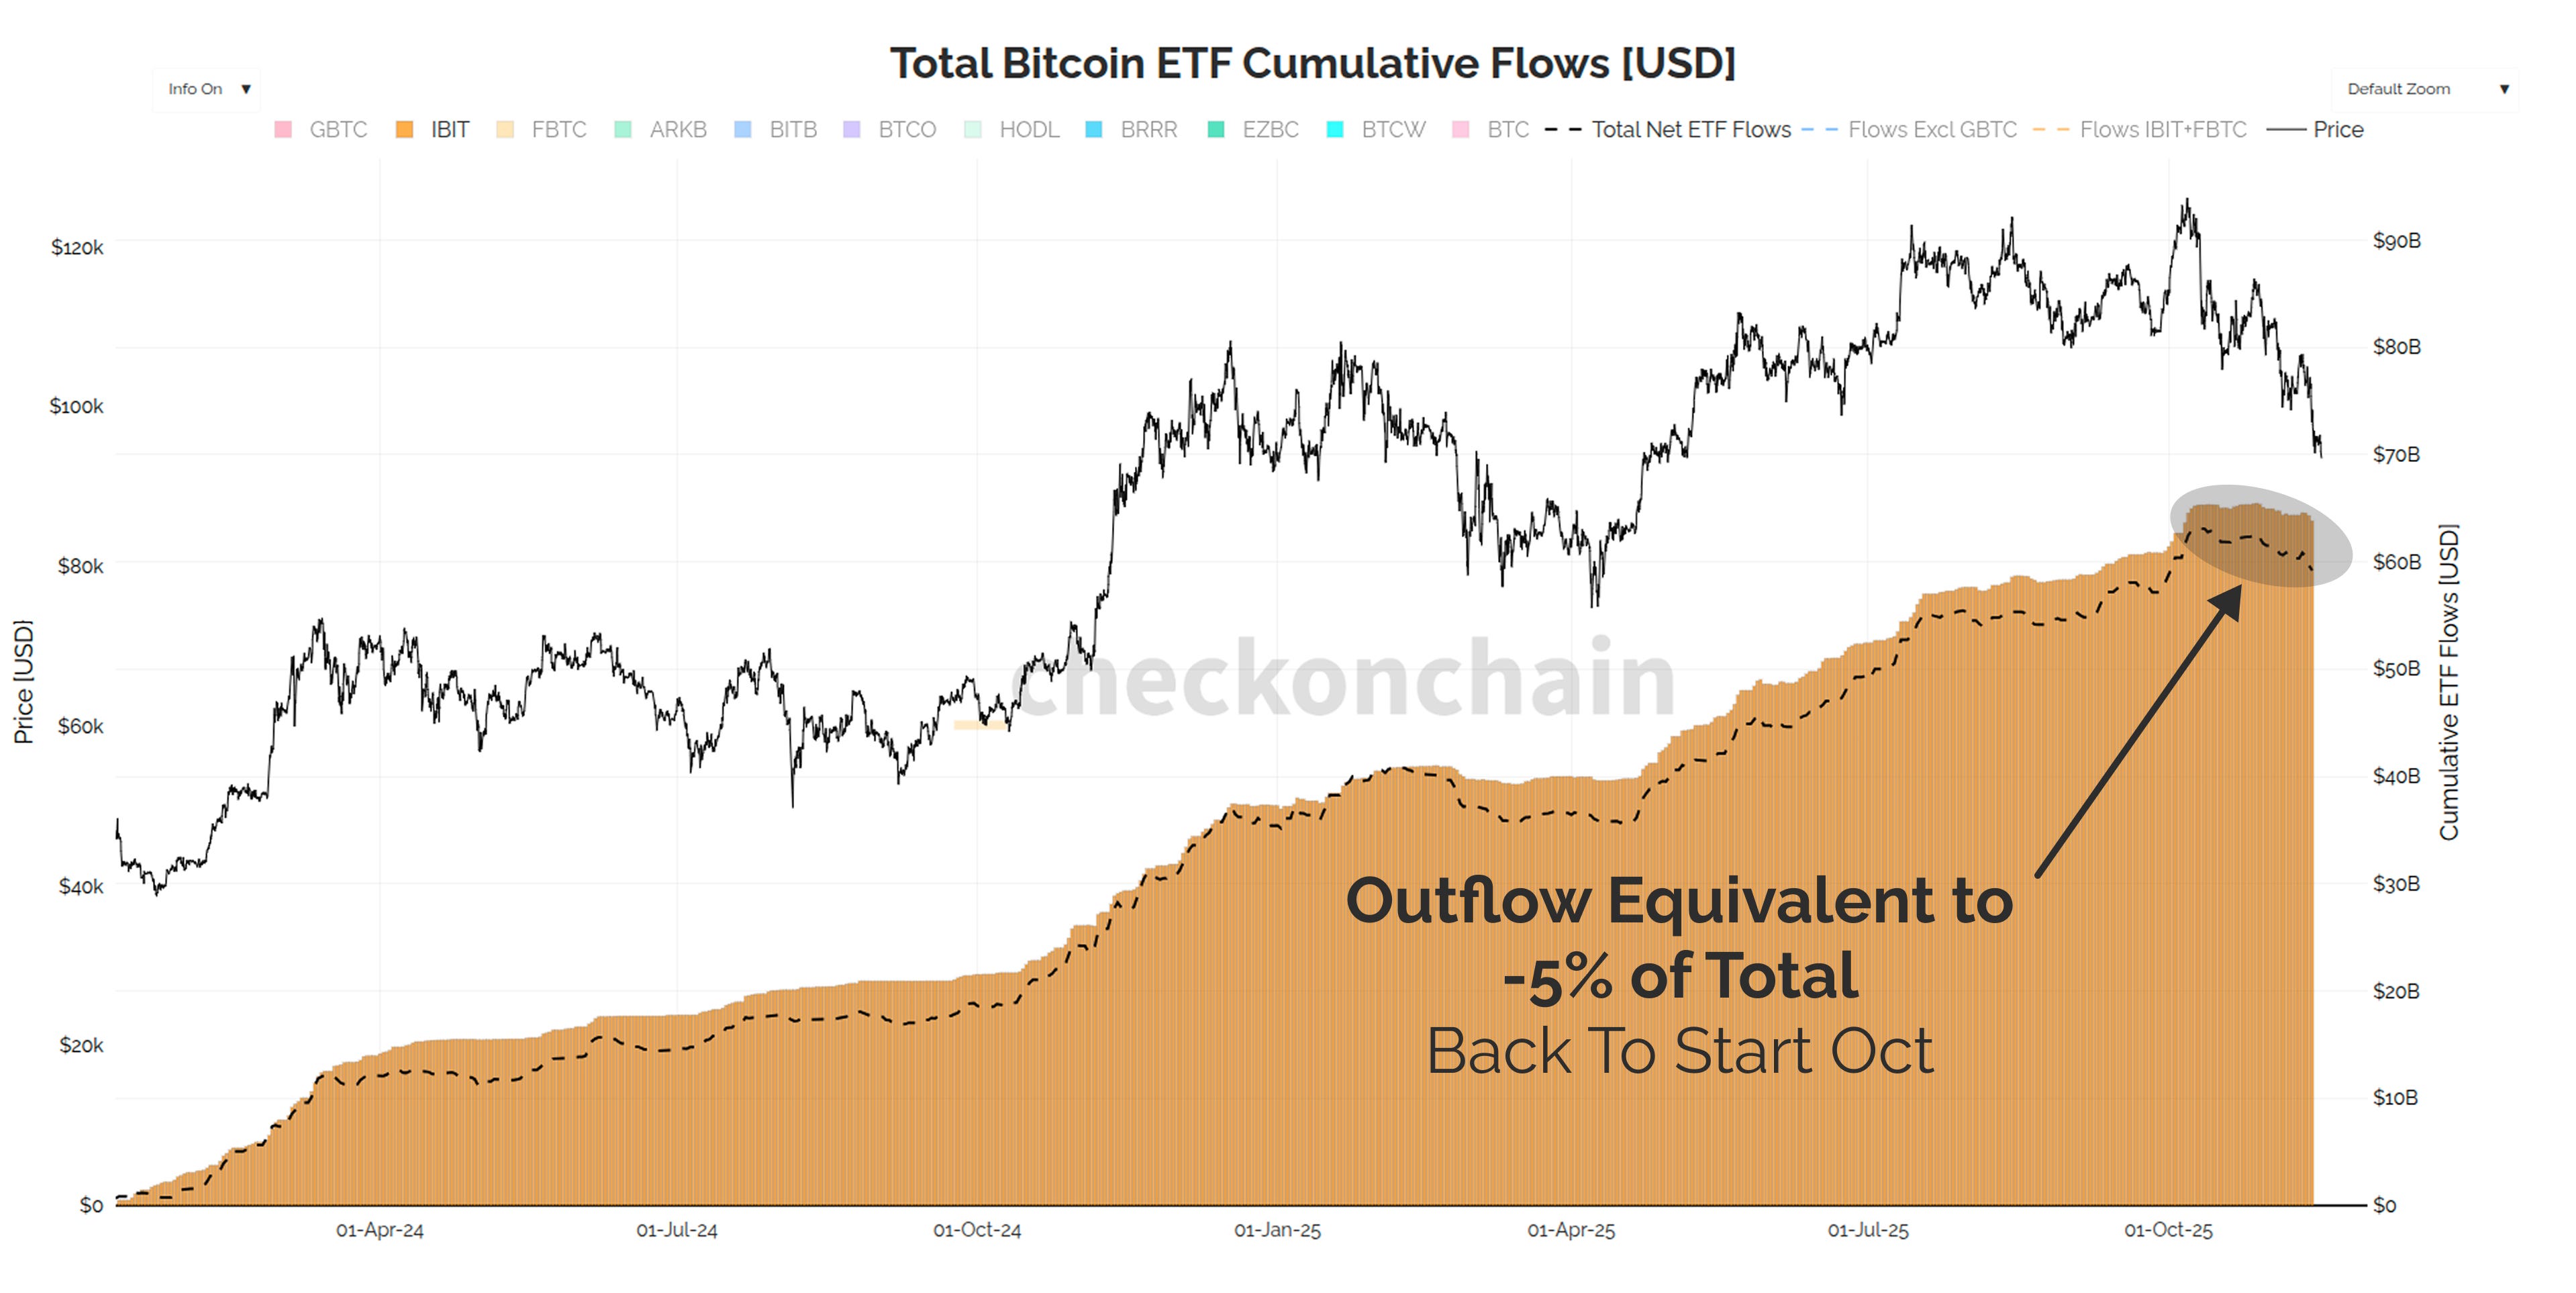
The ETFs have seen $3.1 Billion worth of outflows over the last three weeks, which undoes all the inflow volumes since the start of October.
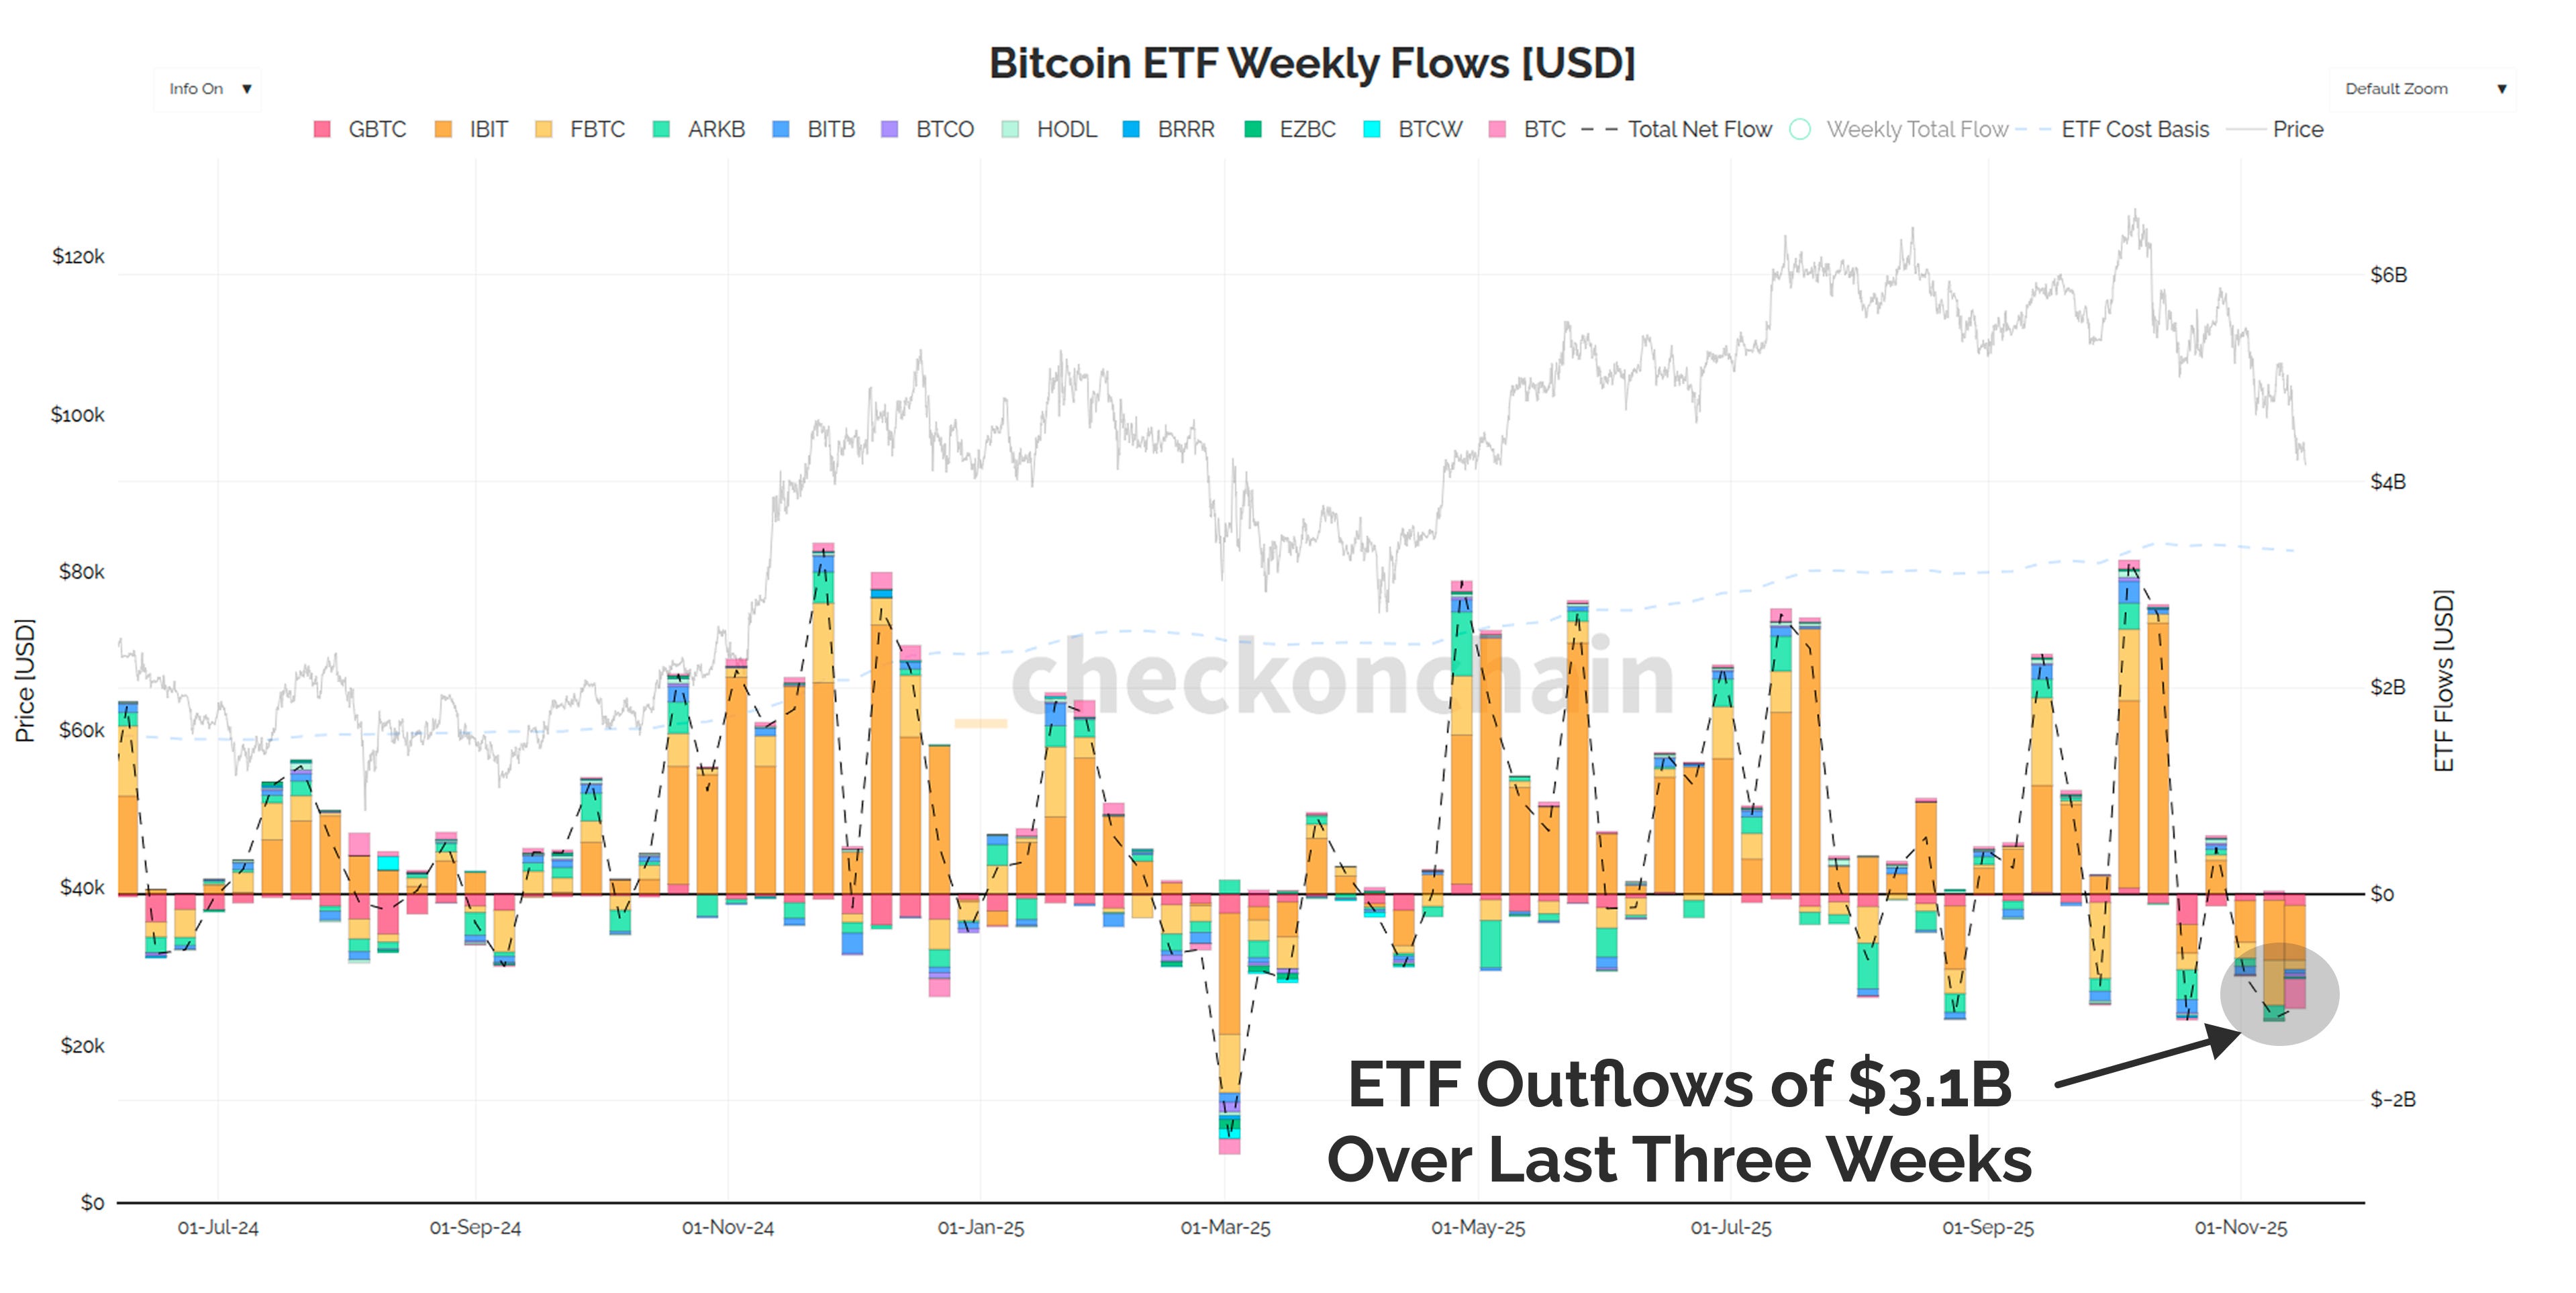
The total outflows over the last three weeks is around -5% of the total we have seen to date, which is meaningful, but not enormous. I honestly expect larger outflows this week, so this is smaller than I would have anticipated.
The ETF investors, surprisingly, are not the dominant seller weighing on the price in my opinion. They may become a dominant seller, but we will have to see how they behave this week in particular.
My thesis for some time has been that the ETFs are a primary vehicle for 'DCA style passive investors, and my instinct tells me this is likely to continue.
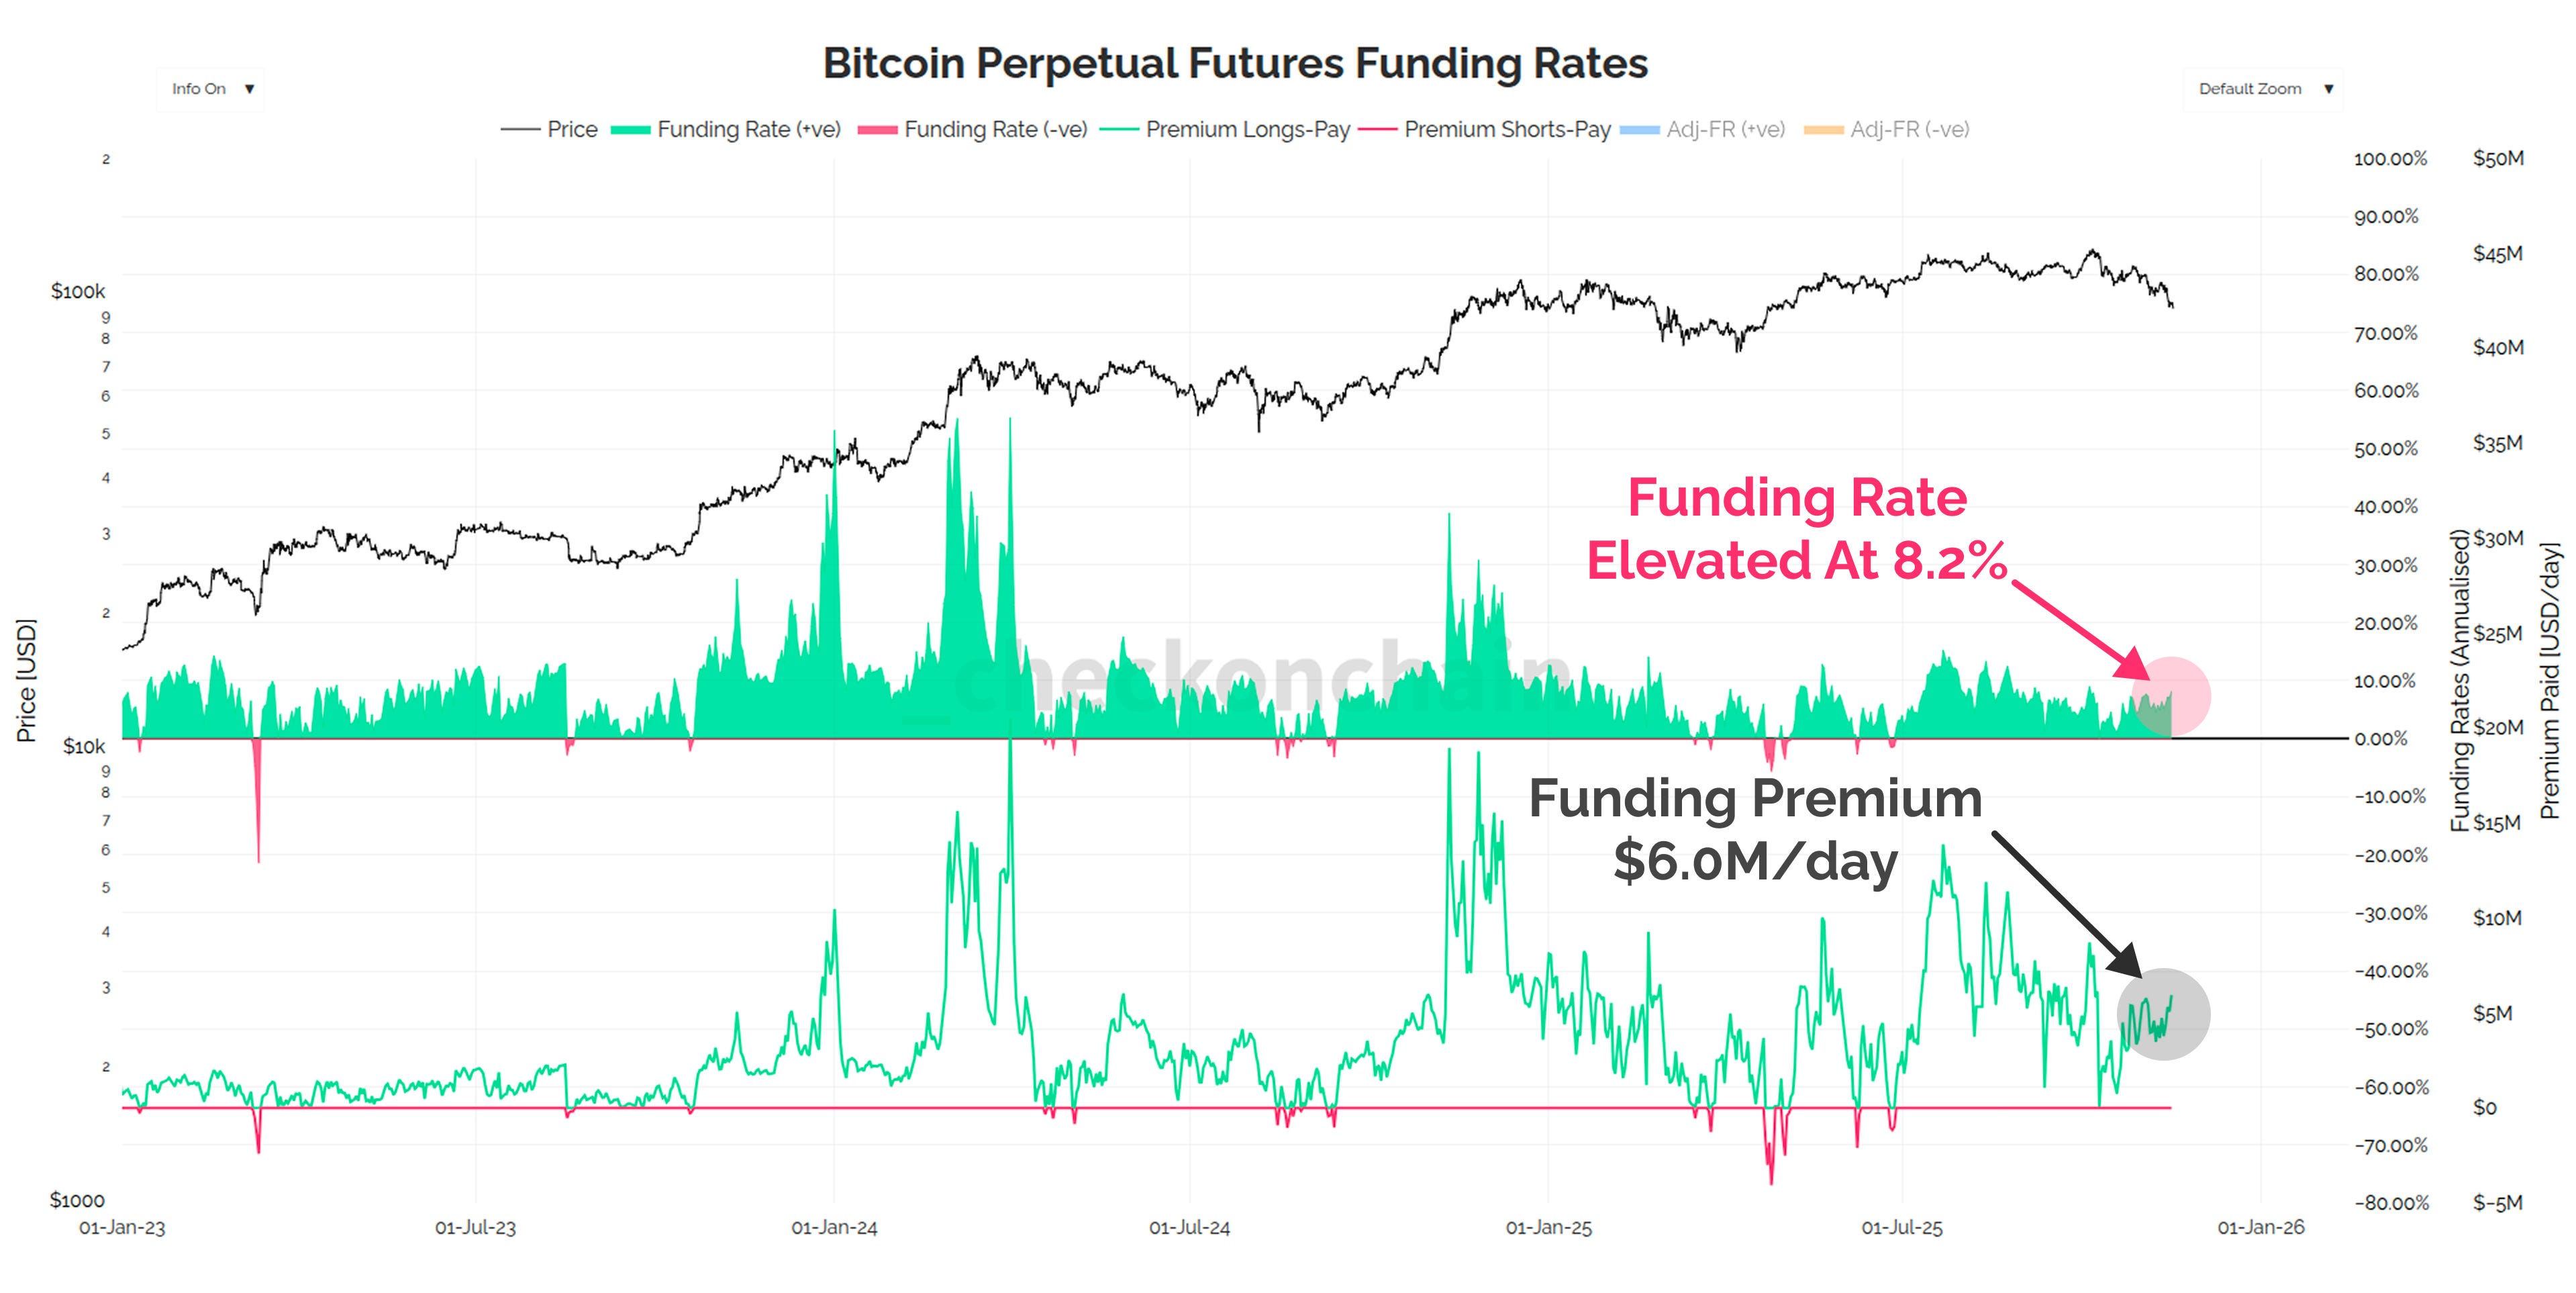
In the bad new bucket, we have degenerate futures traders levering up, and trying to buy the bottom…
Funding rates have ticked up to 8.2%, and the daily premium paid is in an uptrend, tagging $6.0M per day.
This isn’t what we want to see if I am perfectly honest.
Long-liquidations are also spiking higher, and remain dominant.
People are trying to catch a falling knife with leverage, and I think we all know how this plays out for them.
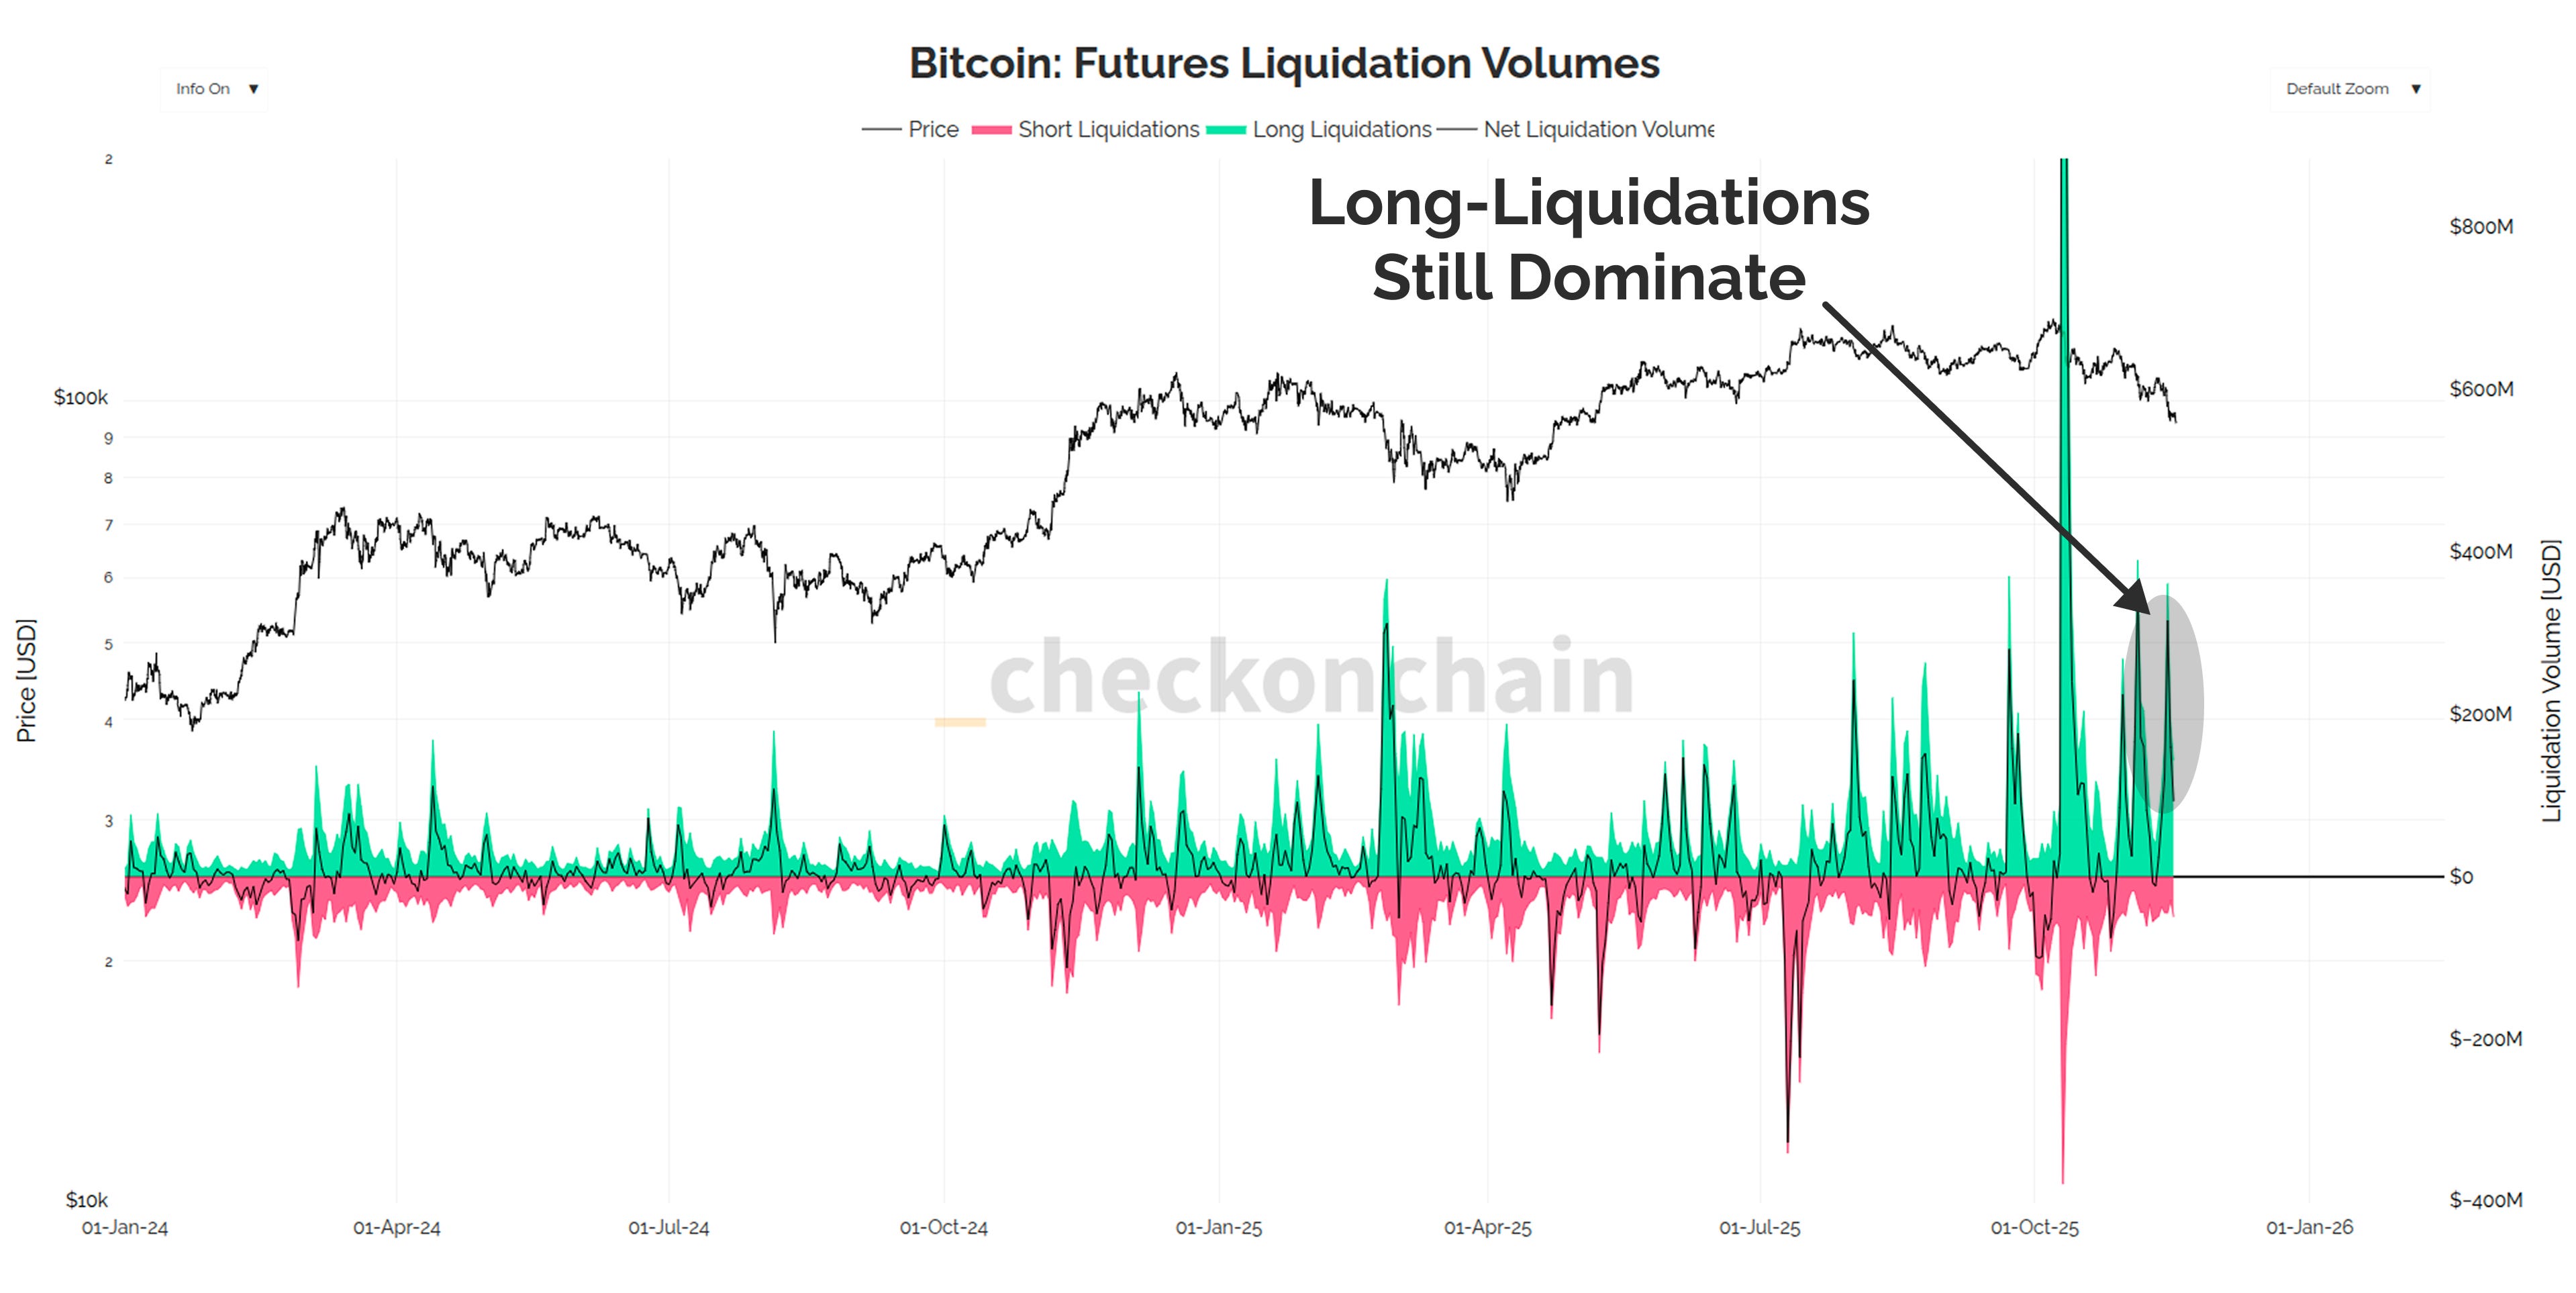
Not well, in case that wasn’t obvious.
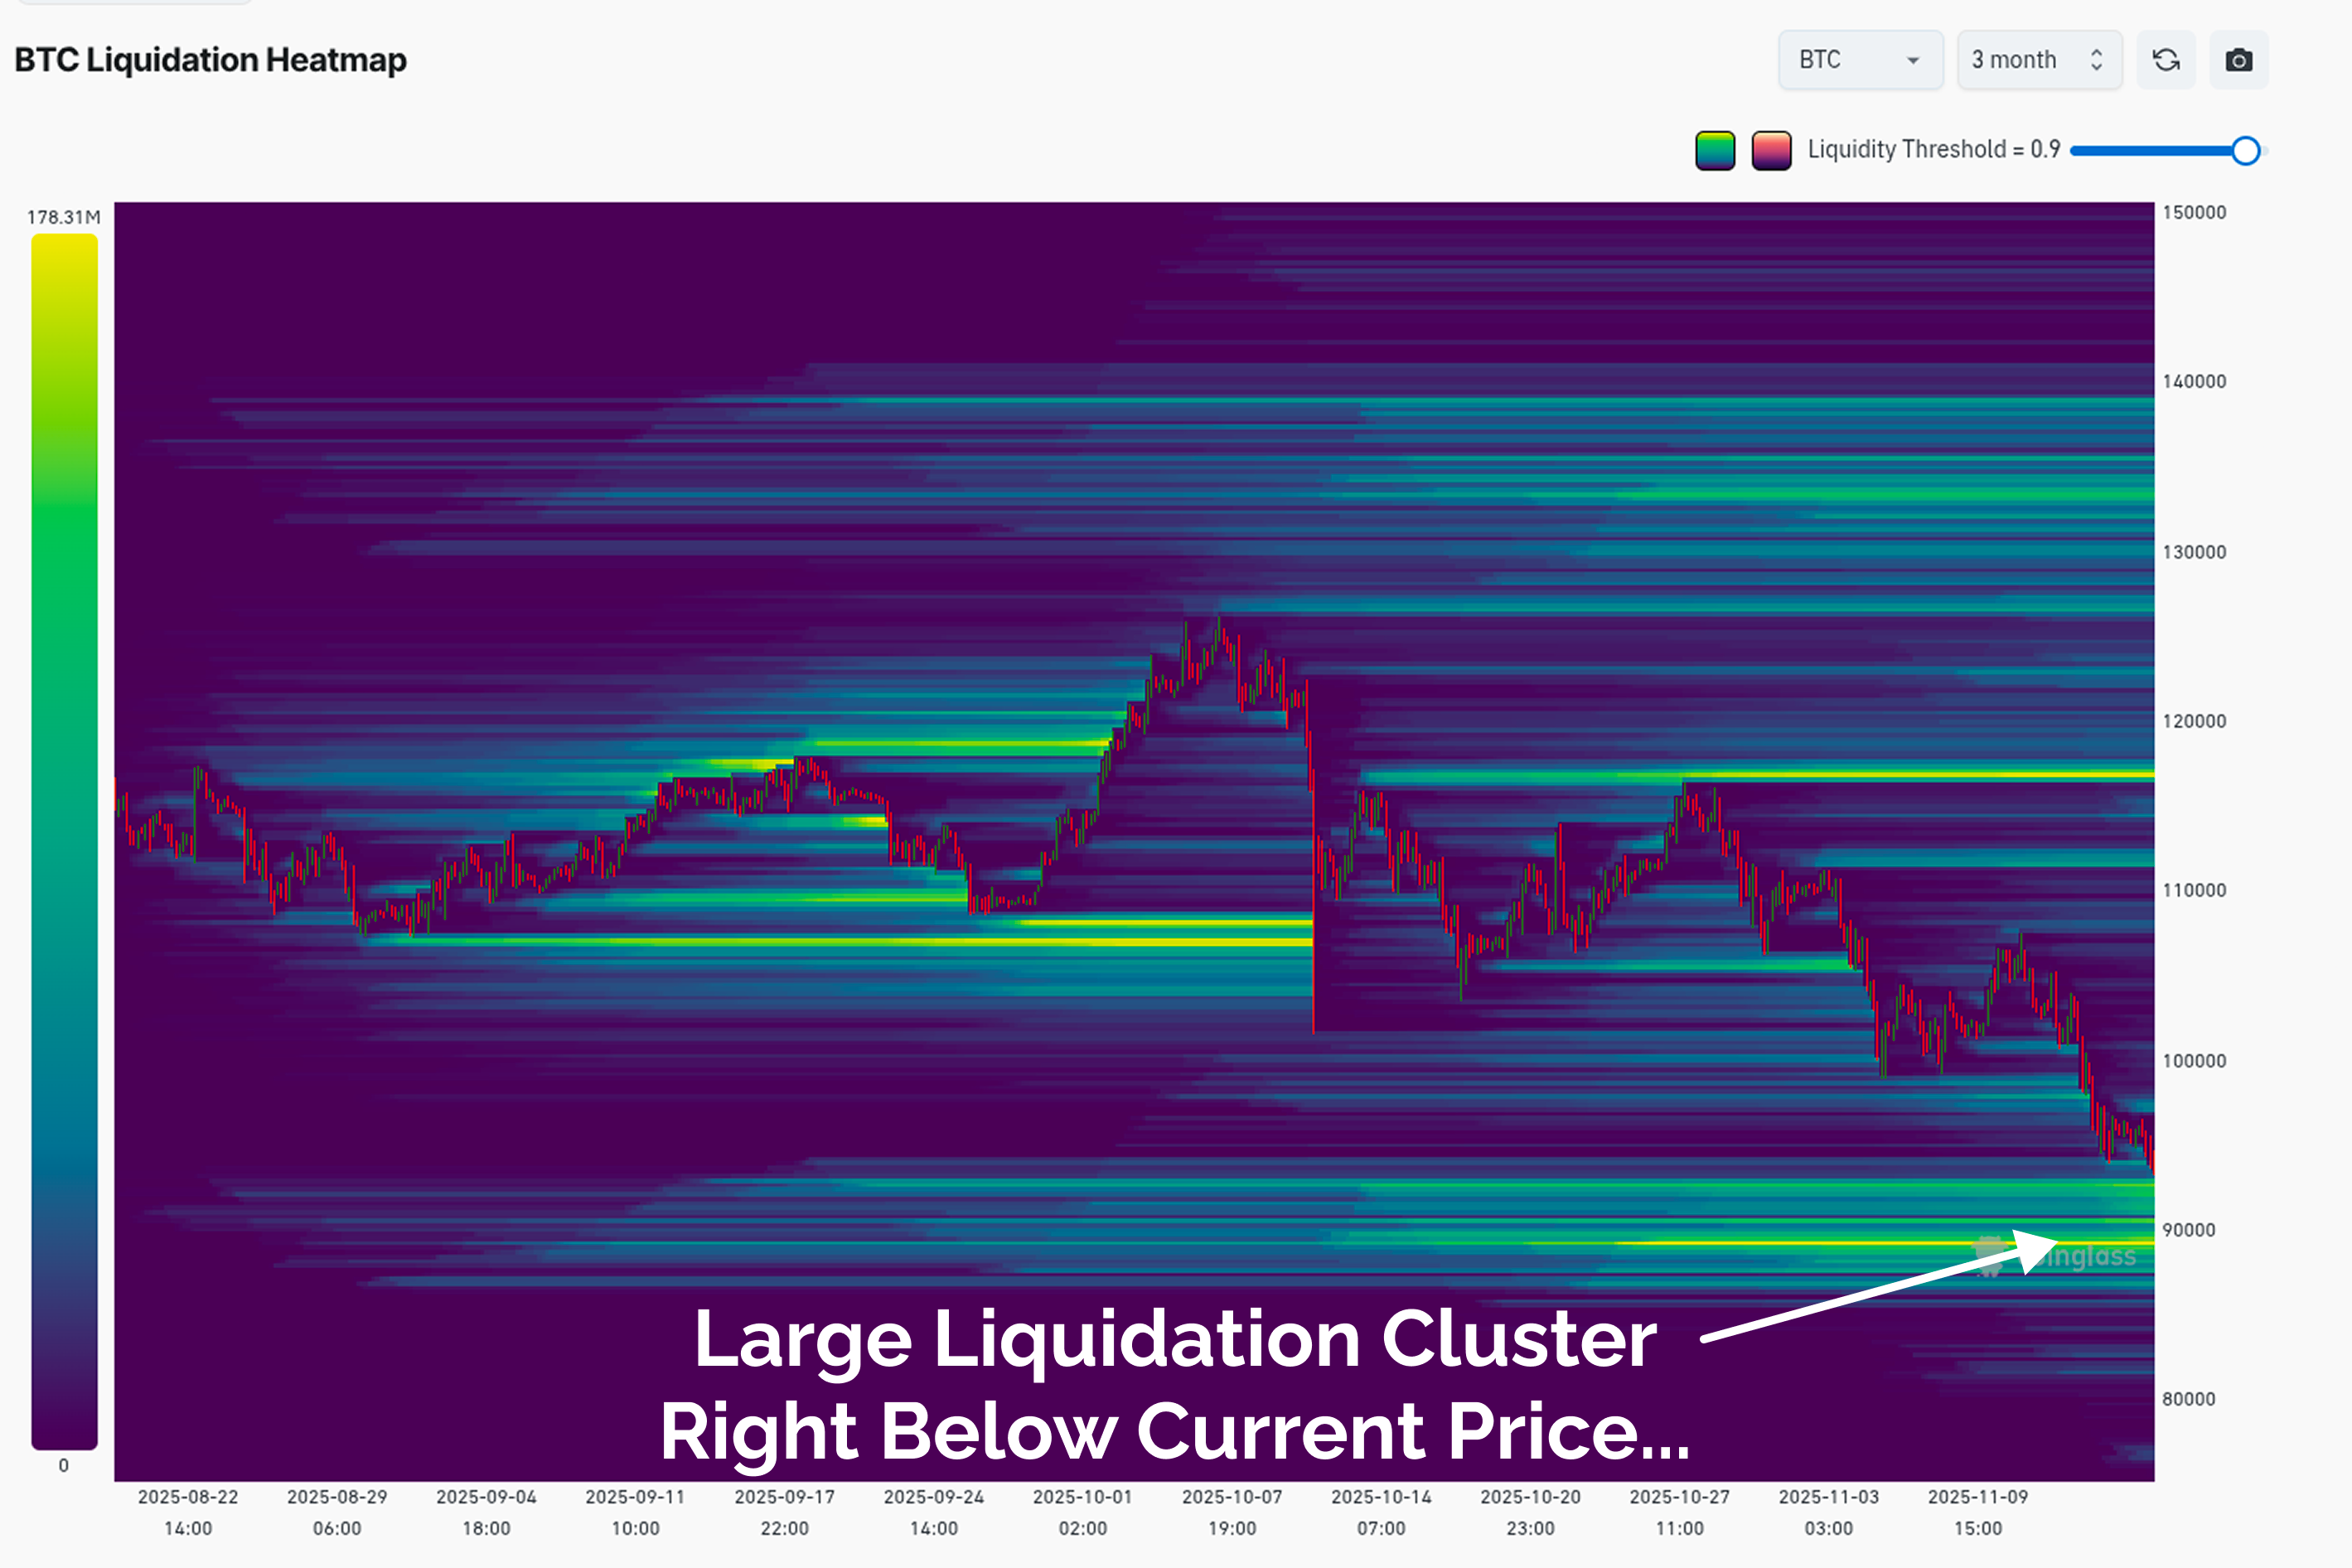
Right below us is a very large liquidation cluster centred at $90k, and I suspect there is a good chance we take it out.
Check the HODLer: This has my attention.
If the price trades down to $90k…it will likely trigger a massive liquidation cascade, that probably takes us down to maybe $85k?
I know this sounds crazy to say, but that will be a price wick I would be willing to stack sats during. Sure, it could be the first day of a hairy ass bear, but it could also be the final flush we need to clear all the degenerates and tourists from the market.
The best case scenario would be a nasty red candle, that gets entirely gobbled up, forming a massive ‘hammer’ price candle. This could result in a slingshot back to the upside (which is by no means the end of the ‘bear’, but certainly isn’t an expensive place to DCA).
Are The Sellers Running Out of Coins???
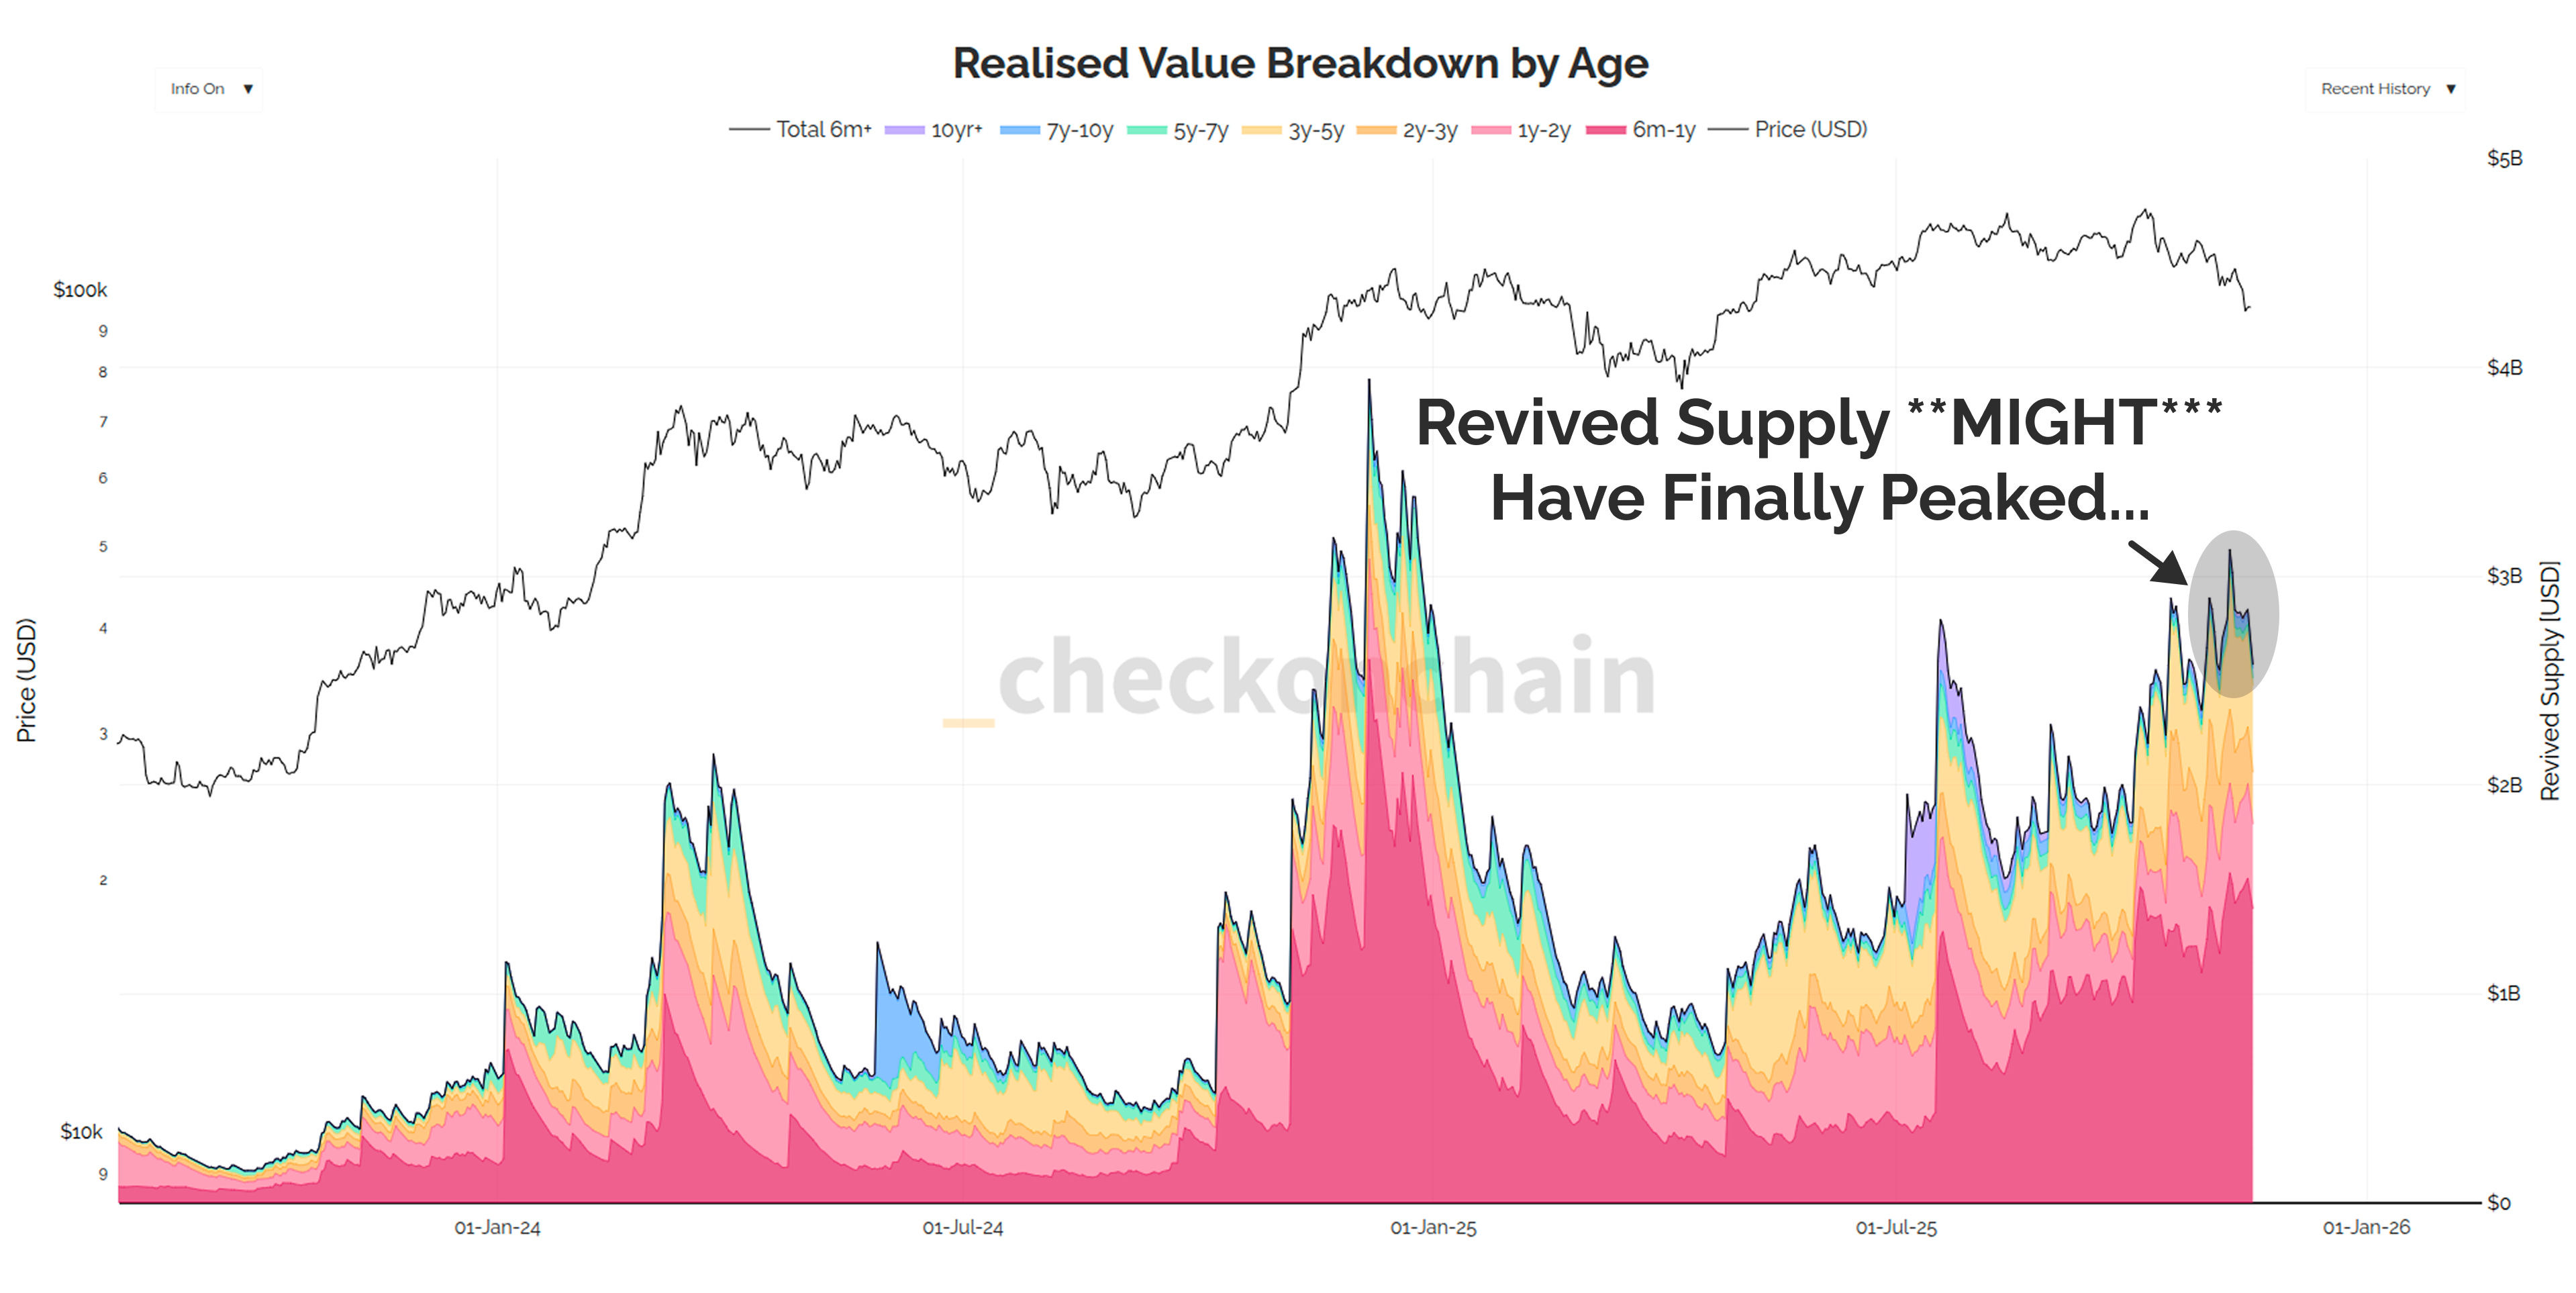
It’s still far too early to make a definitive call here, but it is quite likely that revived supply has probably topped out at this stage.
Whilst long-term Holder distribution has been a major headwind and factor driving recent market weakness, even my dog knows that $95k is no longer a favourable price to take profits at.
What I expect happens on the road ahead, is we see profit taking slow down, and the market will start slowly digesting the massive volume of old coins that have already come back to market.
Markets are a process, not a result, and it probably takes some time to work through the many months of sell-side that has already occurred.
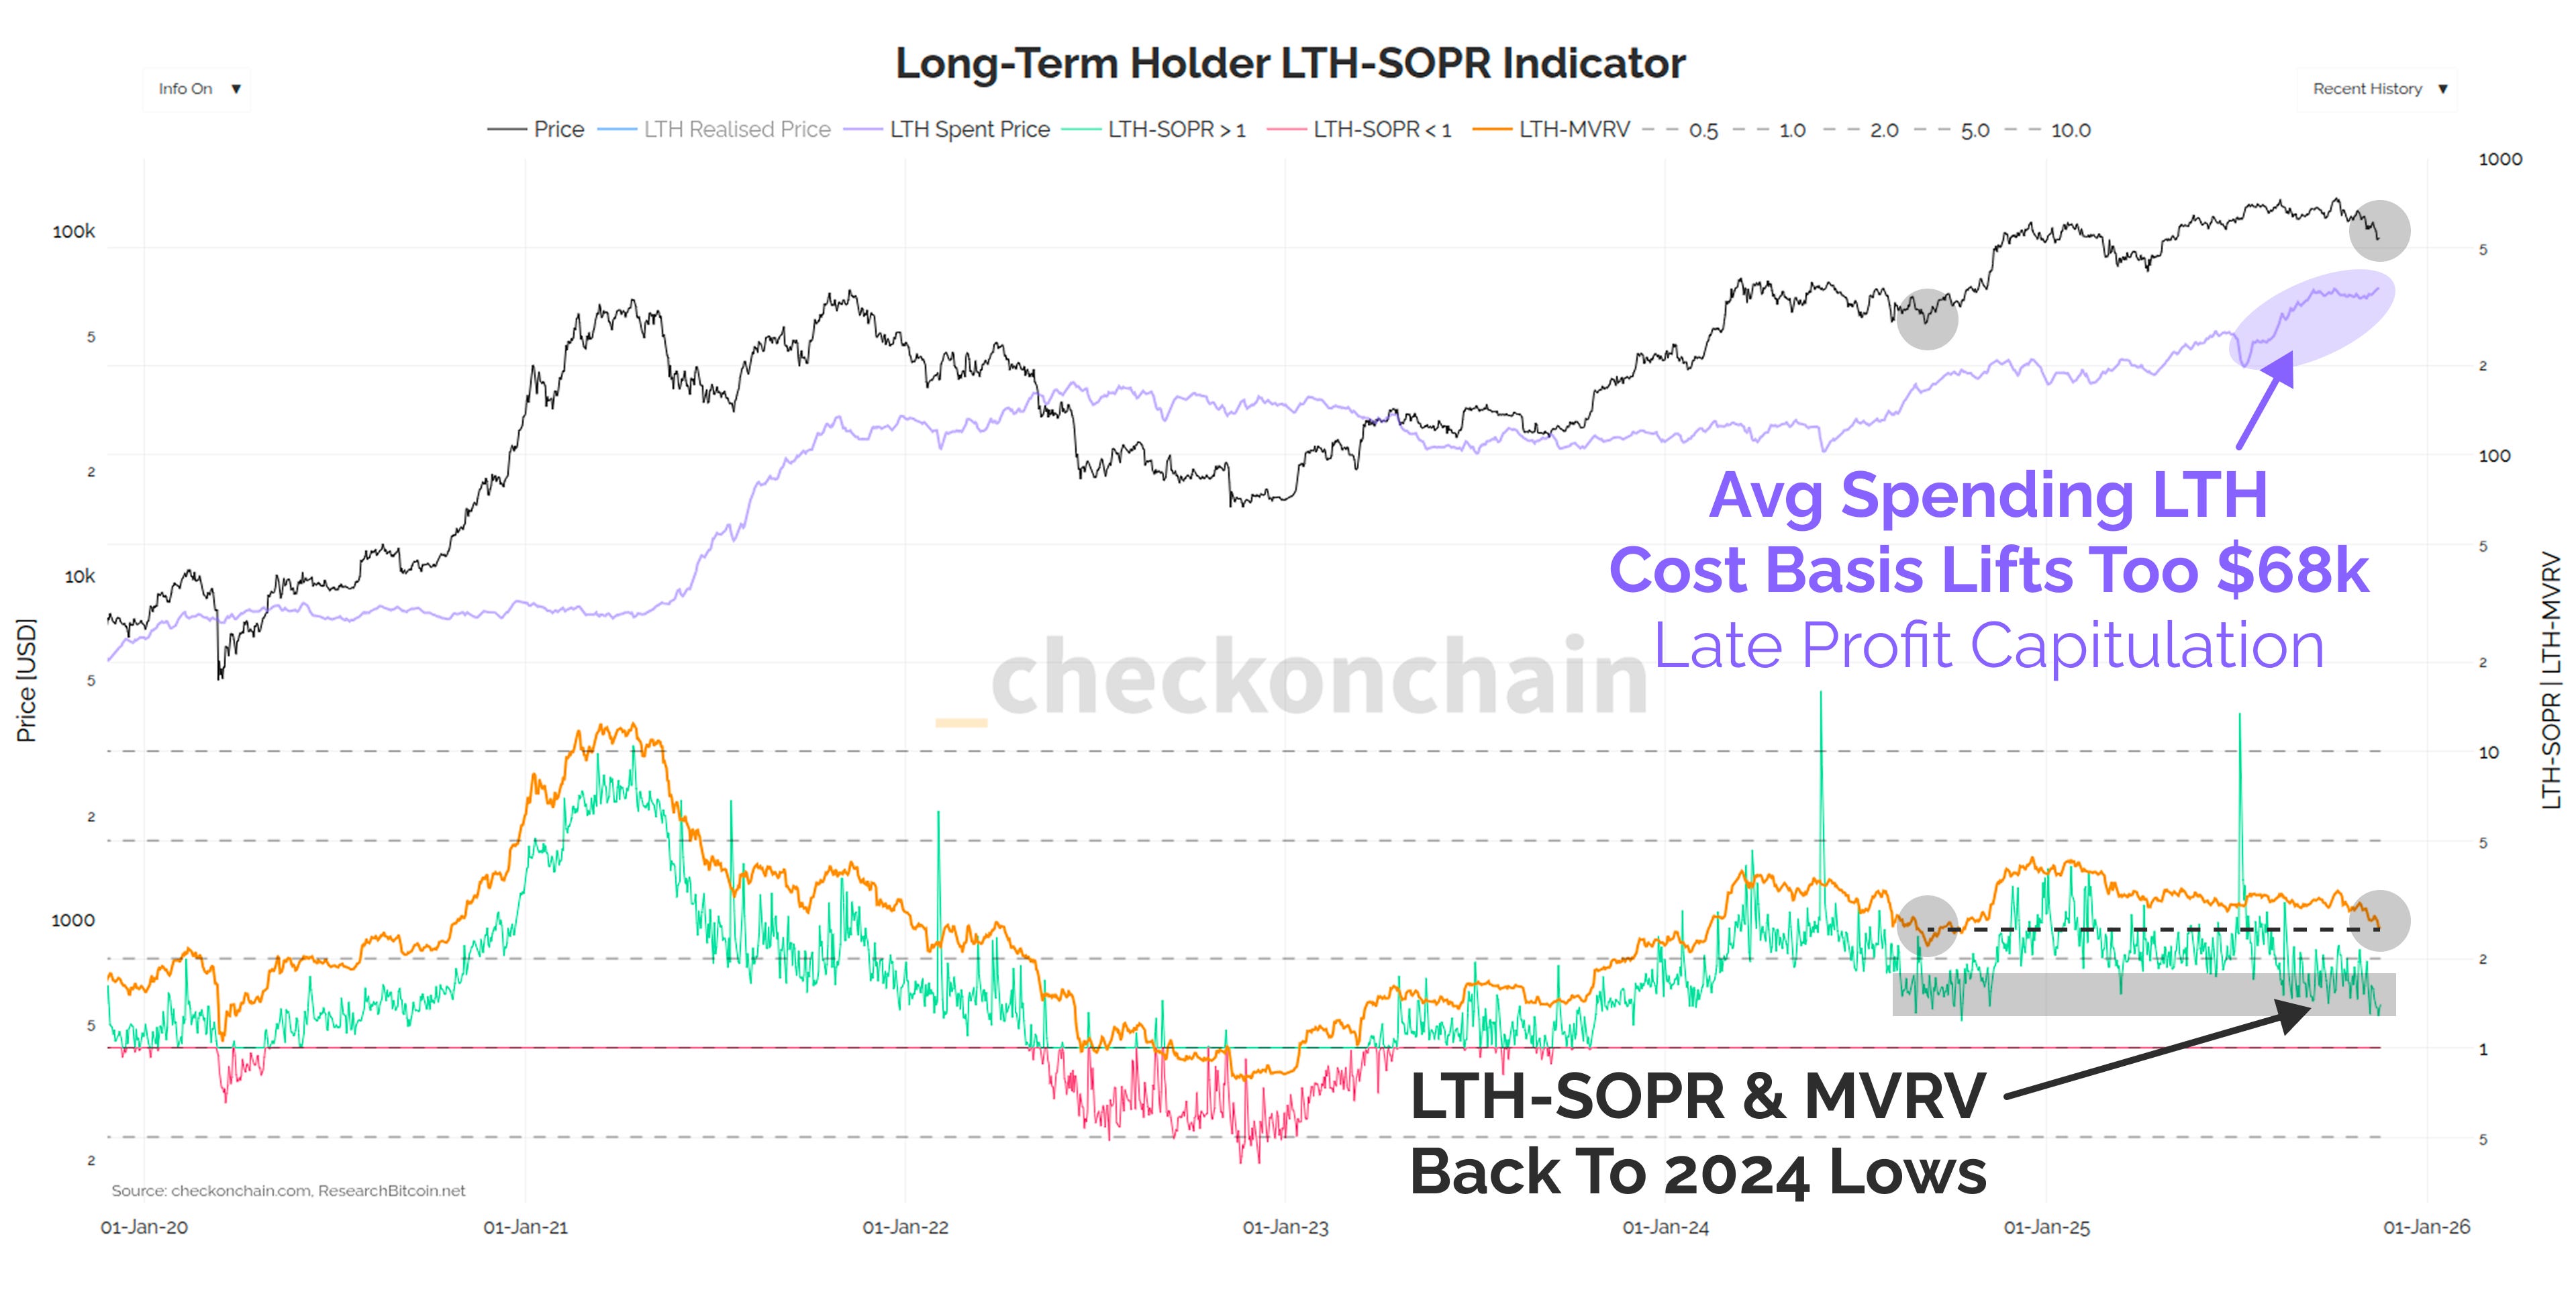
What we are starting to see is the ‘least experienced’ long-term holders starting to take profits.
Smart money LTHs know when the market is hot, and sell expensive coins near the peak. This has been the dominant source of sell-side pressure in 2025, as we’ve covered ad-nauseam in prior reports.
Not-so-smart money LTHs have been watching the price, fearful, and getting increasingly scared. They didn’t have the conviction to sell near the highs, and are now starting to take ‘panic-profits’ now that the price is scary and red.
This second cohort is now starting to be a larger component of the sell-side, which is actually more of a late stage dynamic during drawdowns. It is causing the average price of spent LTH coins (purple) to drift up towards $68k, which means the average selling LTH is barely locking in a +40% gain.
Whilst there is nothing wrong with de-risking, the right time to de-risk was BEFORE we got down to the Bulls Last Stand.
Check the Analyst: At global bear market bottoms like FTX in Nov-2022, Mar-2020, and at the end of the 2018 bear, we often see losses locked in by STHs and LTHs, but also profits by LTHs.
This three way capitulation shows that we have hit maximum fear, because even the guys who are in profit are panicking about it going lower. It’s too early to tell if we’re at this stage just yet, but it’s a dynamic worth highlighting, as we will get to see this eventually.
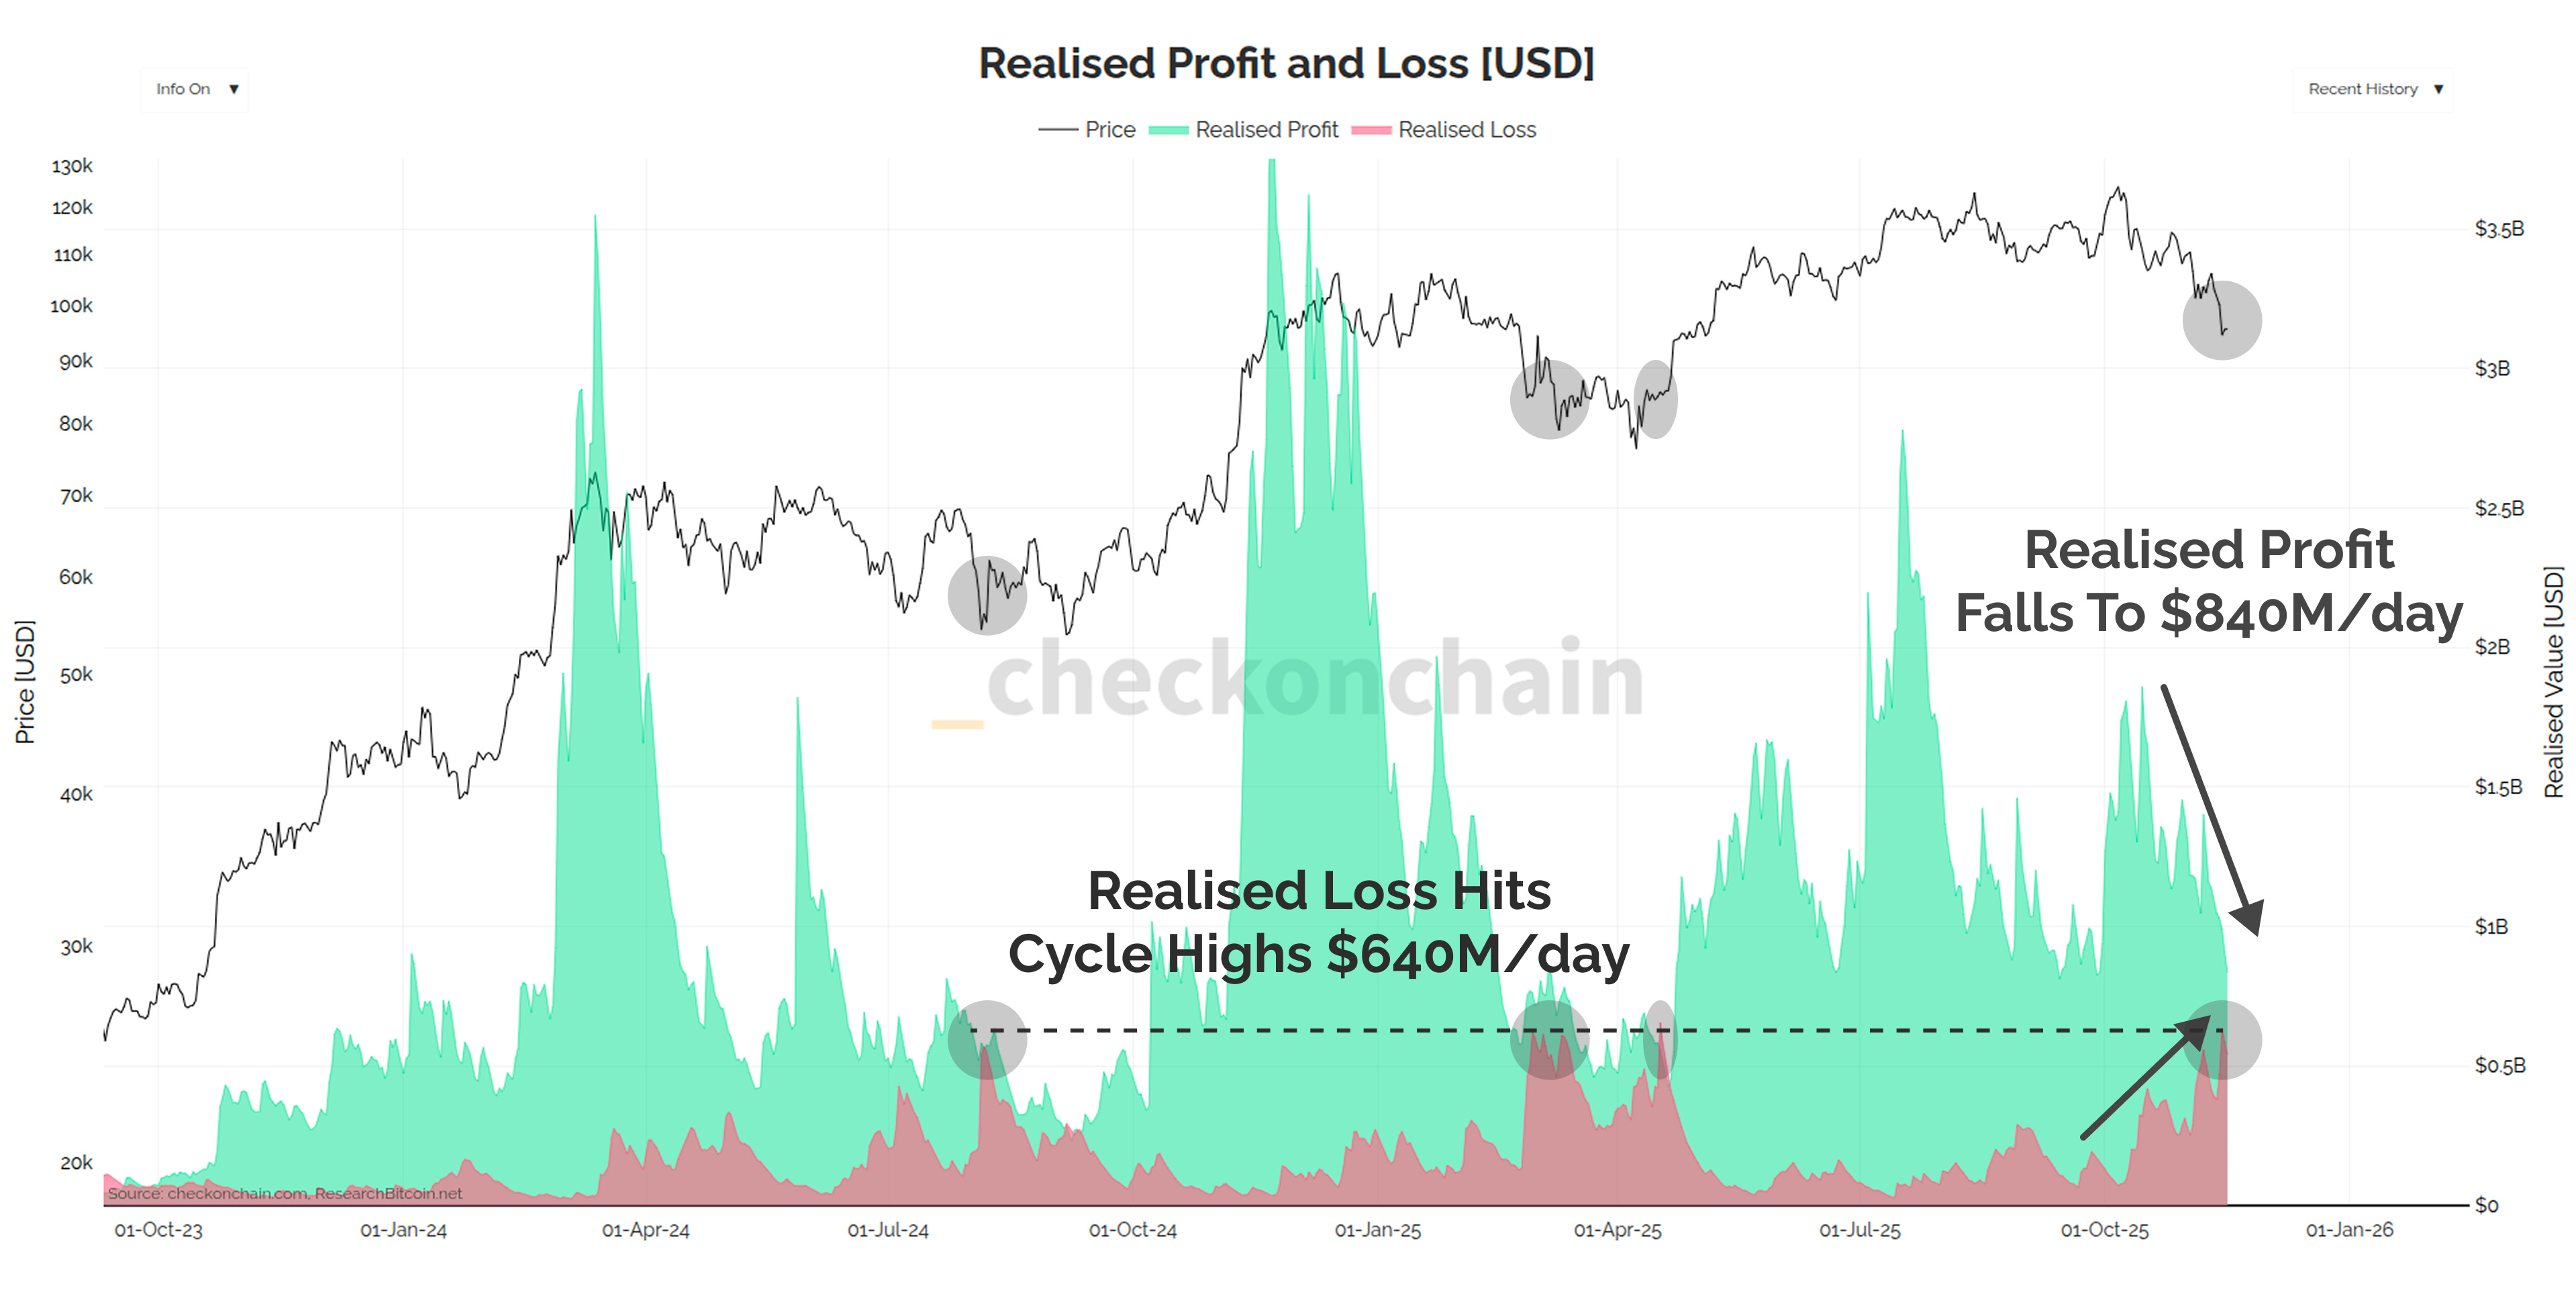
Realised profit is falling quickly, driven lower by both the slow down in revived supply, but also because of the simple fact there is less profit in the system to be taken.
Realised loss on the other hand has spiked up to $640M/day, which is on par with the capitulation event we have seen near local lows this cycle.
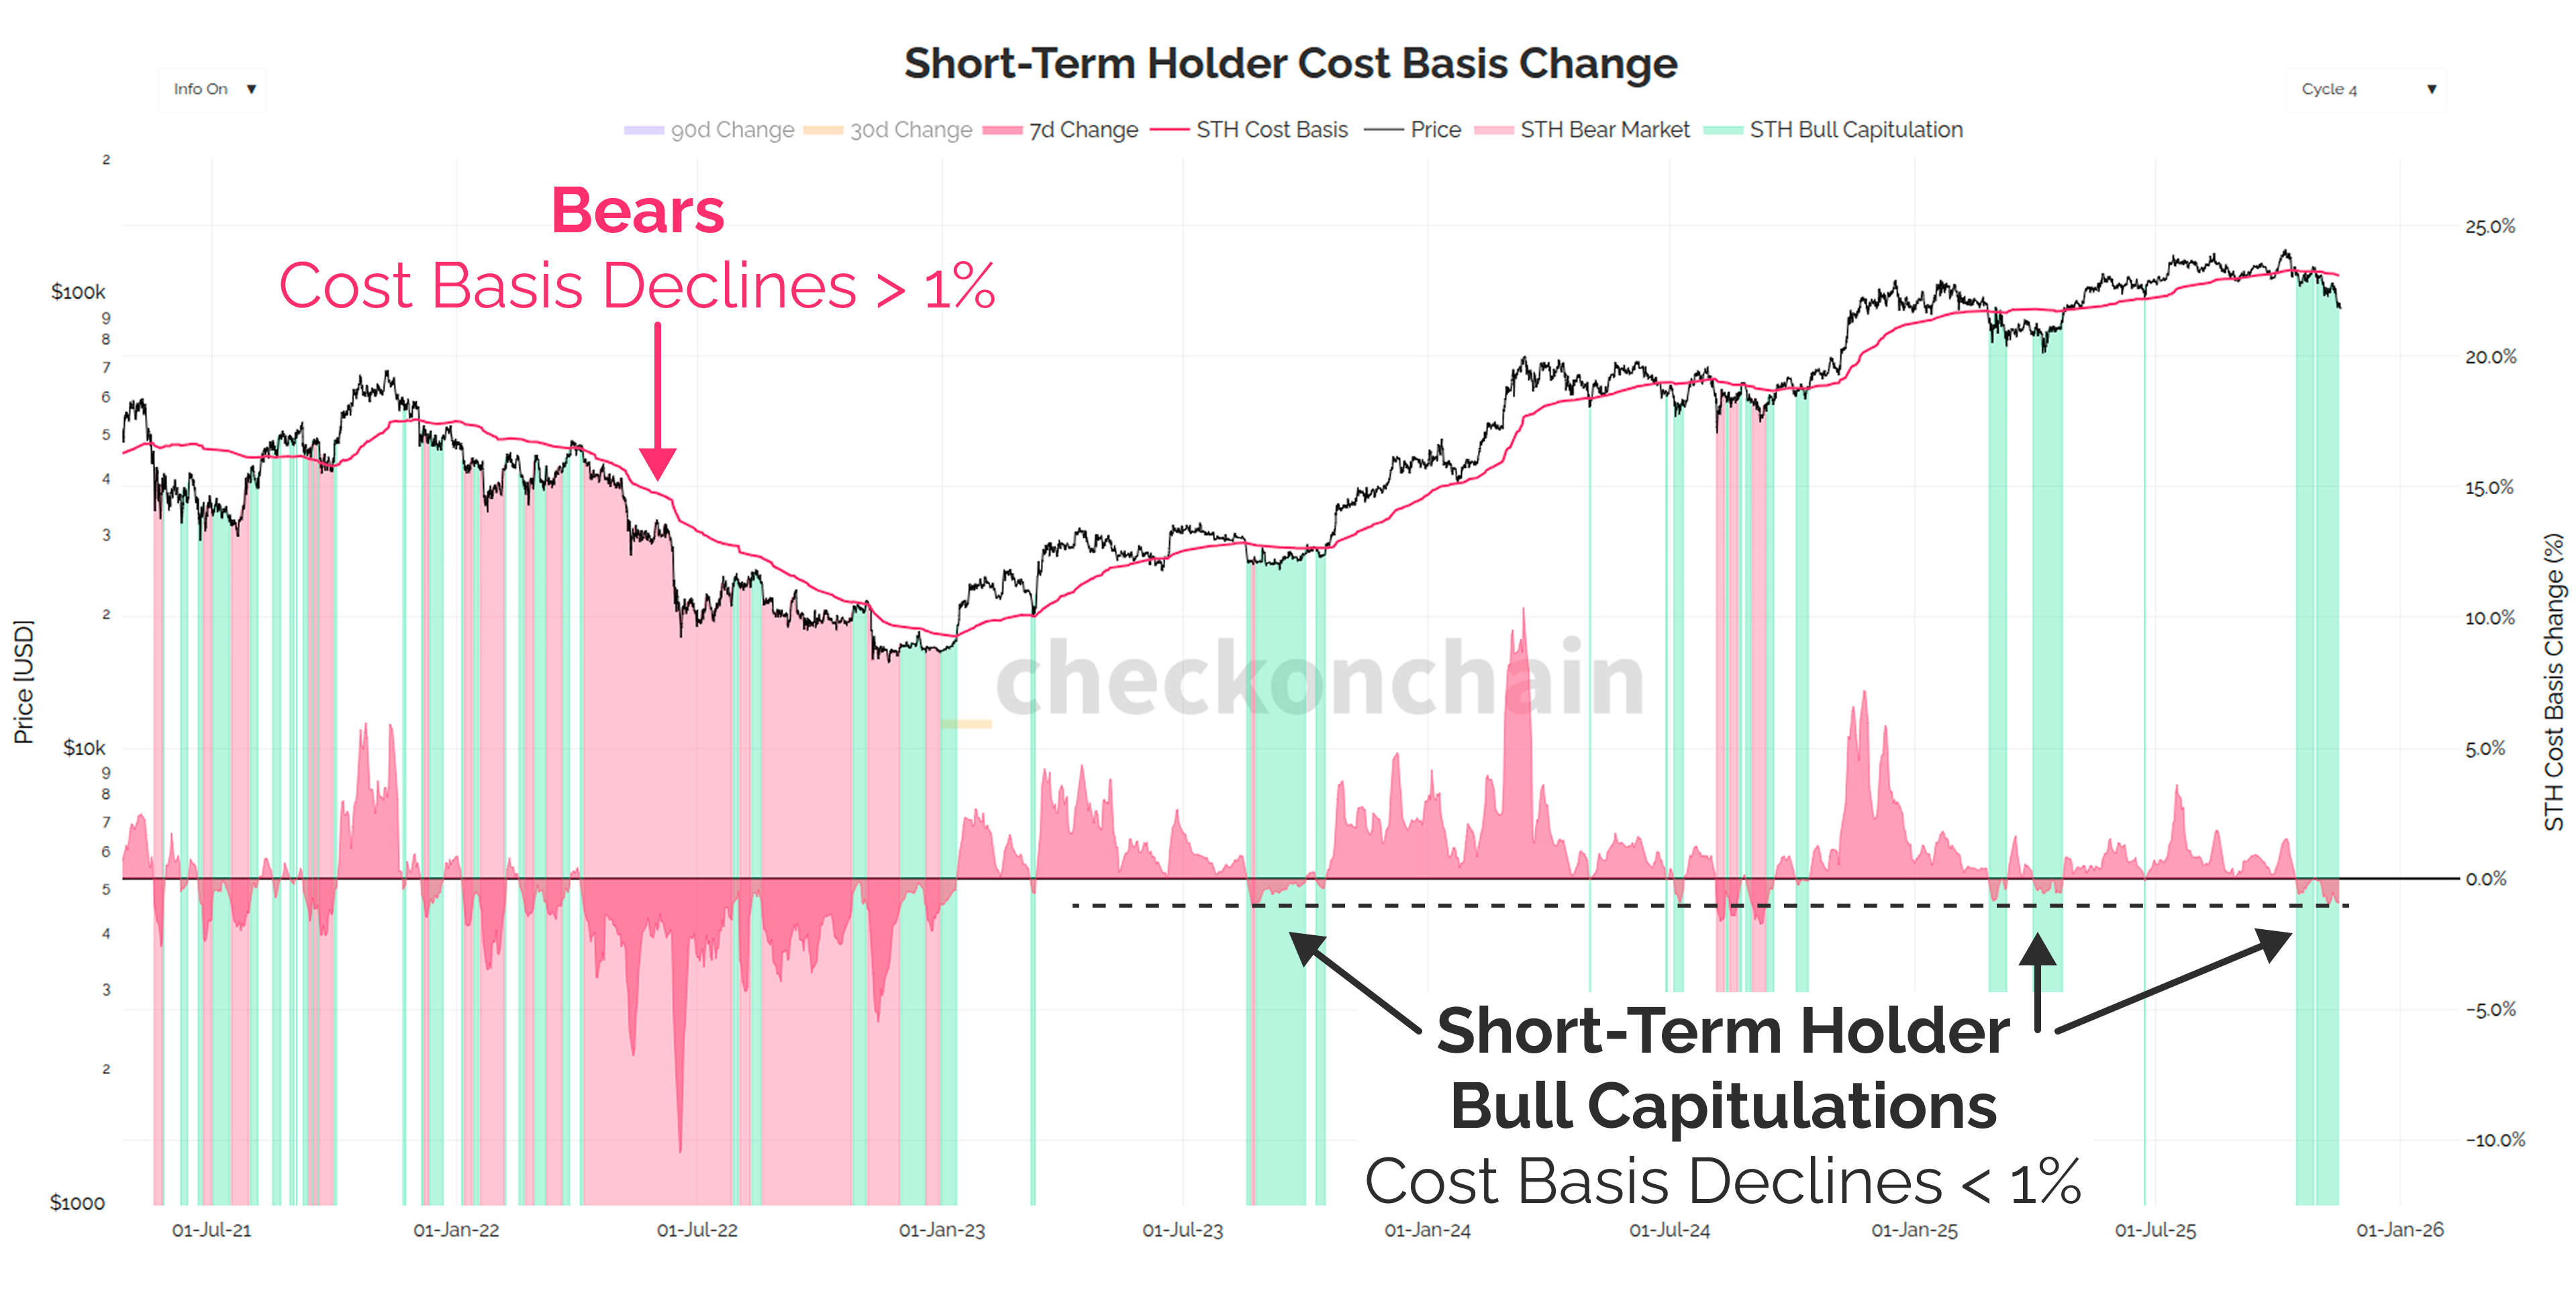
Almost all of the realised losses are coming from Short-Term Holders, and their cost basis has declined by 1% over the last 7-days. The STH cost basis level will decline whenever expensive coins held by that cohort crystallise the losses, transferring to a new buyer down here at $95k.
This 1% decline is the magnitude we have seen around the lows of all of the dips during this cycle so far (green).
I have flagged on the chart below zones where the decline exceeds 1%, and these environments are overwhelmingly found in bear markets.
Just about every metric I look at is in the same spot: bottom here, or bear out.
Concluding Thoughts
So here we are, at the Bulls Last Stand of $95k.
Given everything we have covered in this piece, my overarching market read is as follows:
The bears have the upper hand now. Whilst the bull’s last stand is the final line in the sand between a bull and a bear, one must acknowledge that we’ve been pushed back to the final defensive position.
Almost every metric I track is as low as it gets in a bull, which means this is either the most amazing opportunity of this bull cycle so far…or we are no longer in a bull.
If we formed a low here, it should come as no surprise. There is still a genuine chance that this is a dip, but it MUST bottom here, and quickly.
If we’re still chopping around down here over the next week, it’s probably over for the cycle. We either need to see a final flush out lower and a hammer candle recovery, or a slingshot move back to the upside in the next week or two. The more time we dick around down here, the more likely we paint a bear flag on the price chart, which will release lower.
Even if we bounce, there is a very significant chance we form a macro lower high somewhere around $105k to $110k. The bulls have to work their asses off to repair this chart, because the bears have the upper hand, and many people will sell into the relief bounce that will eventually show up.
Check the Analyst is of the view that the odds favour the bear case, and I expect if we release to the downside, the market would ultimately bottom somewhere above the 2024 chopsolidation range. There is a confluence of factors in the mid $80k region that is at a minimum a good target for the next stop.
If the bear is in fact upon us, I expect it would take months, not years to resolve, and I think it would bottom out at a drawdown of somewhere between a -40% ($75k) and -35% ($85k). We will never know for sure, and it will depend on how many over-leveraged forced sellers are still hiding out there, white knuckling it.
Check the HODLer is of the view Bitcoin is already undervalued right here at prices below $100k. I have formally restarted my DCA, and am buying lump sum chunks whenever I see really nasty red candles.
It all comes down to the nature of the recovery, or lack thereof, over the next few weeks.
We cannot predict what the future holds, but we can prepare for it.
Prepare as if Check the Analyst is right, but hope that Check the HODLer’s gut feel is closer to the mark.
Bitcoin is going to be just fine. There will be countless narratives emerging over the next few weeks about all the reasons Bitcoin is doomed yet again.
It is anything but doomed, and like all bear markets (and dips) of the past, we are in the process of edging towards the point of maximum opportunity.
Thanks for reading,
James