

On The Cusp
Momentum has slowed, sell-side remains heavy, & Bitcoin is yet to reclaim the Short-Term Holder cost basis. It is time to reassess the bear case, so we can be prepared no matter which way it breaks.

G’day Folks,
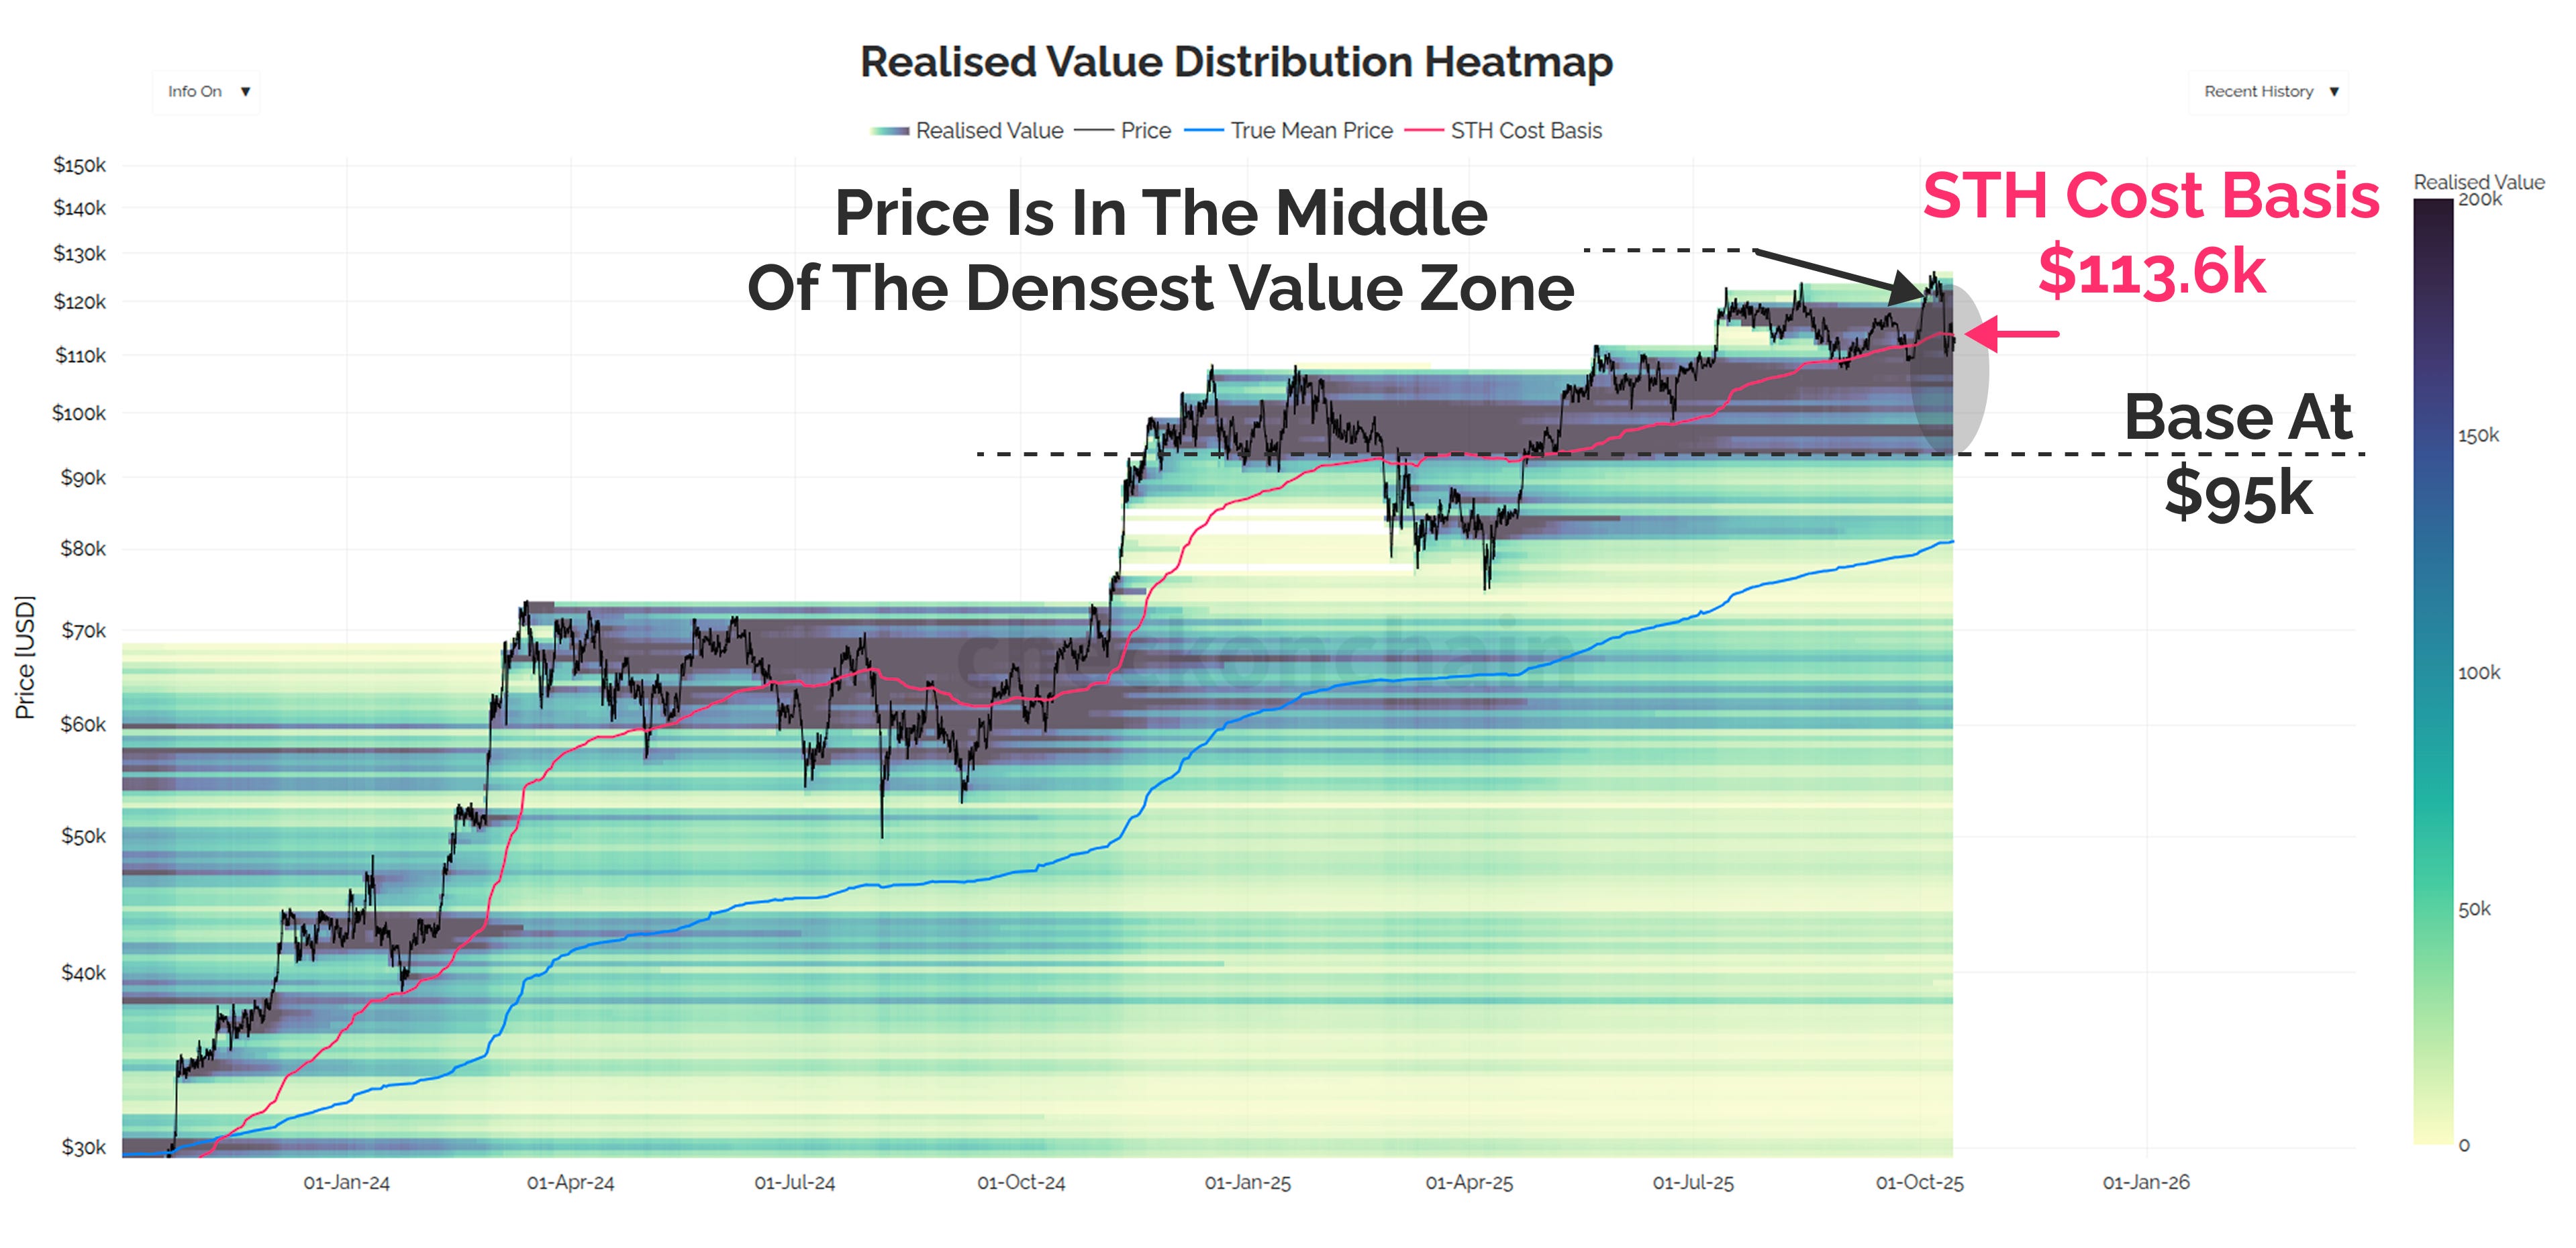
There is no question that momentum in the Bitcoin market has slowed, and the price is struggling to convincingly reclaim the Short-Term Holder cost basis at $113.6k.
As we covered in our post earlier in the week, there are several important price lines in the sand, which help us visualise when, and how quickly conditions could deteriorate between here and the critical $95k level.
As you know, I always try to hold two competing ideas in mind at the same time, and I use this to establish a framework such that I am rarely surprised when the market moves much higher…or much lower.
I want to be mentally ready, and have my decisions pre-decided before big market moves occur.
The Bitcoin price is currently trading in the middle of the densest value area we have, with 30% of the supply, and 62% of the USD invested having a cost basis above $95k.
With this as a backdrop, the two competing ideas I am holding in mind right now, are as follows:
The further we fall into this zone, the bigger the incentive for the bulls to step in and buy the dip. Unrealised losses are not yet extreme enough to break the sentiment of the bulls, and the onus is still on the bears to prove their case.
The deeper we fall into this zone, the more coins will fall underwater, the more unrealised losses will grow, and the more investors are going to start believing the cyclical top has been established.
Today’s post is going to be a detailed analysis of the bear case as I see it. We’re going to examine how deep the cracks are in The HODLers Wall, whether investors are starting to panic, and how I am personally adjusting my portfolio given my conclusions.
📈 Reminder: you can find the charts from our articles on the Checkonchain Charting Website, and a guide in our Charts Tutorial Video.
Disclaimer: This article is general in nature, and is for informational, and entertainment purposes only, and it shall not be relied upon for any investment or financial decisions.
TL;DR
Today’s post lays out the bear case for Bitcoin, given we clearly haven’t seen a strong recovery after the liquidation event last week.
There is a case to be made we find a local low between $100k and $105k, which would be similar to both corrections in 2024 and 2025. However, I think it would need to be a sharp V-shaped reversal, and the price has to convincingly clear $118k before I drop my cautious stance at this stage.
Price for Bitcoin and MSTR are both trading quite weakly, overall momentum has markedly slowed, and sell-side pressure remains very heavy, with many investors de-risking.
No matter which way I slice it, I keep coming back to $95k as the most important level to hold, as I suspect market conditions get pretty hairy if we break below it.
When I think about potential drawdown levels should a bear arrive, I still think the True Market Mean at $81k, which I think is a sensible level to consider downside risk. That would be a ~35% drawdown from the ATH, and would tag the ETF cost basis at $83k, and approach the top of the 2024 chop.
In my concluding thoughts at the end of this post, I share my portfolio update, which includes the sale of my MSTR shares at a loss (2% of portfolio), and taking a small position in a downside hedge asset to test my thesis with real capital.
Remember, dips and bears are opportunities for those that are prepared, and not surprised by their arrival.
Full Premium Video
Zones of Interest
Let’s set this thing up with an analysis of the price and drawdown potential if things do end up getting hairy.
The first observation is that the market is really testing the STH cost basis at $113.6k, and is arguably struggling to reclaim it. Whilst this price level is more of a ‘zone’ than a definitive level, I would argue that we’re on the lower bound of that zone here at $110k.
I believe there is a decent chance we see lower prices from here, as technically speaking, the price chart has looked fairly weak since last week’s deleveraging.
If we do sell-off from here, the key area I will be watching is between $100k (where MVRV is at its long-term mean), and $107k (the 200DMA). We have found our ultimate bottom between these bands in both the 2024 chop, and in the 2025 tariff tantrum.
Check the HODLer will stack some sats in this region, but will not be going all in. Just a nibble at some discounted corn.
The bull case is that we see a scary waterfall sell-off though this zone, and then a sharp V-shaped recovery. The bears will likely be extremely bold on such a move, and this is the perfect setup for a short-squeeze higher.
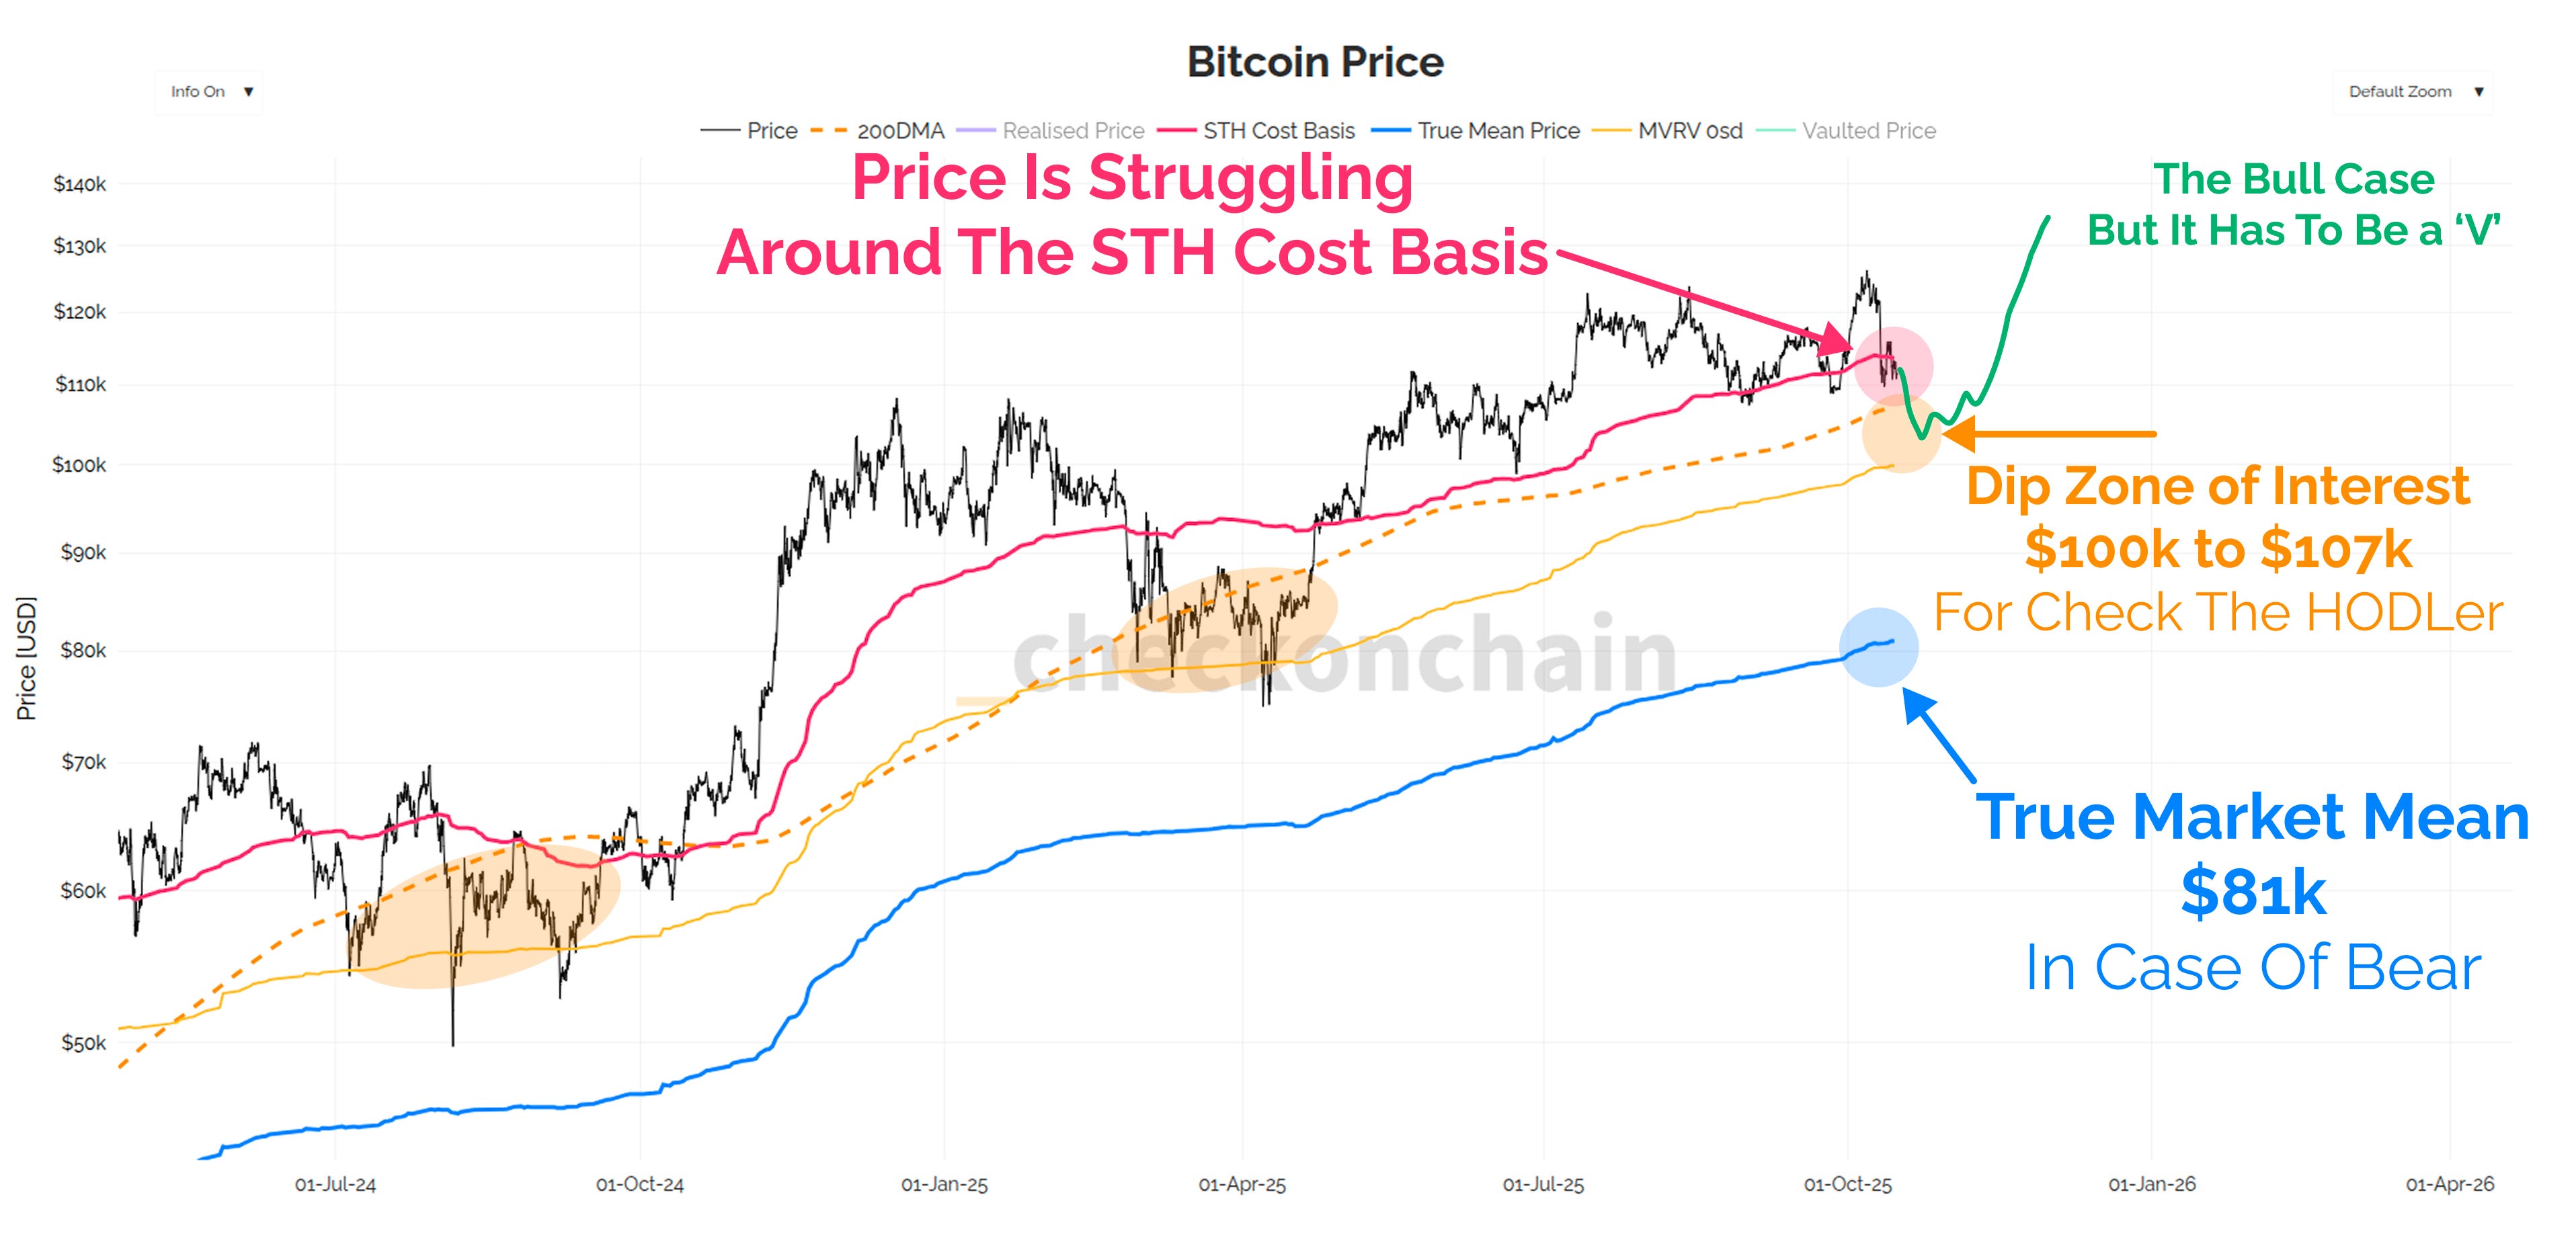
Now the real risk is that we do not get that V-shaped recovery, and if the price is below ~$105k, two thirds of the half supply within The HODLers Wall will be underwater.
In this instance, my opinion is that the odds will have greatly increased for a more serious bearish trend on our hands.
I still believe we would have to breach $95k to truly establish a bear market, but I think it is reasonable to say the odds of putting that thesis to the test are heightened once we trade below the $100k to $105k zone.
So far in this bull cycle, the deepest corrections (Aug’24 and Apr’25) were around -32%, which has an equivalent price of ~$85k today. The True Market Mean is around $81k, and the ETF cost basis is currently around $83k (chart).
Check the HODLer will be ramping up his accumulation at any prices below $95k. Whilst it will feel pretty horrible at the time, any nasty red candles that come even close to the True Market Mean are what I personally consider to be deep value.
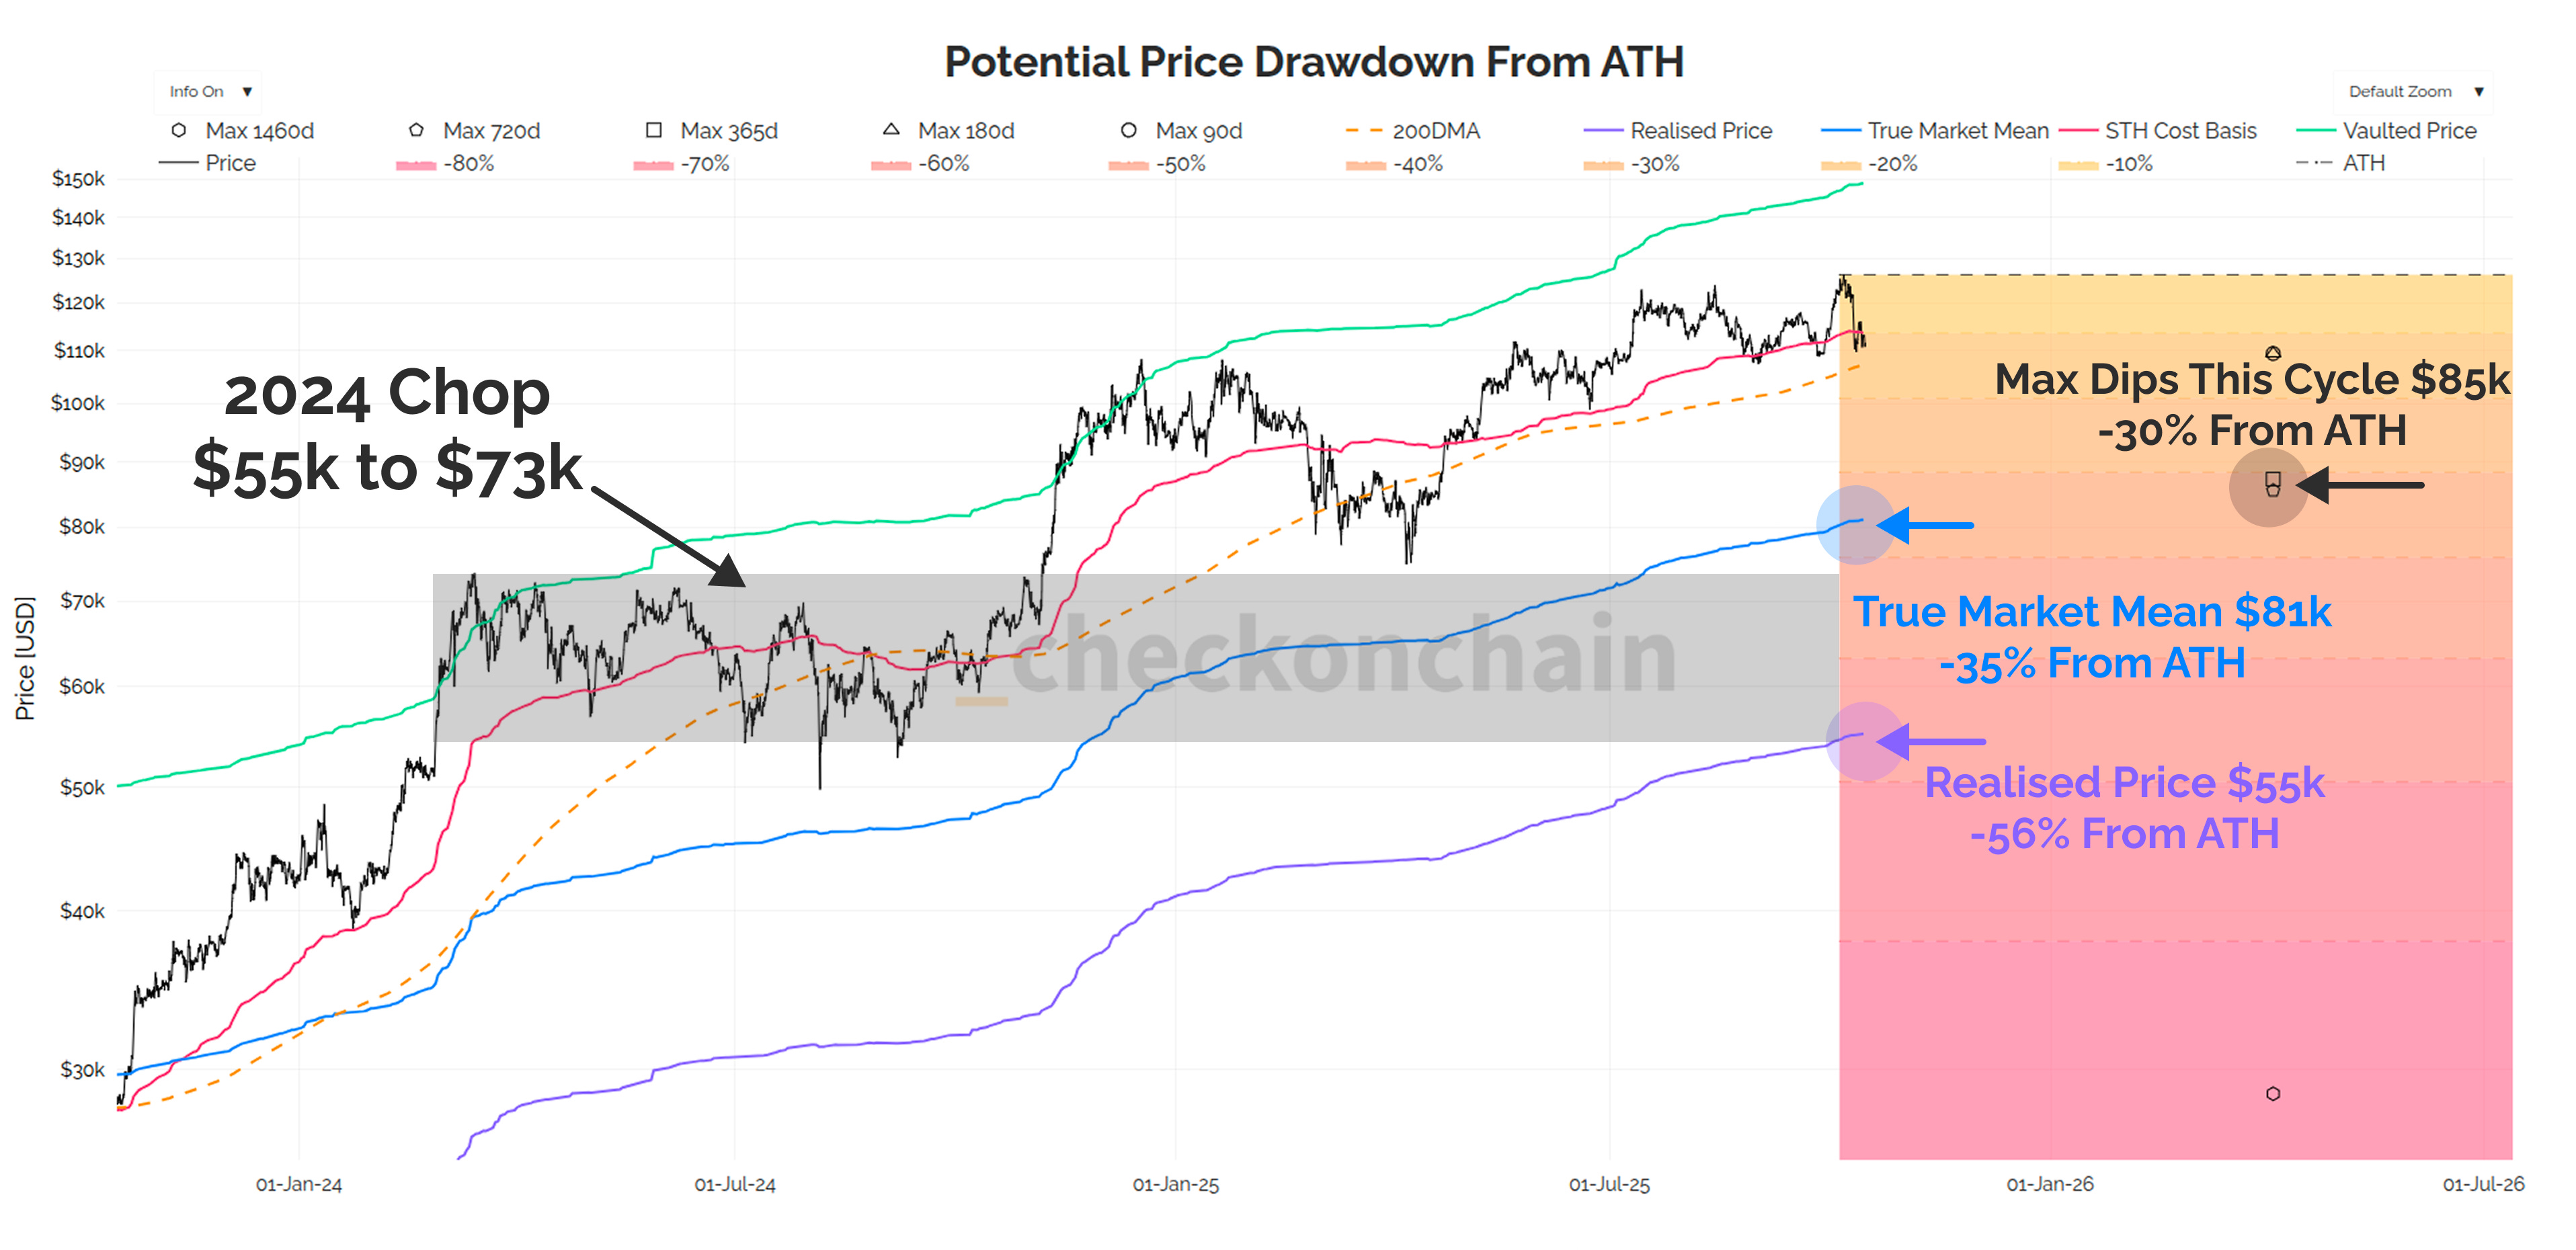
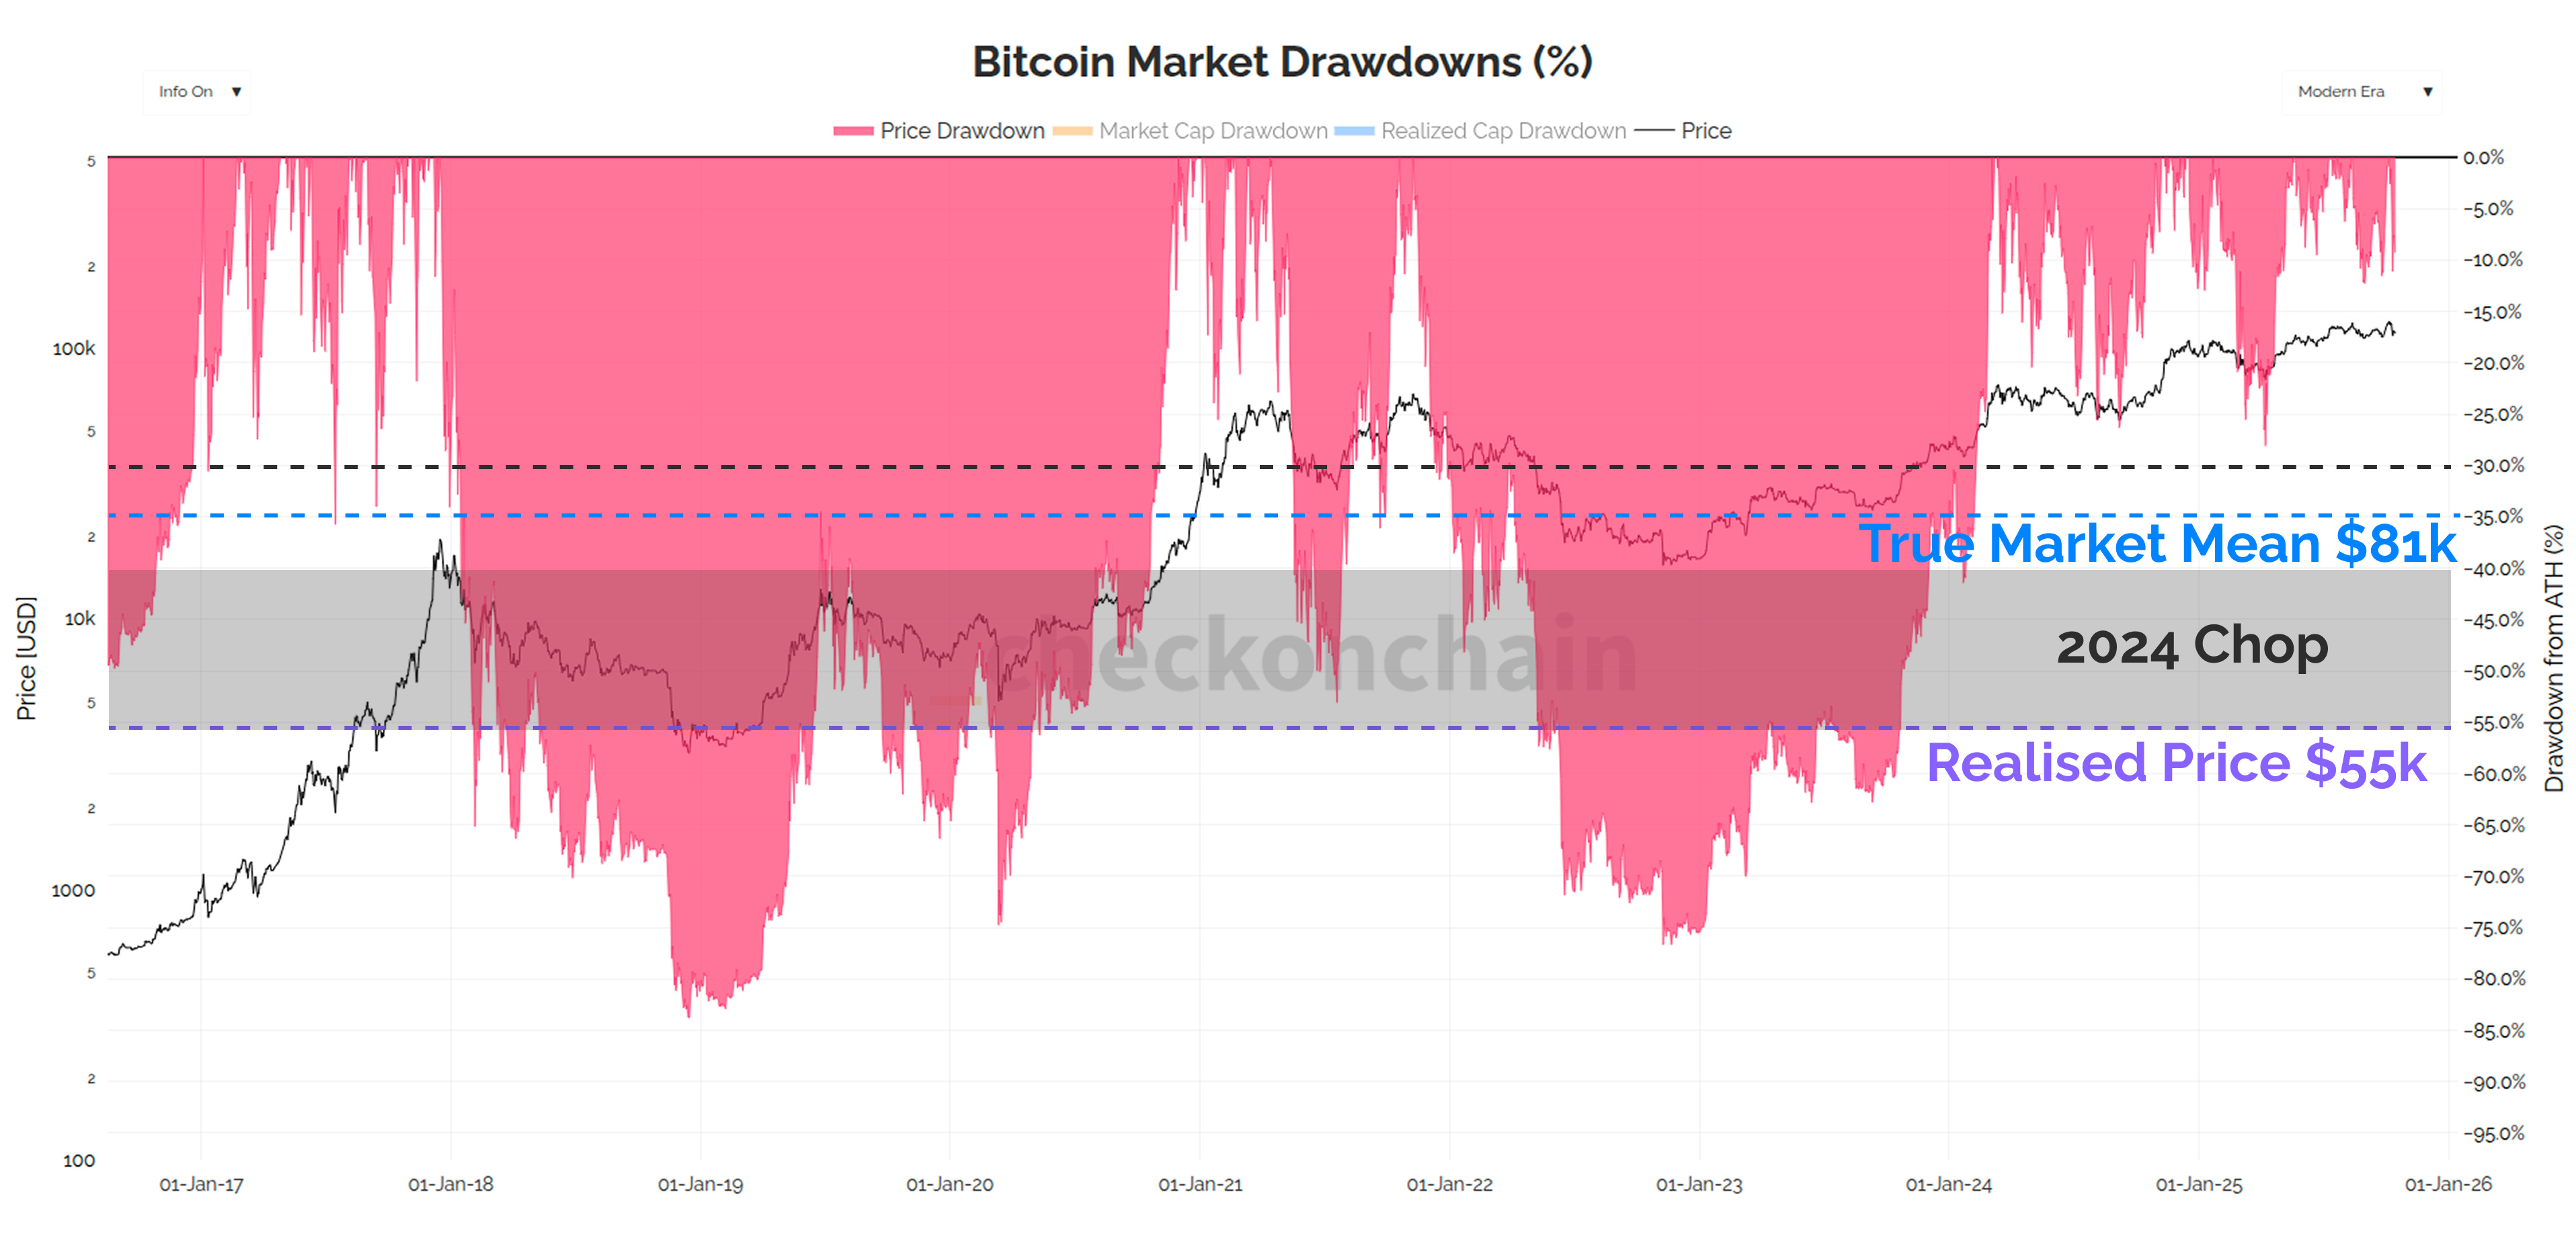
Long-term followers of onchain analysis will know all previous bear markets have bottomed out below the Realised price (purple in chart above), which is currently at $55k, and a -56% drawdown from the ATH.
It is my opinion, that this kind of a sell-off is too aggressive. That is not to say it cannot happen, but Check the HODLer will not be holding off accumulation because of an expectation we will go down to $55k.
Whilst I can argue it would be very much in line with the ‘diminishing drawdowns’ idea, I personally believe Bitcoin does not deserve to be as deep as $55k, for a few reasons:
We have proven in 2024 that Bitcoin is a trillion dollar asset (which is a price of ~$50k). Given the maturation which has occurred so far this cycle, going back down to this level feels egregiously oversold, and thus low probability.
The ETFs launched at $45k, and I cannot convince myself that we deserve to undo (in a price sense) the remarkable success of these instruments.
I very much expect the Realised Price to lose relevance at an increasing rate over time, primarily because it has many imperfections as a market wide cost basis estimate (covered in Ch6 of Cointime Economics). I believe that the True Market Mean is a more accurate first principles derived estimate for this.
For readers who are interested in these ideas, I would encourage a re-read of Rethinking Bears, where I illustrate how I arrived at these conclusions.
Struggling Strategy
Over my years in markets, I have increasingly come to respect price as an important source of information. Chart patterns, technical analysis, and onchain data are all derived from the same thing; investors making decisions with their capital.
The MSTR stock price is holding up the best out of almost all the Treasury Company stocks…and frankly, it looks like ass.
Whilst the Bitcoin price is clinging onto $110k by its fingernails, MSTR is setting lower and lower lows on most time-frames. If I look to my 155d-VWAP, the price has to bounce right here, right now at $300…else the key support zone -26% lower at $222.
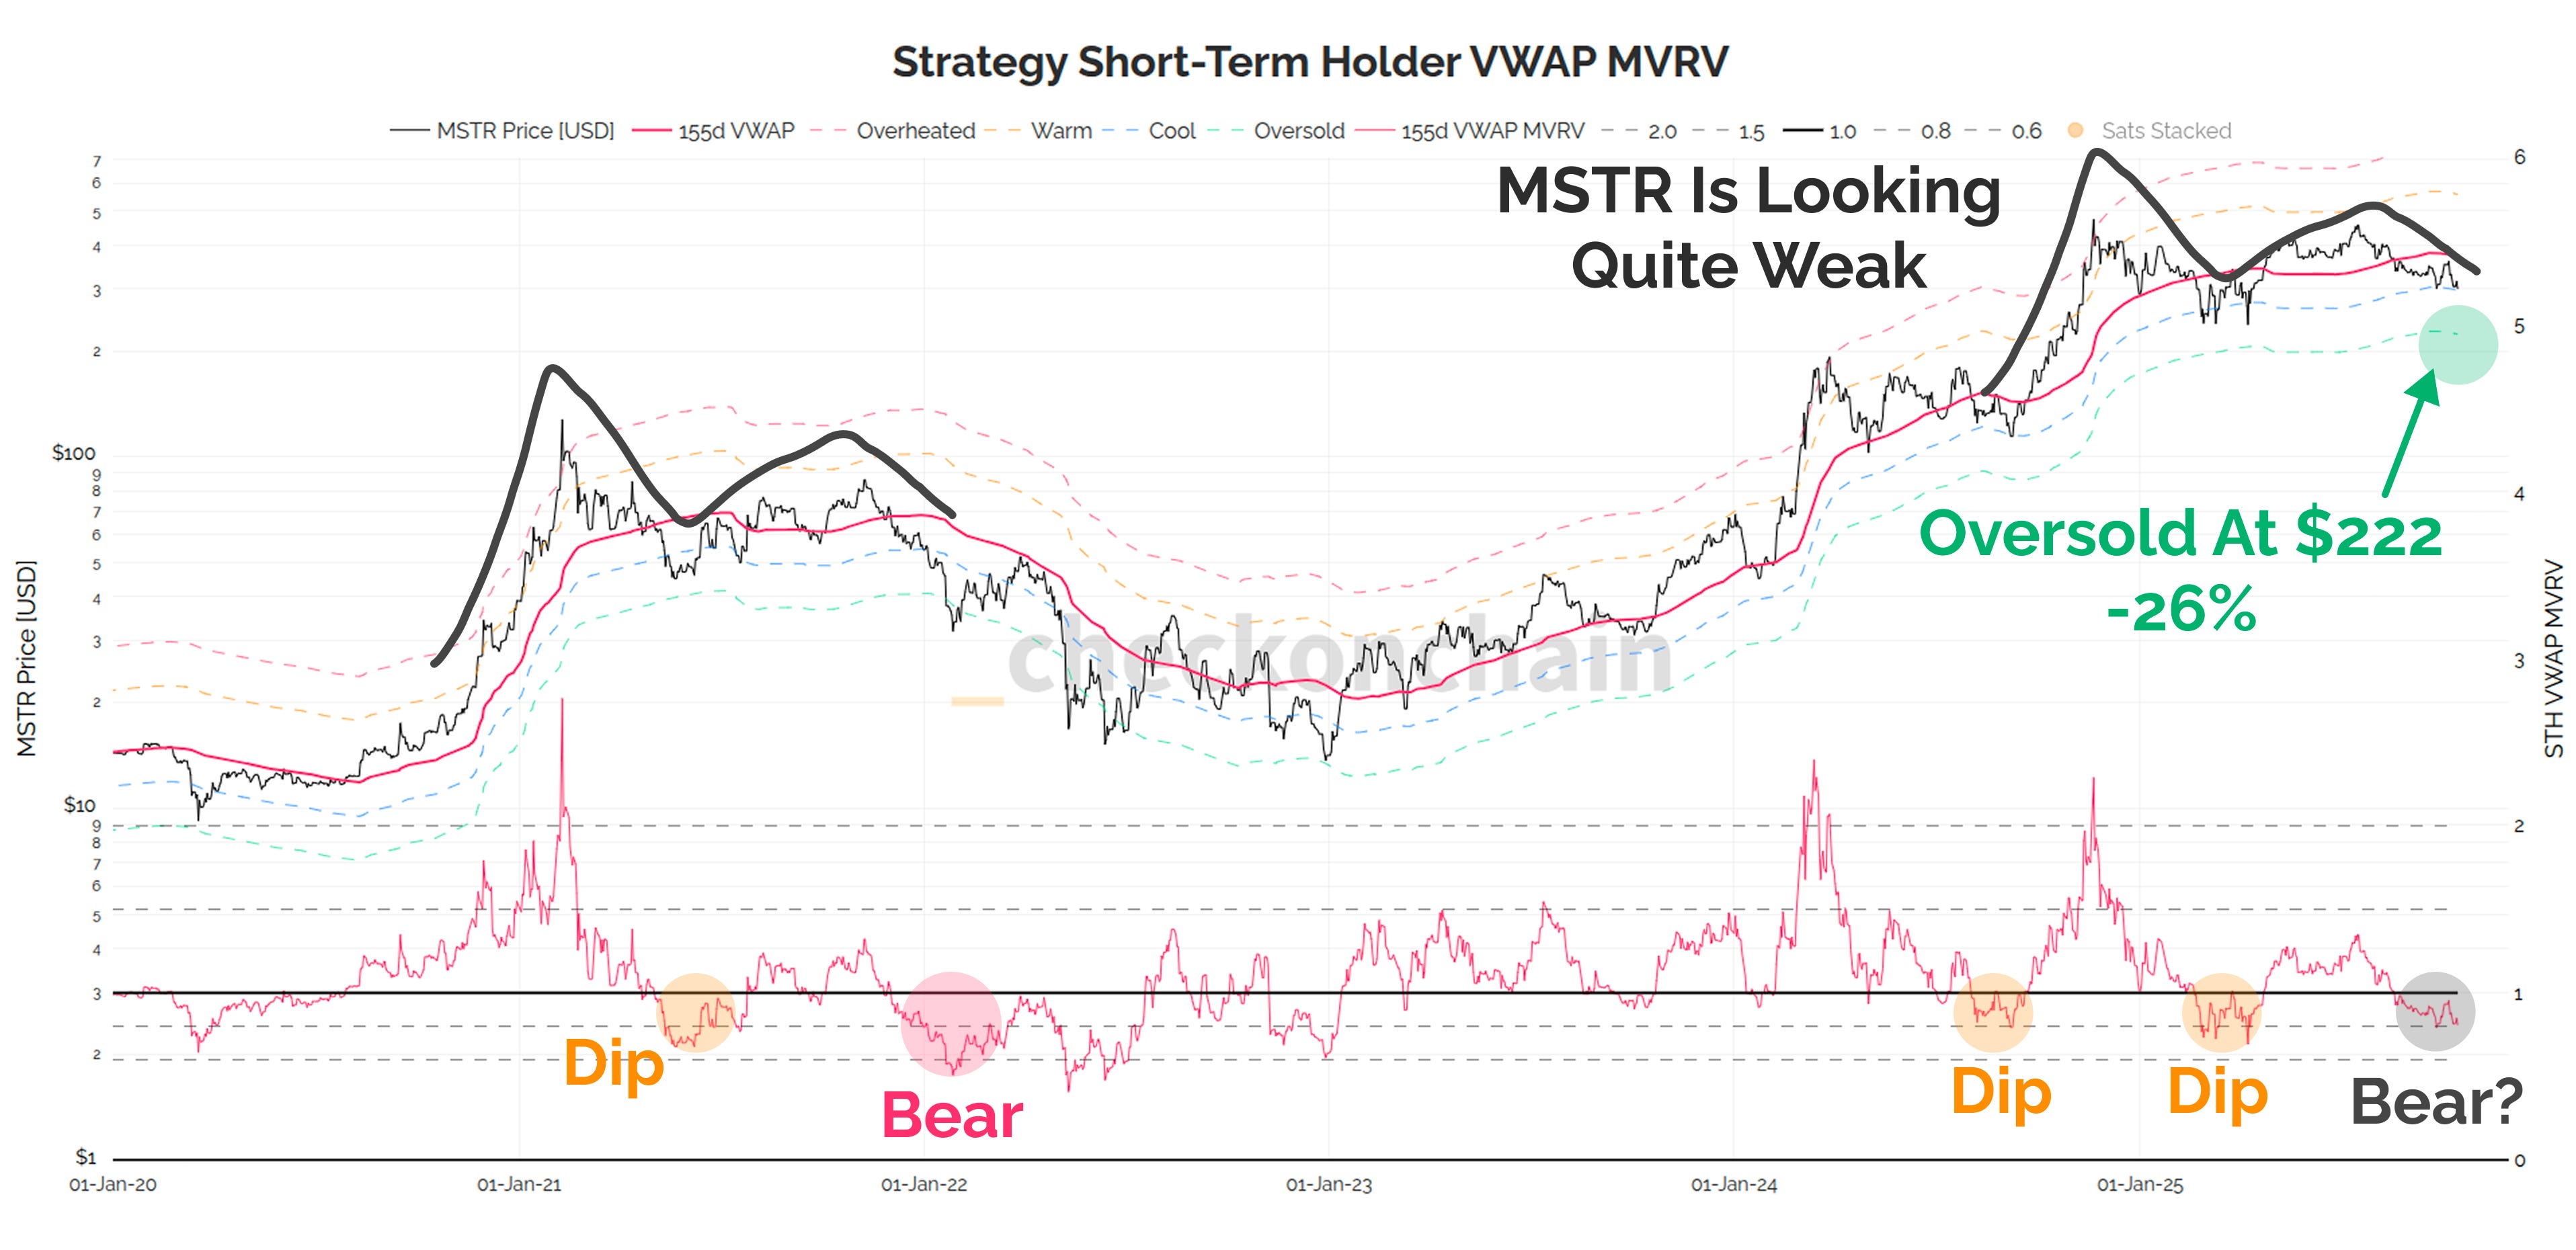
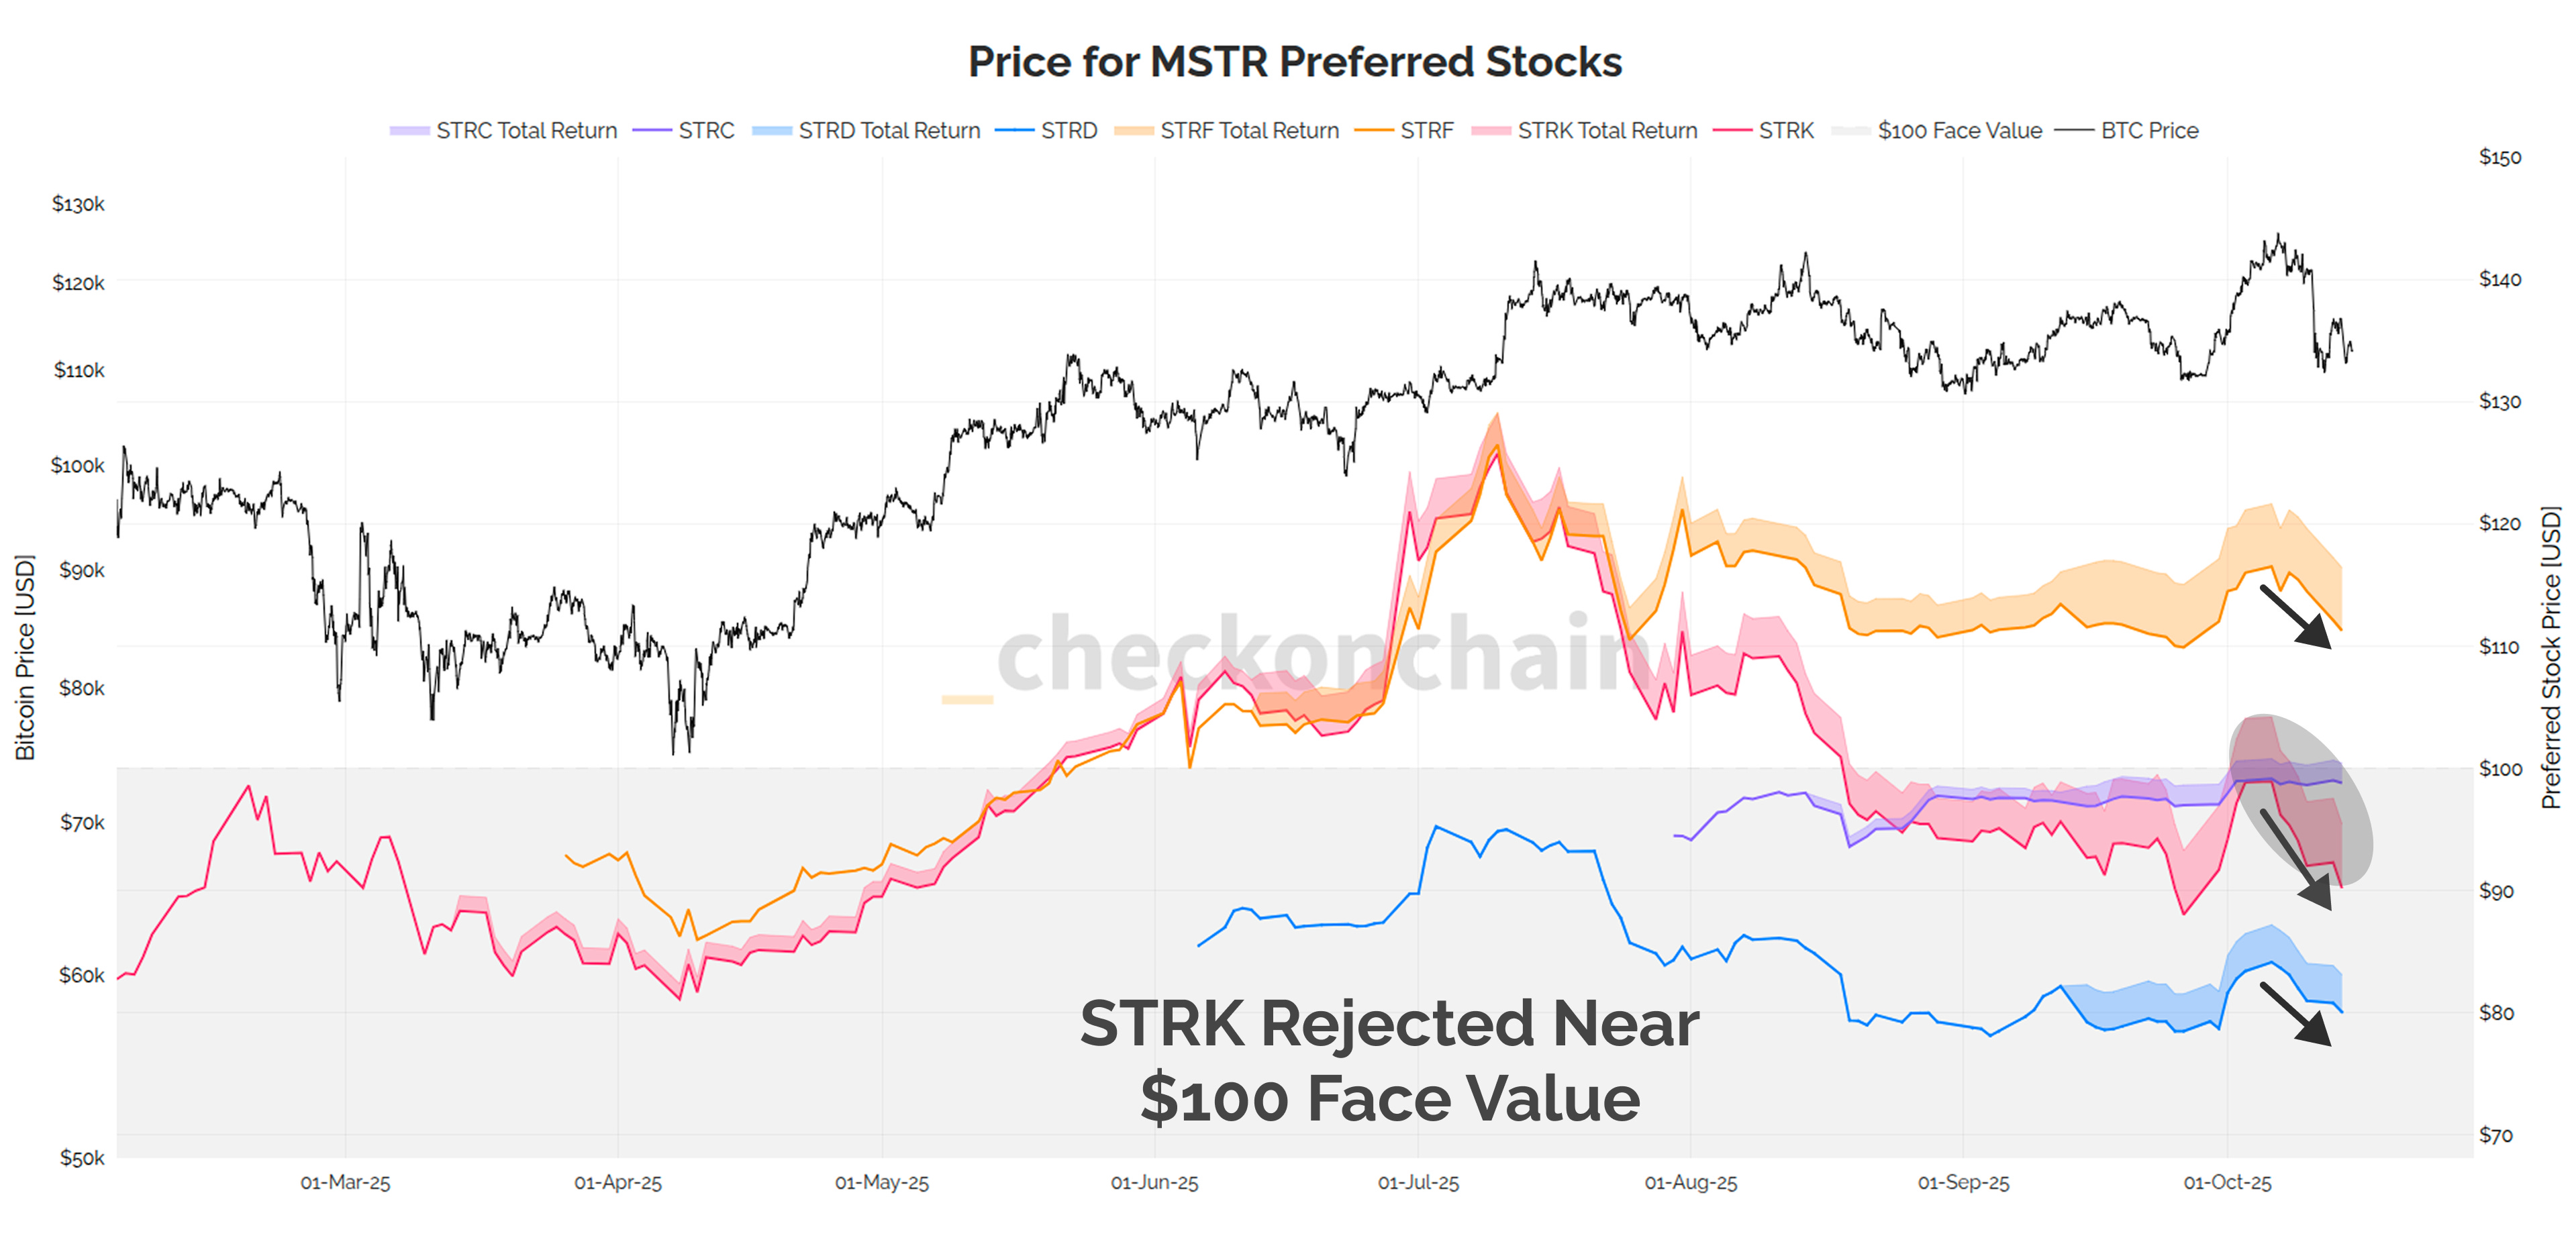
Strategy’s preferred stocks have also taken a hit in recent weeks, and I am particularly interested in watching STRK (‘Strike’). Strike is both a yield bearing instrument, but also has a MSTR conversion call option baked into it, which gives it;'s price a degree of ‘forward expectations’ information.
The fact that all of Strategy’s products are trading lower, and many are below $100 par value, suggests the company will not be stacking many sats anytime soon.
Growth metrics have already slowed, and it looks set to stay that way for the foreseeable future. I suspect MSTR will behave just like the ‘leveraged Bitcoin’ instrument it effectively is, and that cuts both ways unfortunately.
Cracks In The Wall
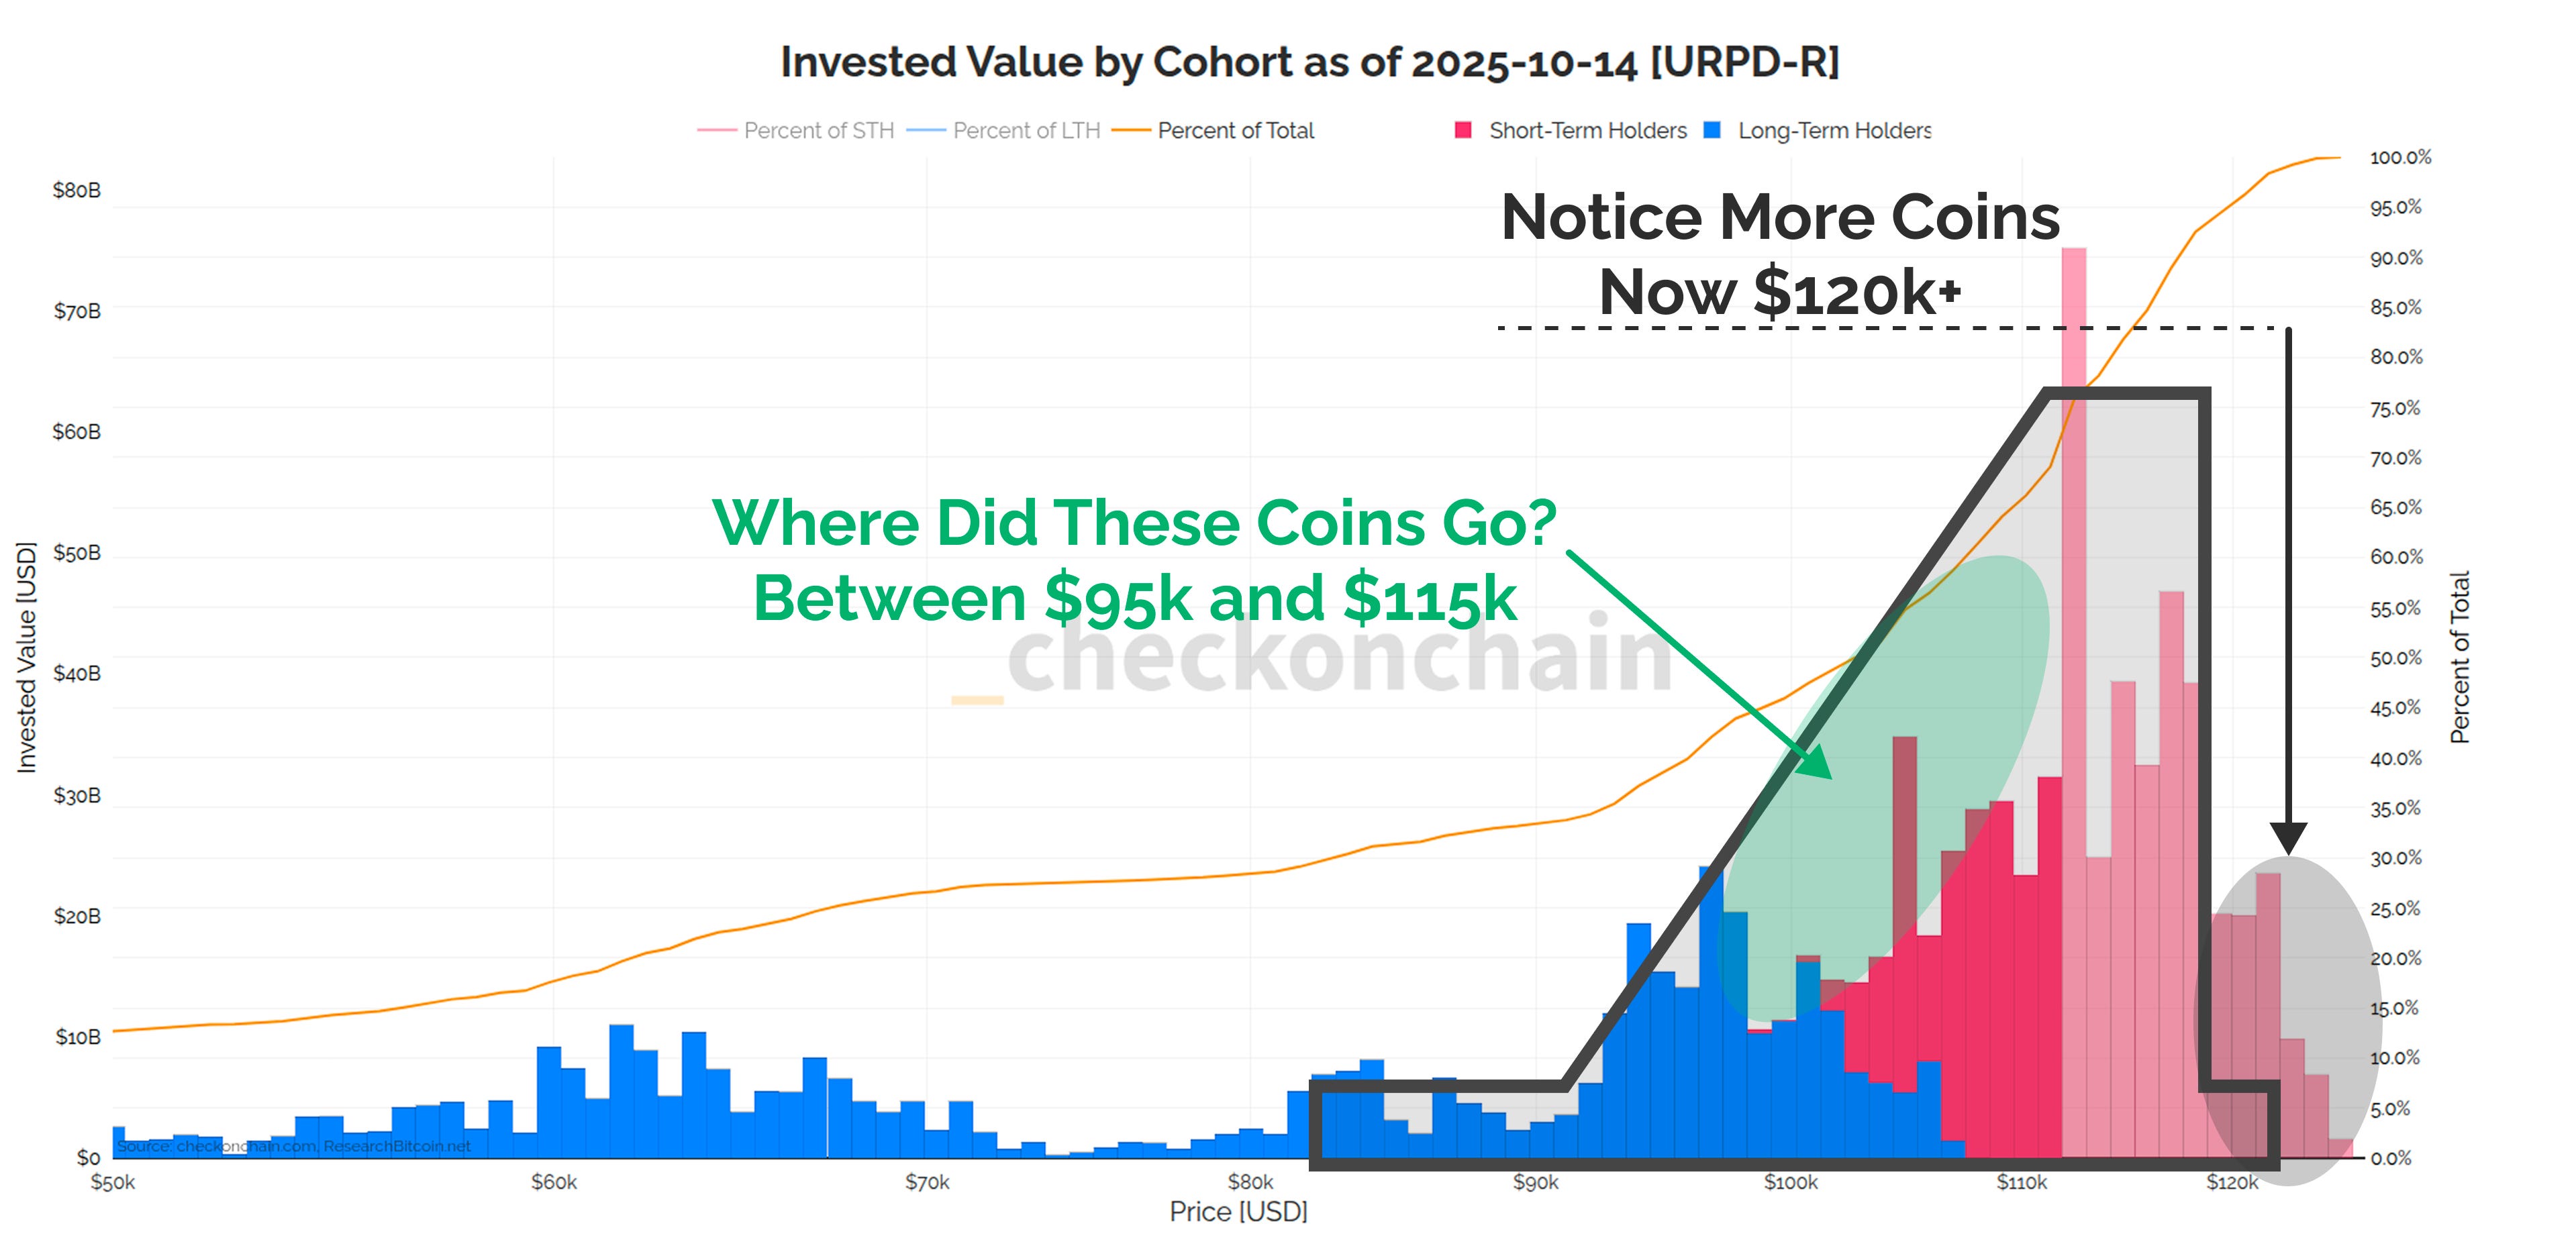
We are starting to see cracks in The HODLers Wall propagating deeper.
The chart below uses the same Retaining Wall overlay from the original post, but I can’t help but notice we are missing a lot of the supply from the $95k to $115k region.
Those coins have effectively taken profits, and moved up to the $120k+ region.
The wall still has plenty of weight, but the centre of gravity is slowly but surely moving higher up, which means it is increasingly ‘Top Heavy’.
The URPD chart below tries to visualise how the supply has changed over the last 30-days. The blue zone shows the supply back in mid-September, and the yellow shows the distribution today.
This shows that there has been ‘profit taking’, or de-risking taking place over the last month, resulting in more supply having a cost basis up above $120k.
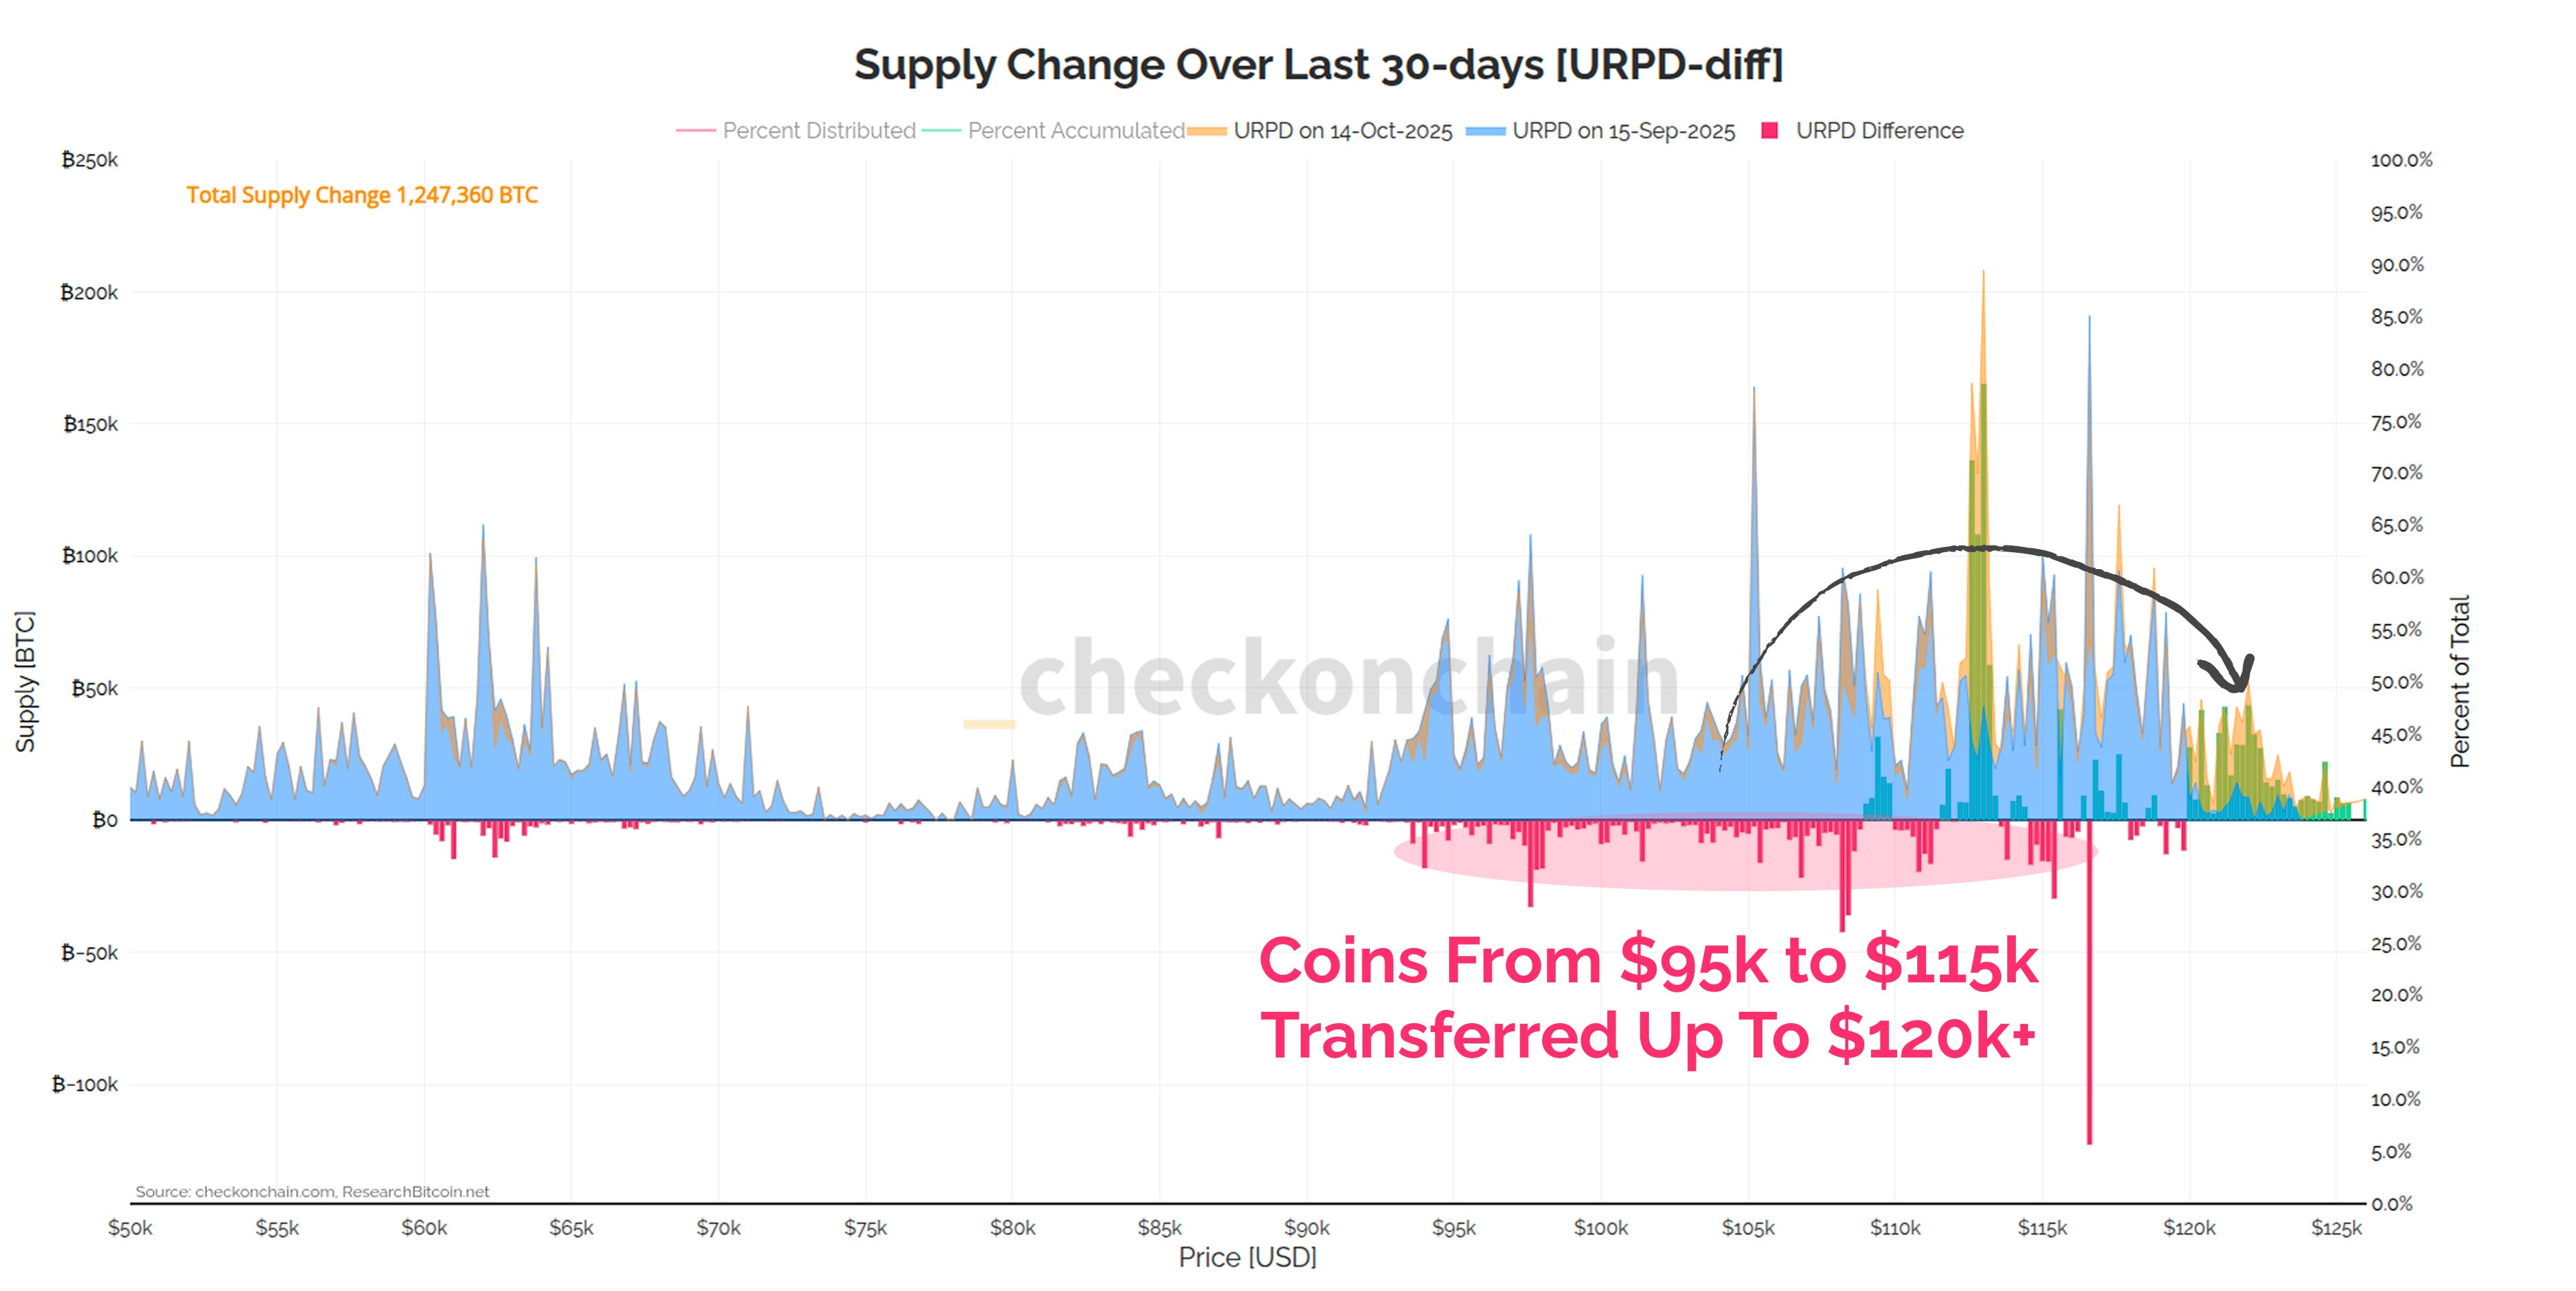
As more supply gets ‘deposited’ at higher price levels, we start seeing more investor sensitivity as the price trades lower. All of those new Short-Term Holder buyers up at $120k are now firmly underwater.
At $110k, around 17% of the Bitcoin supply is now in loss. Whilst this is by no means the worst dip we have seen this cycle…if we get to $95k, it will be.
There are no instances in Bitcoin history where 30% of the supply has been in loss outside of a bear market. It would satisfy our definition of a Top Heavy Market:
Top Heavy Markets: when too many people, have bought too many coins, at too high of a price.
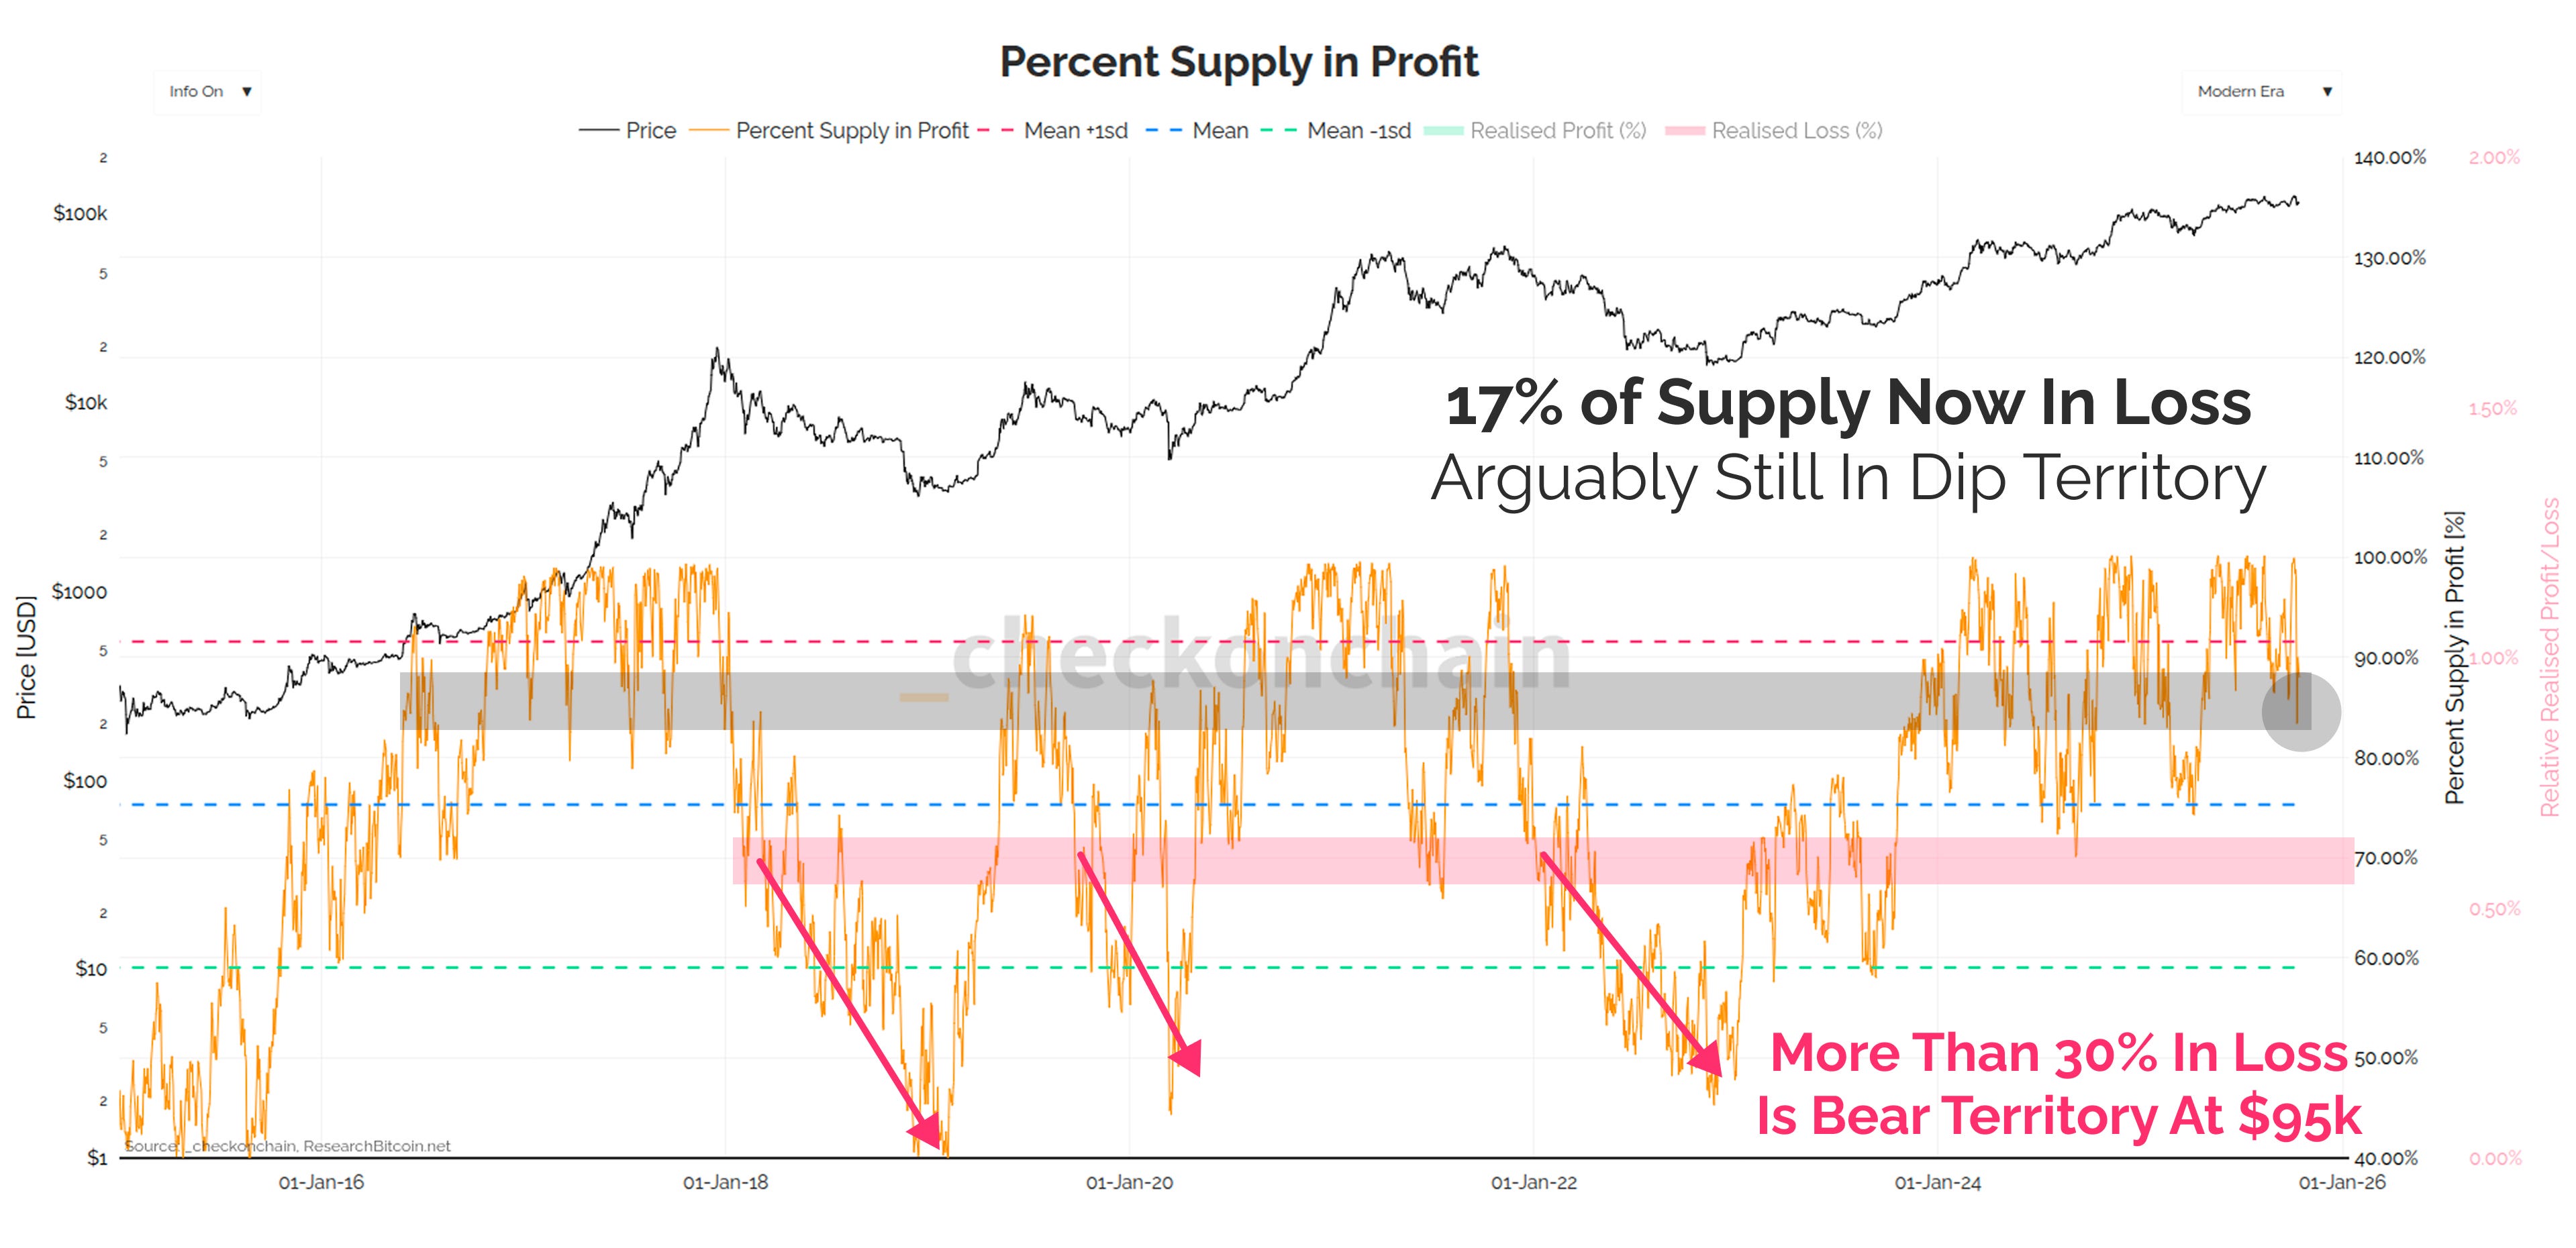
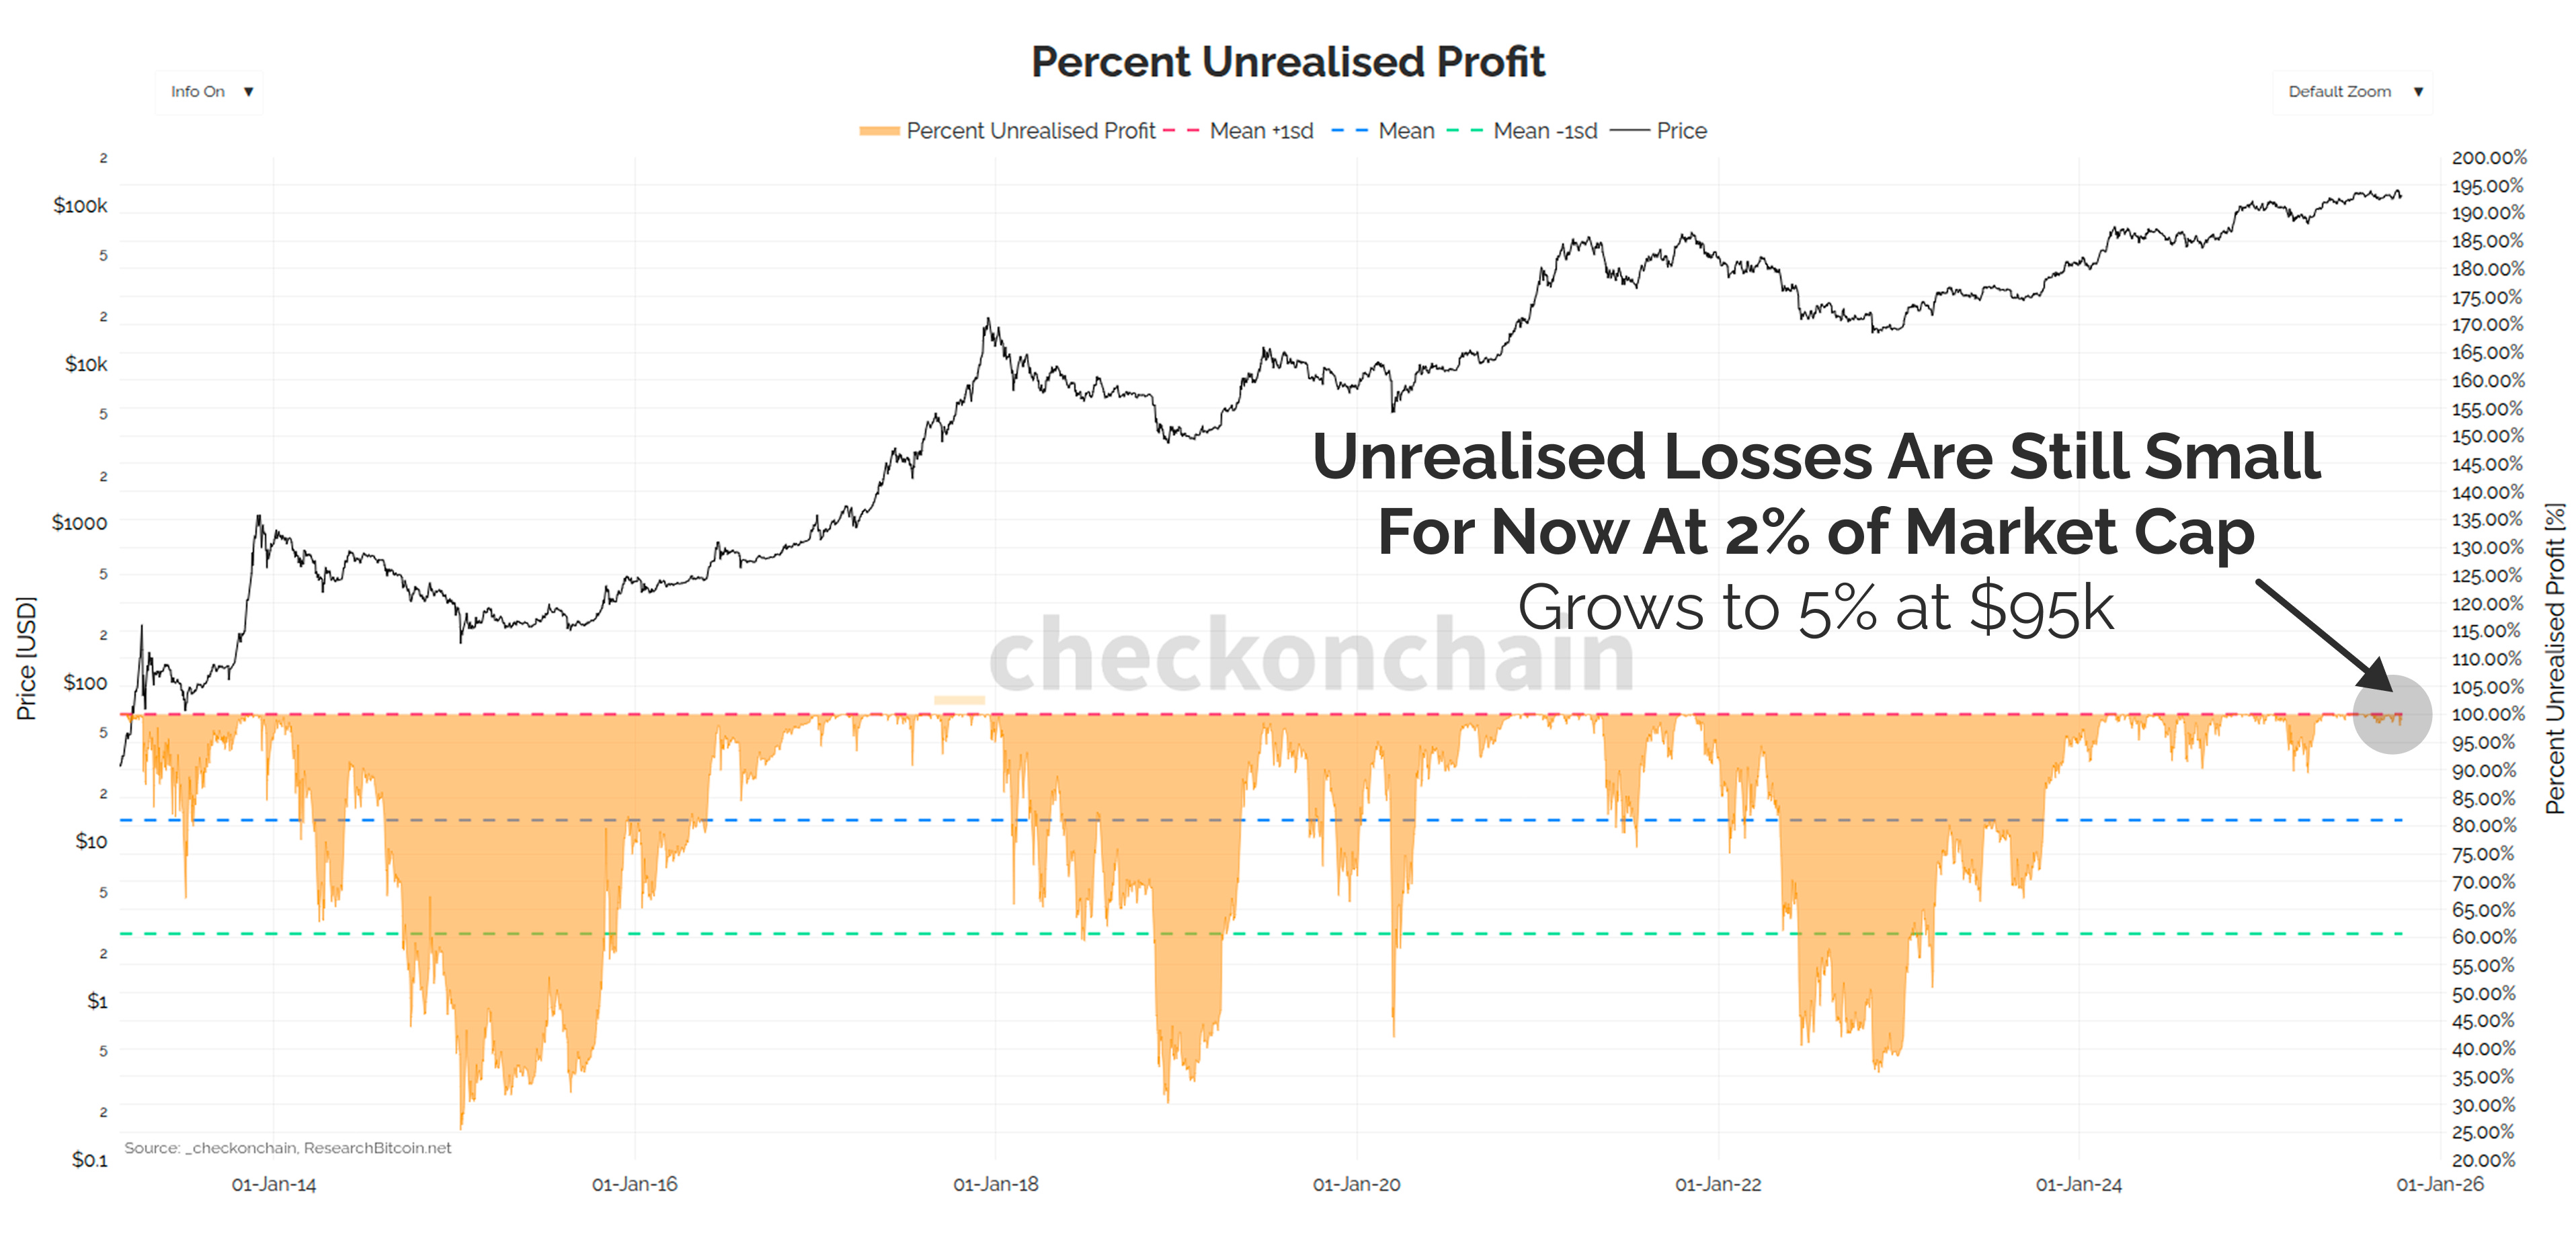
Unrealised losses market wide are still negligible at around 2% of the market cap. If the price traded down to the bull last stand level of $95k, that would grow to be 5%.
Even at $95k, with unrealised losses equivalent to ~5% of the market cap, that still wouldn’t be as bad as the 2024 or 2025 corrections.
However, I also believe there are a lot more people looking at the 4yr cycle, and the soft price action through 2025, with itchy trigger fingers. My gut tells me we will see cracks propagate through The Wall (aka investor sentiment) quickly as we approach $95k.
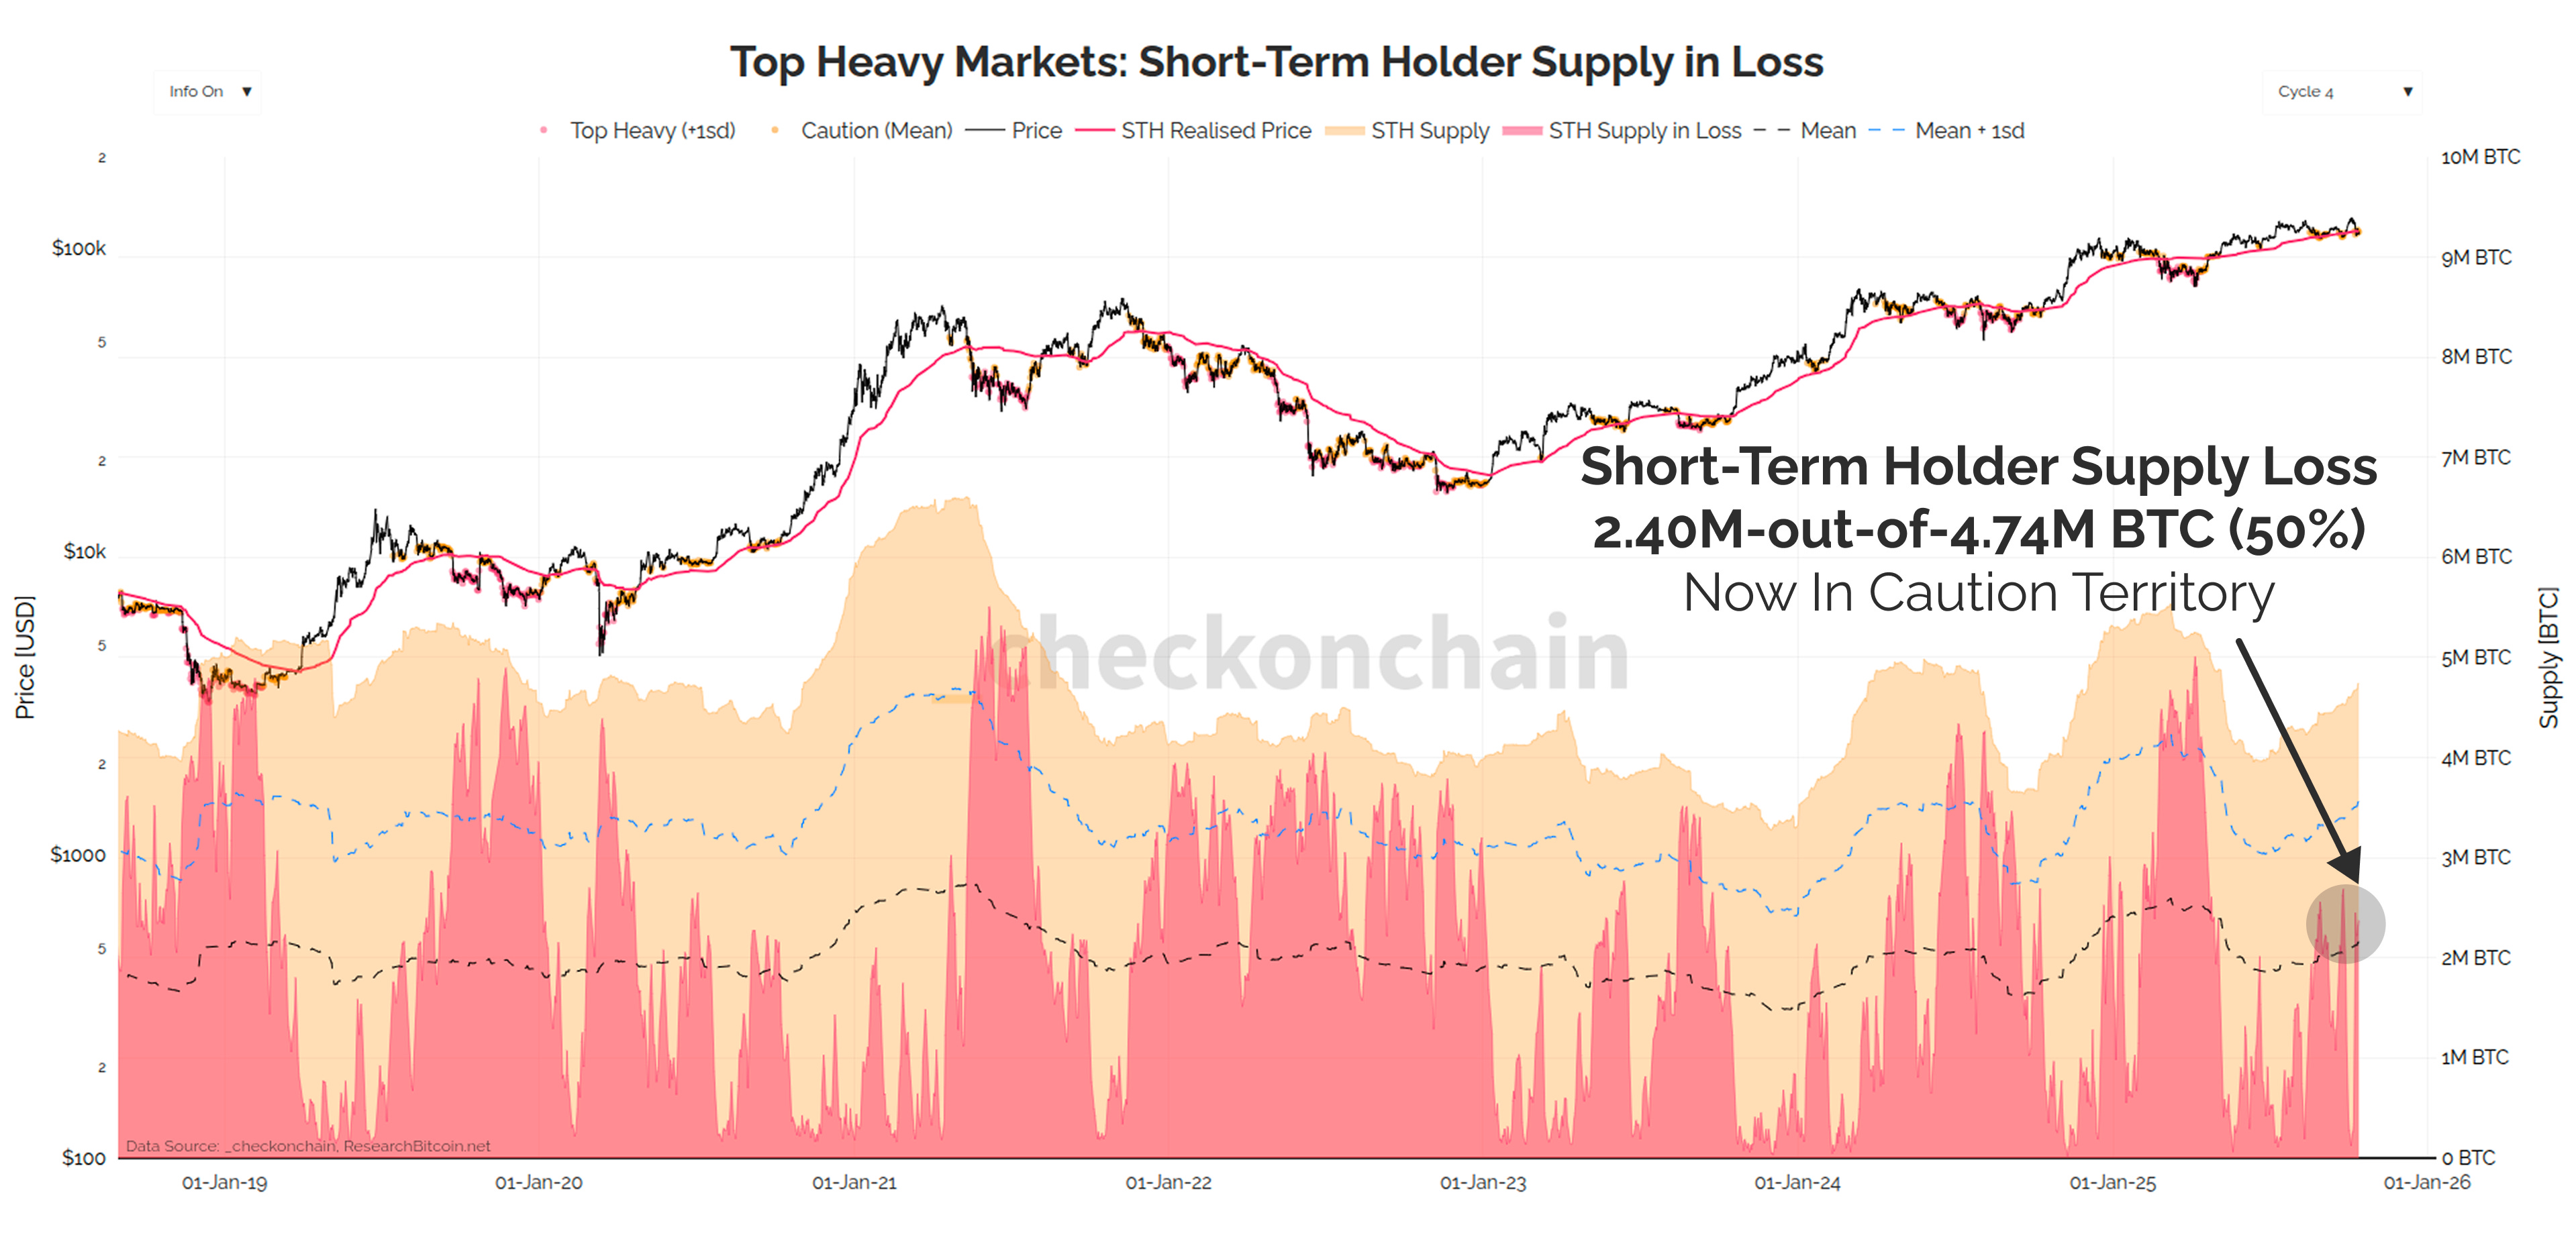
Half of all Short-Term Holder supply is already underwater, which is above the 1 standard deviation level, triggers the ‘caution’ threshold in my Top Heaviness framework.
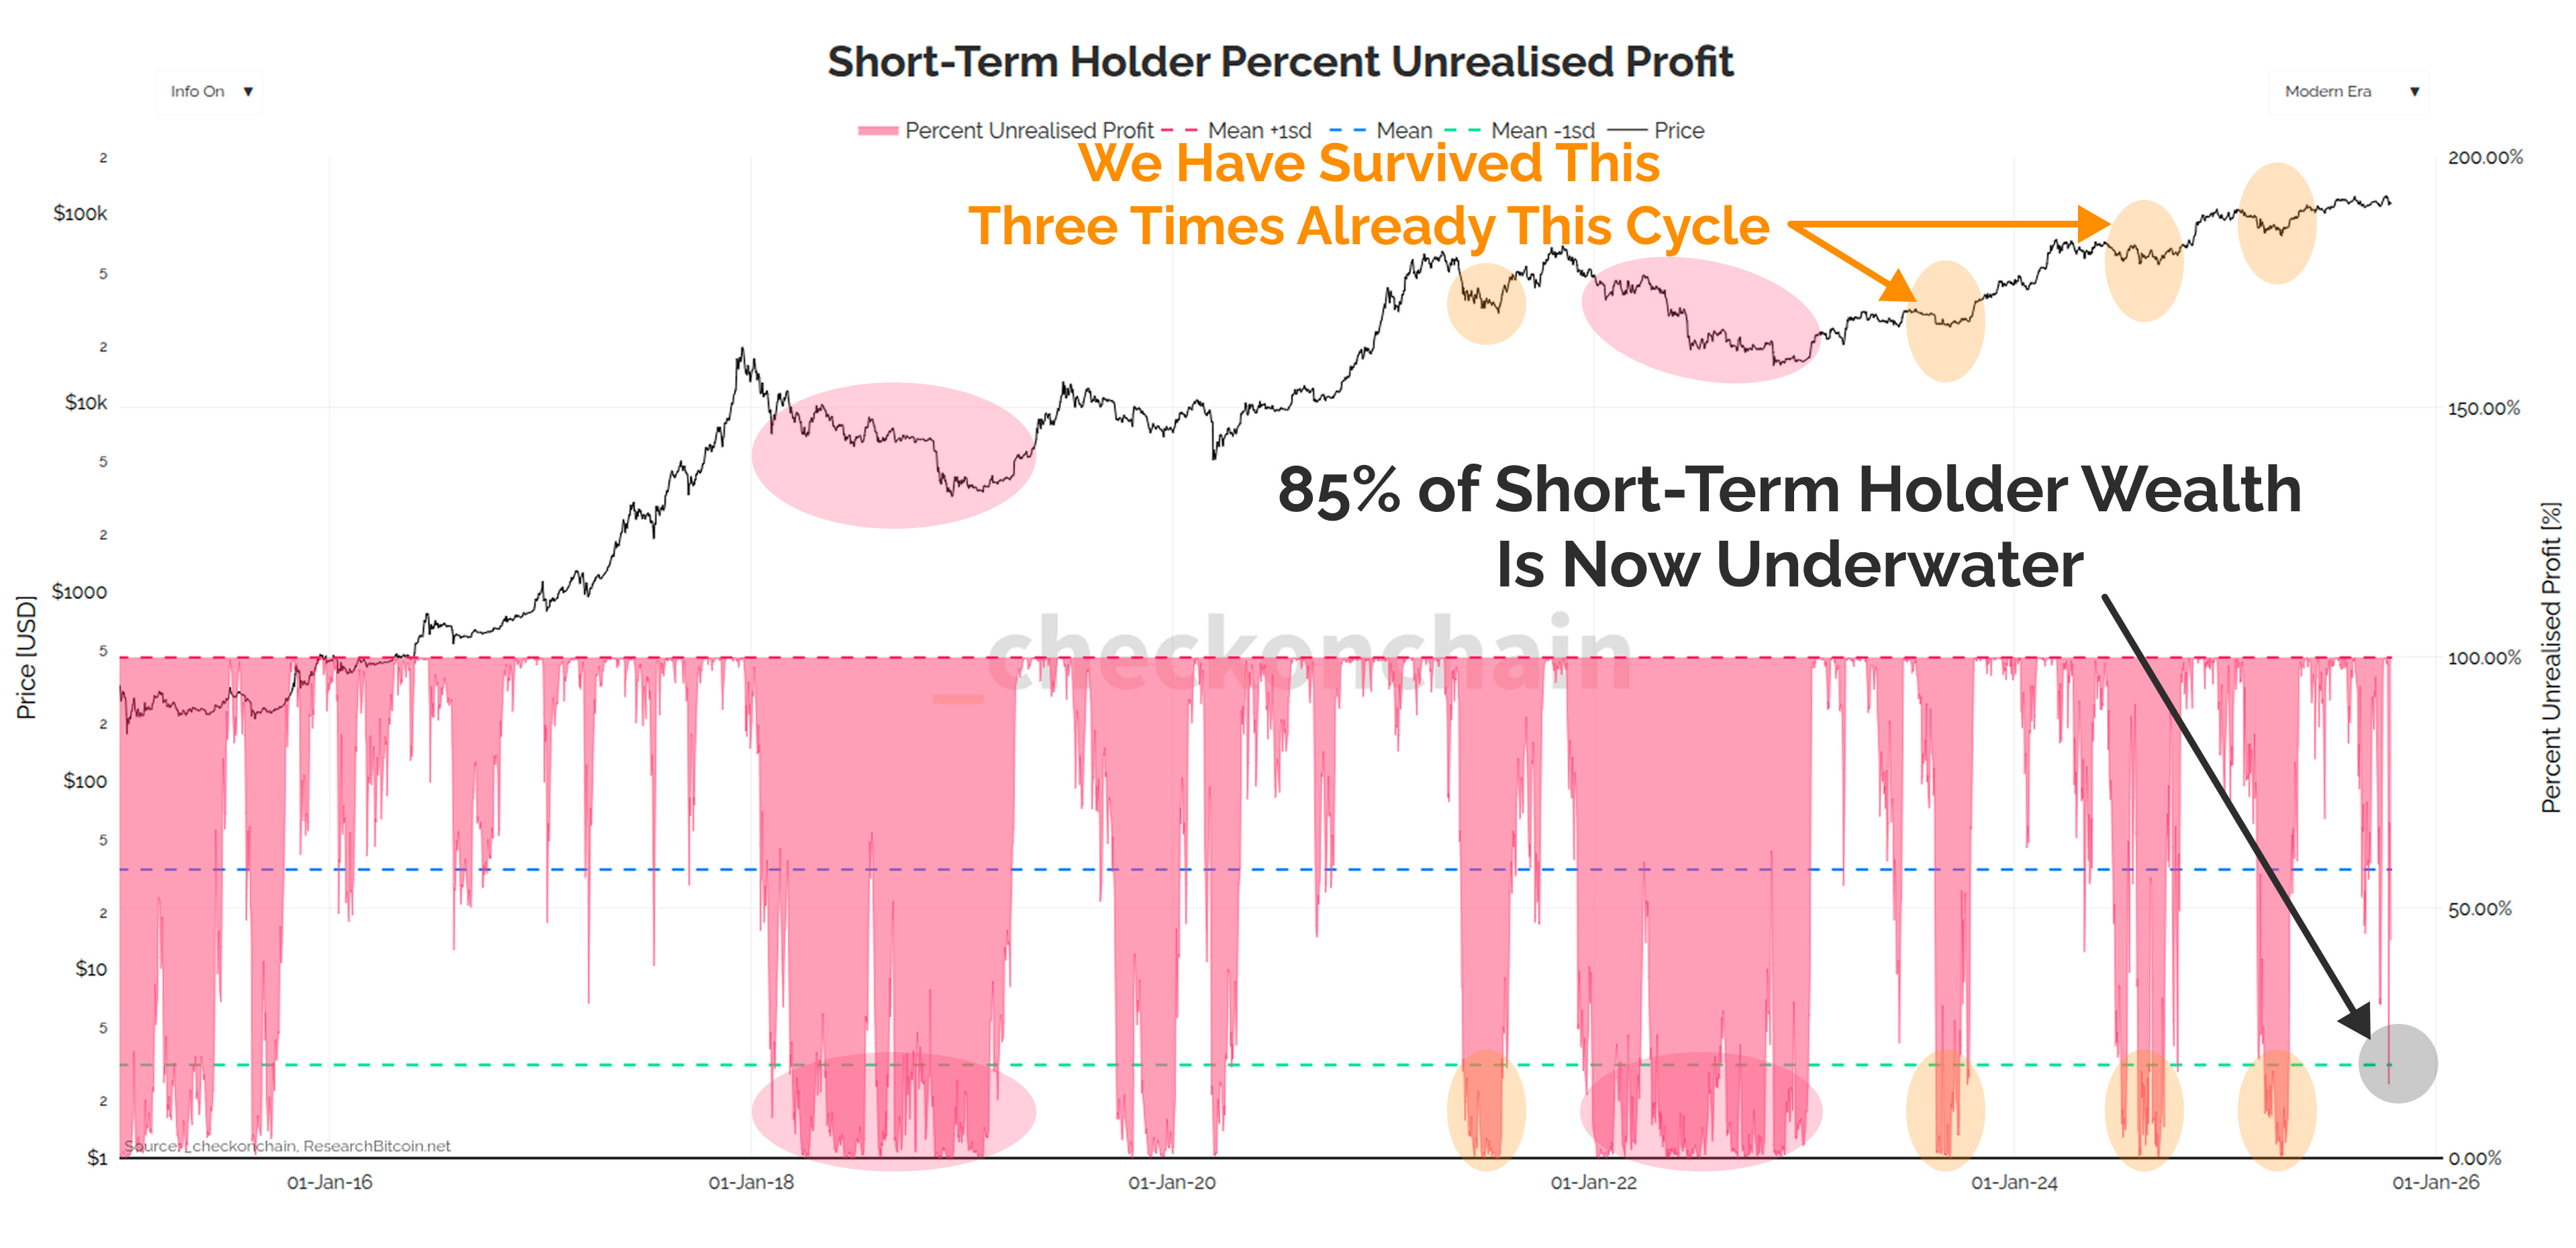
On an unrealised loss basis, 85% of Short-Term Holder wealth is now held in loss.
As is a common theme throughout this piece, we have recovered from such levels a few times already this cycle, so the damage is NOT bad enough yet for me to call a strict bear market.
However, it doesn’t take much imagination to see how things could devolve into one from here.
Mood Momentum Fades
As we all know, this cycle has been markedly different to previous ones, defined by lengthy periods of chopsolidation, and a reset of investor expectations.
Historically, I have tracked how MVRV trades relative to its 1yr moving average, based on the following ideas:
MVRV describes our collective unrealised profit, which is synonymous with our collective bullish or bearish mood.
By comparing MVRV to its 1yr average, I am trying to compare our mood today, to our baseline mood over the last year.
When MVRV drops sharply below the 1yr average, it signifies our portfolio returns, and our mood today is significantly worse than that ‘recency bias’ benchmark.
This forms a sort of ‘mood momentum’, and given how this indicator is currently trading, I think it adequately describes the feeling we all have today.
I’m not outright bearish…but 2025 performance sure hasn’t been anything to brag about.

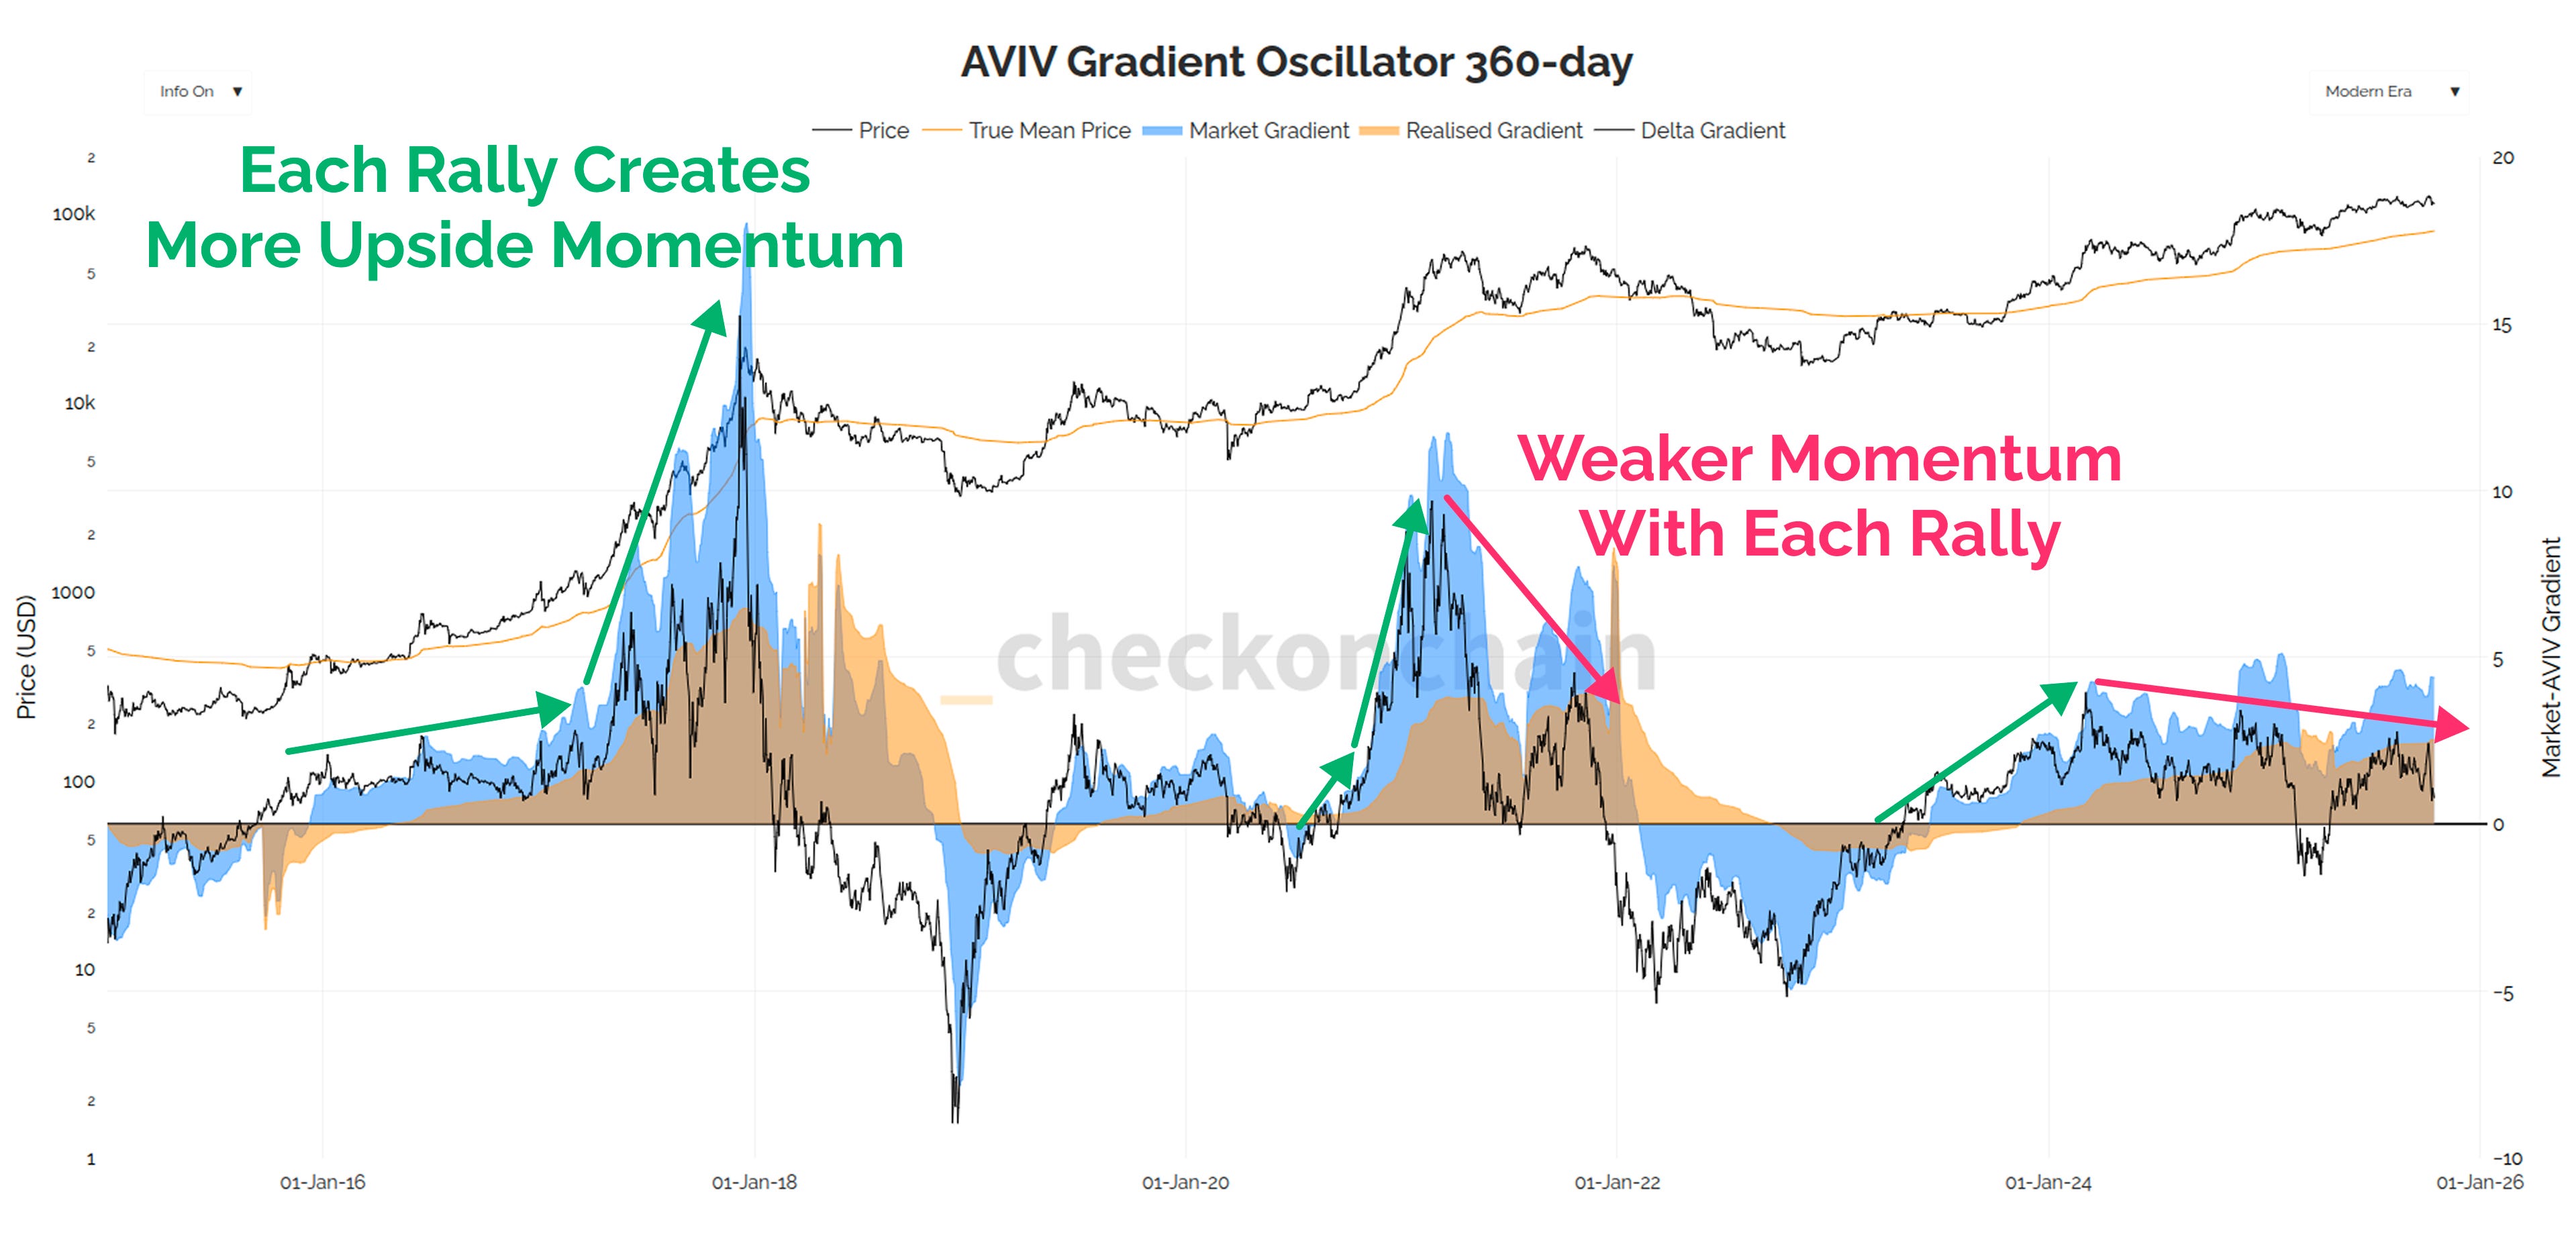
We can also see slowing momentum in my Gradient Oscillators, which can be interpreted as follows:
In a bull market, price should rise faster than capital inflows, signalling a ‘supply shortage’, and leading to higher and higher peaks in the black indicator line.
In the instance capital inflows are large, but price is stagnant, it suggests a lot of sell-side pressure, which slows momentum, and leads to lower peaks over time.
The version below uses the longest look-back-window of 360-days, and it should be no surprise to any of us that momentum in 2025 has been slower than it was in 2024.
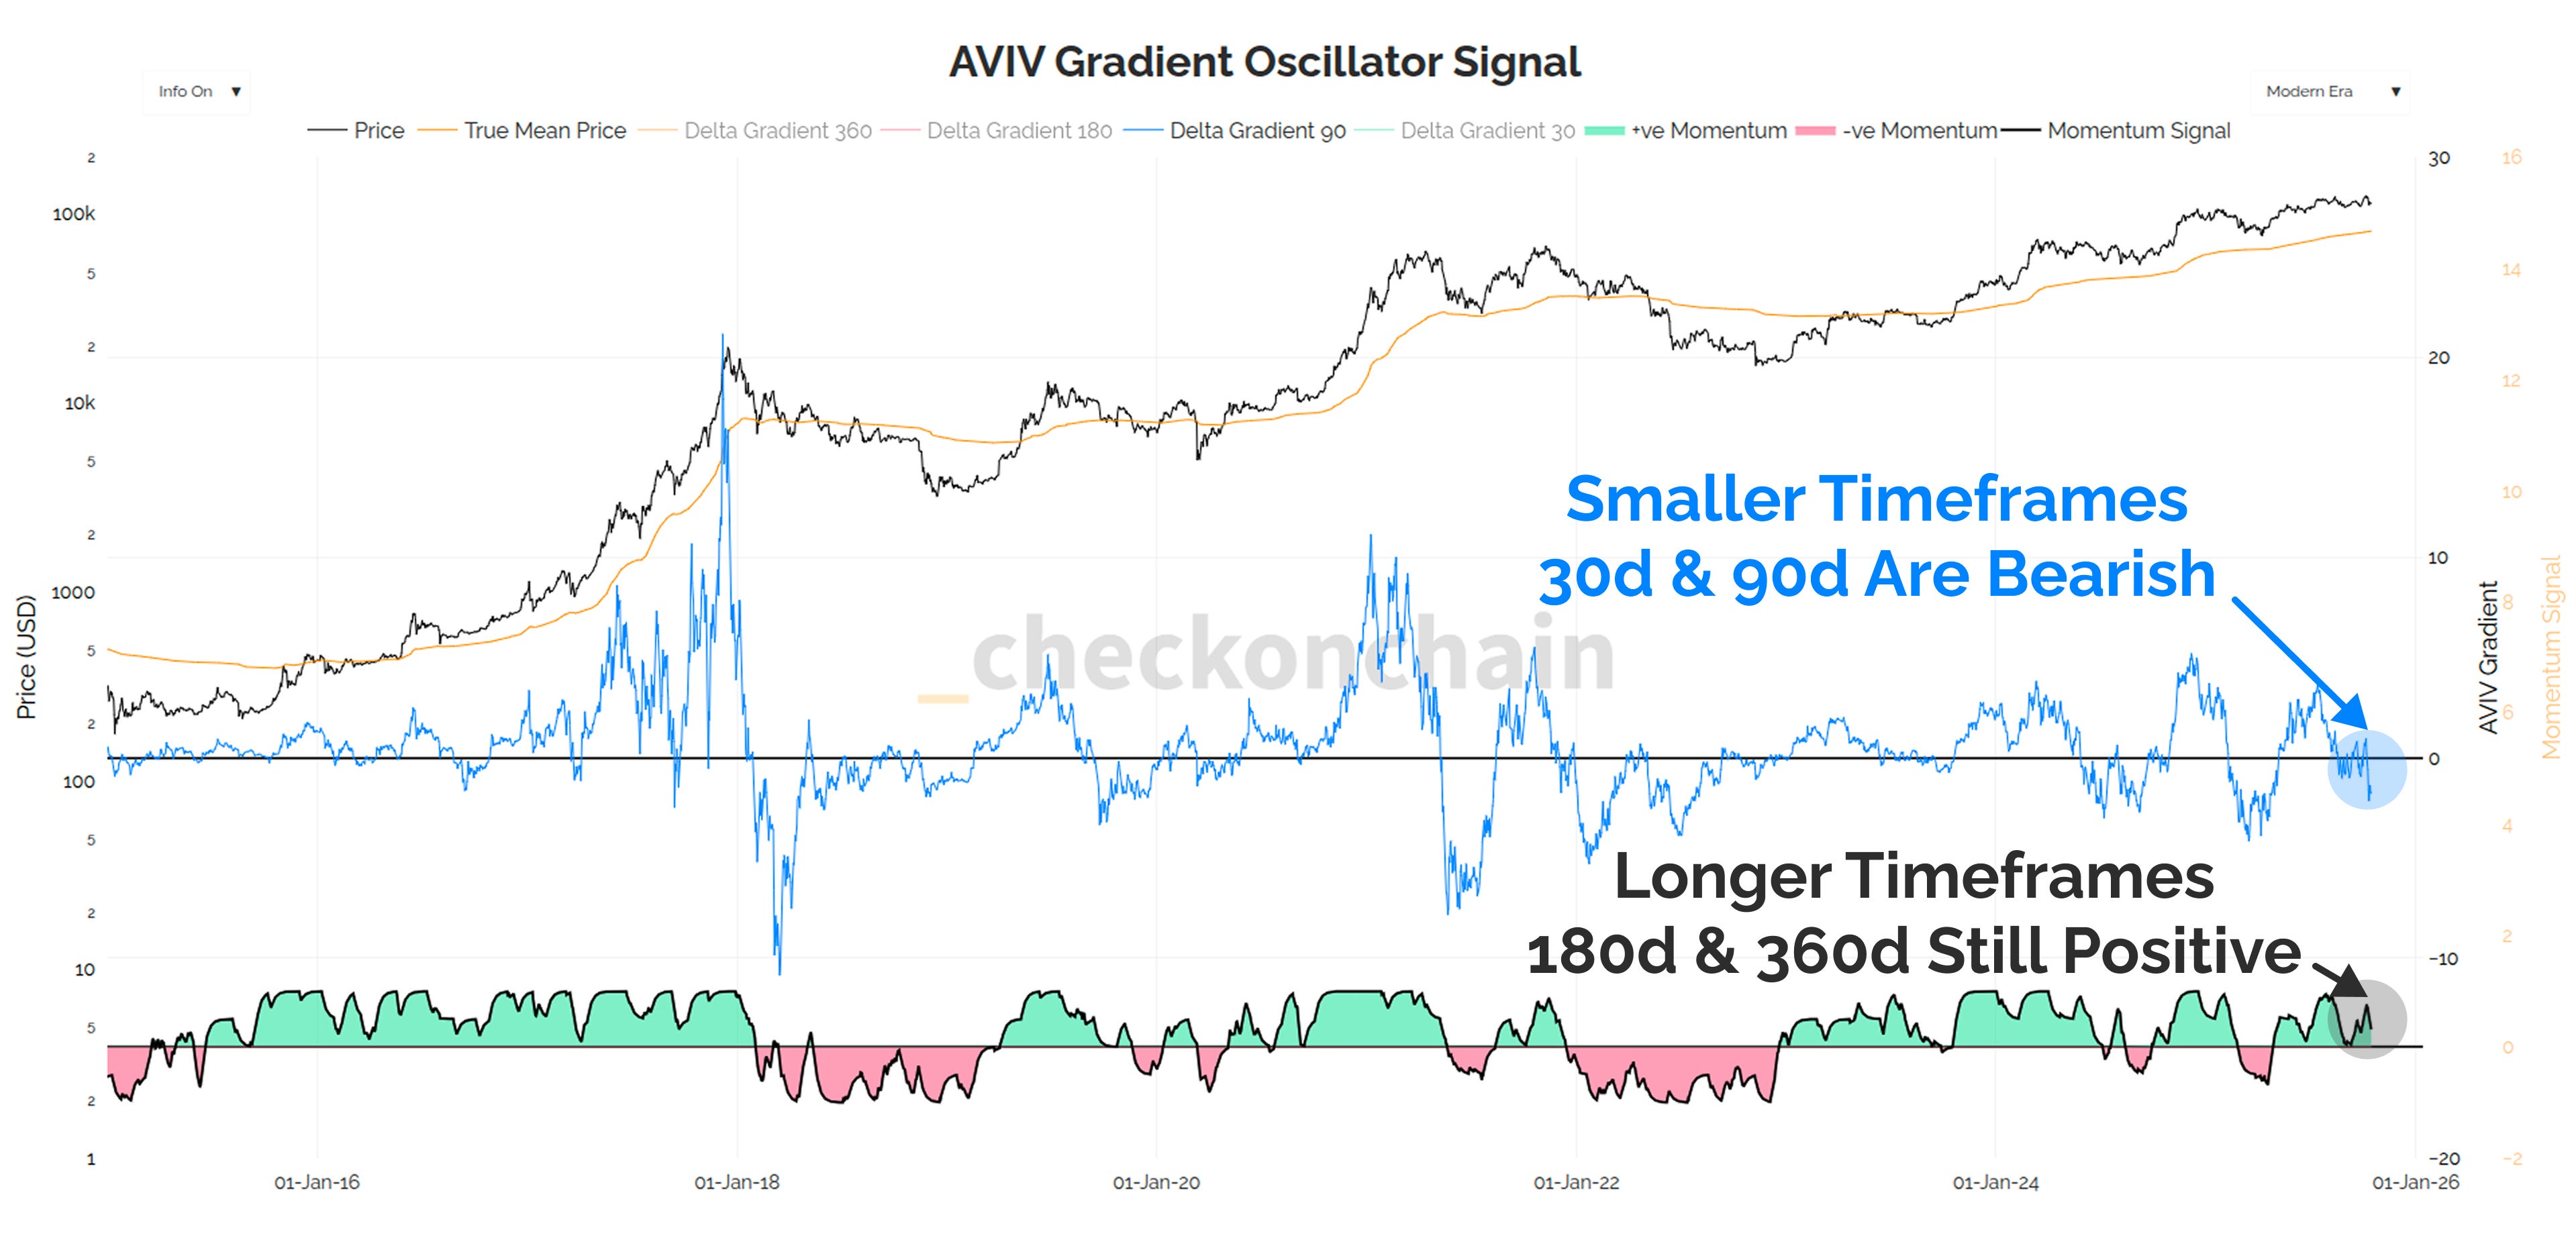
Now with that said, both of the slower, but larger time-frame versions of this chart (the 180-day and 360-day) are still positive (above the zero line). The faster, but noisier 30-day and 90-day variants are signalling negative momentum.
In aggregate, we have the faster two of these momentum indicators in bearish territory, and a softening in the two slower ones.
We’re not in an outright bear yet, but the current trajectory certainly isn’t the hottest after last week’s deleveraging event.
Last Drinks
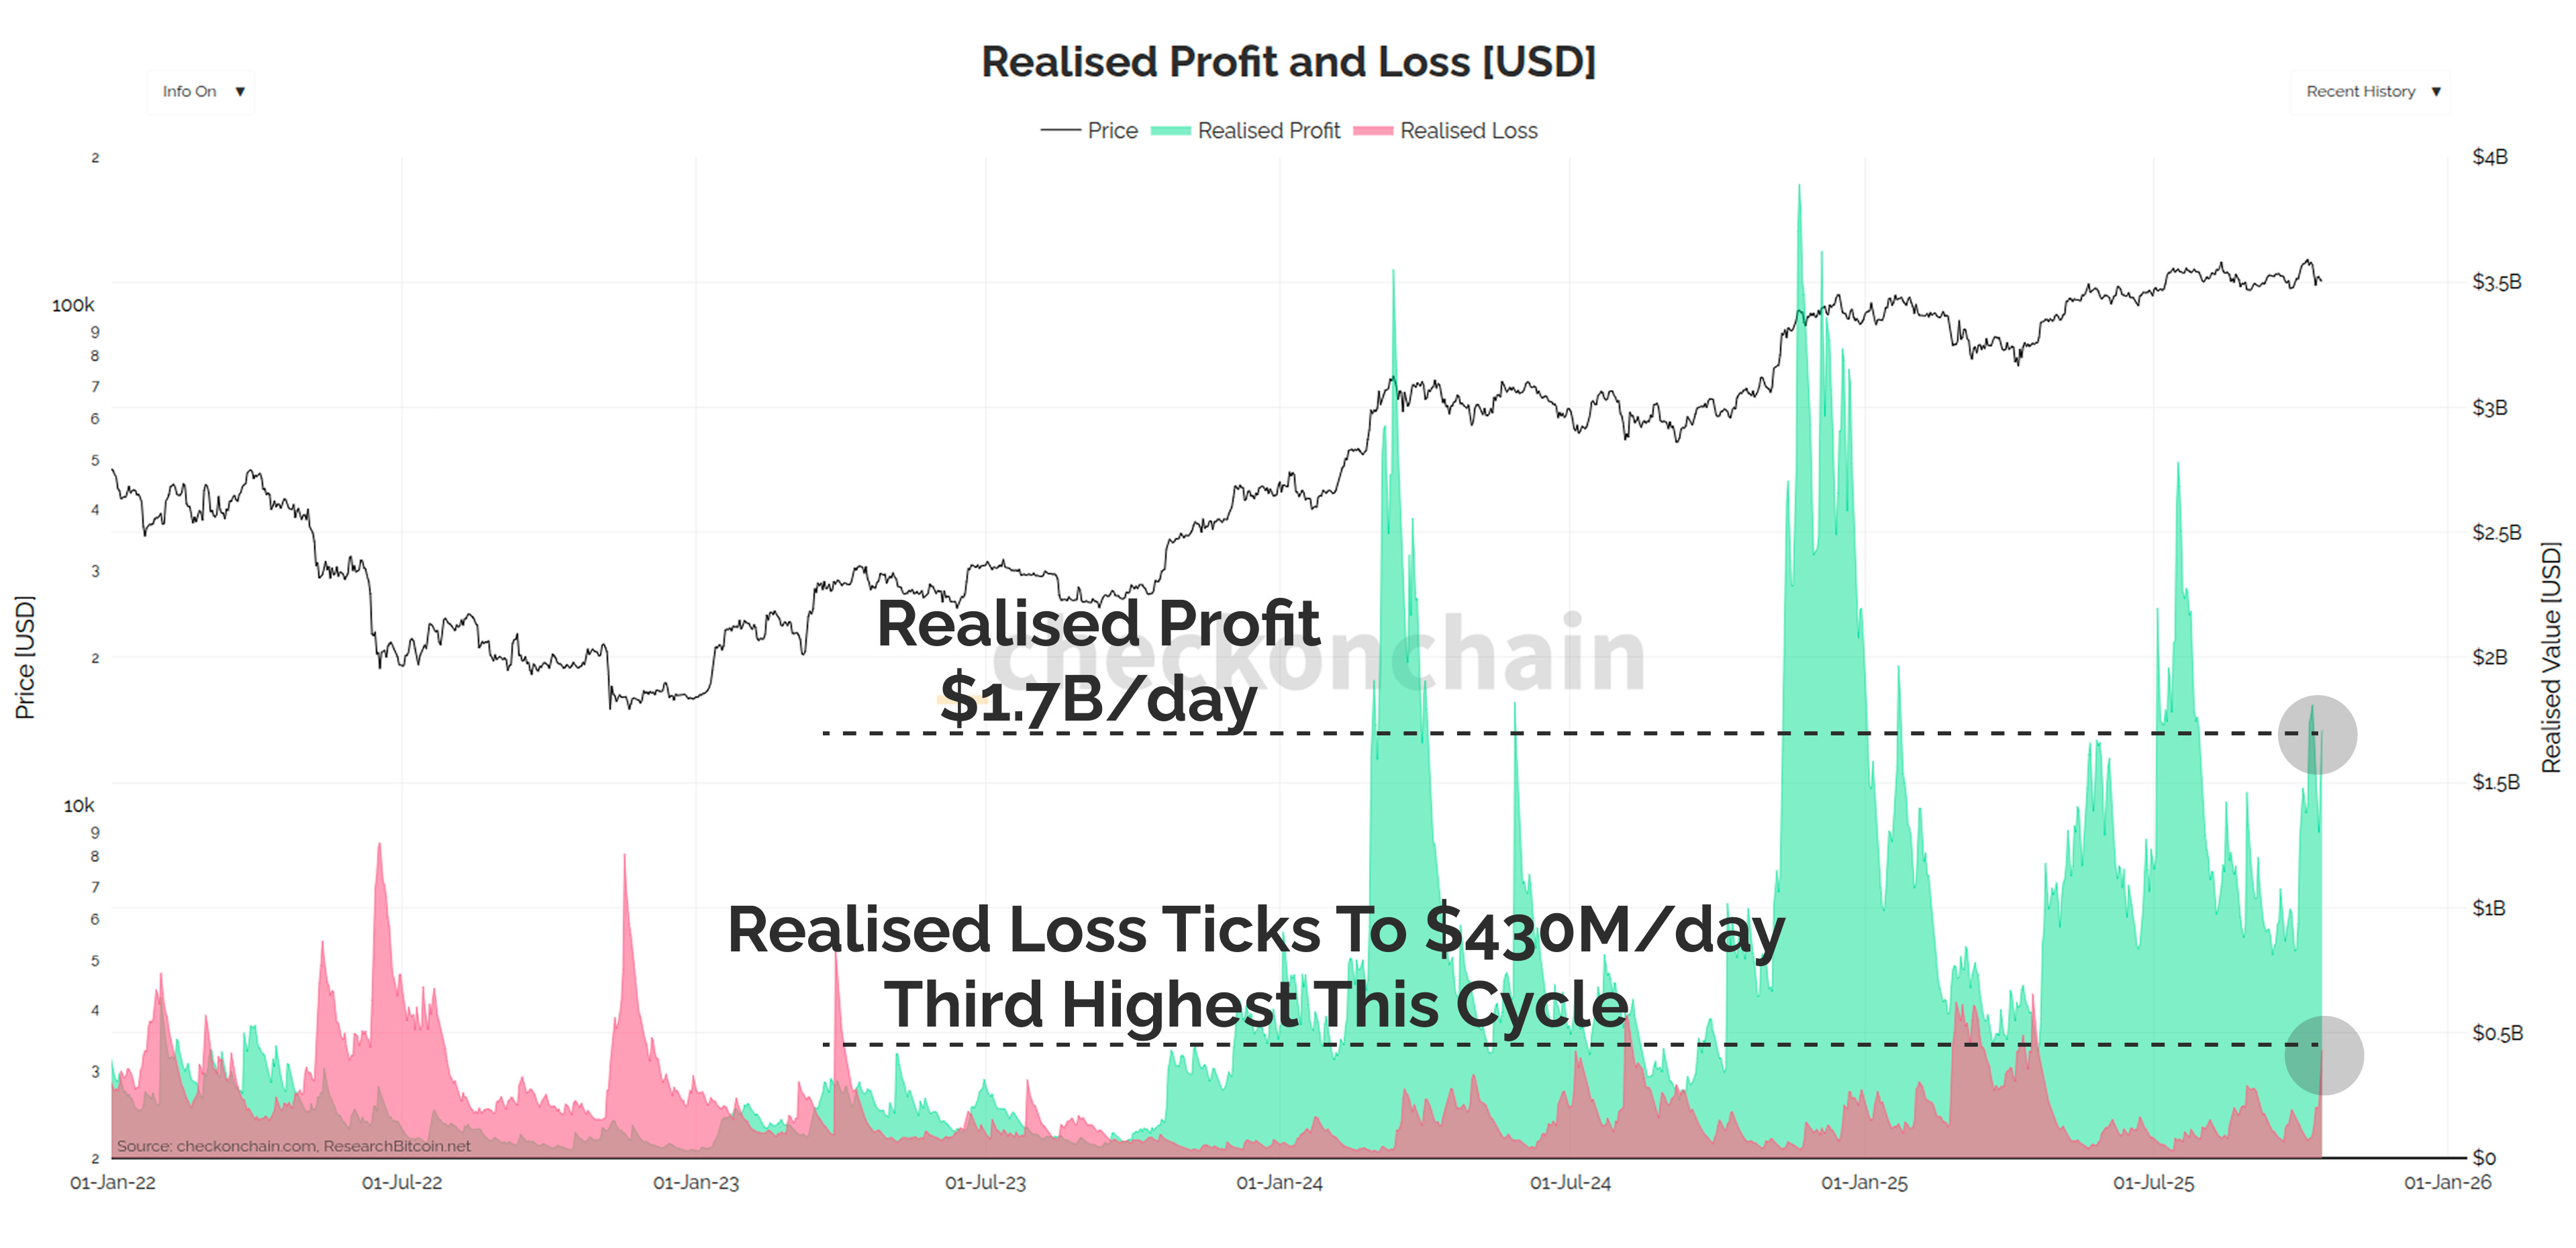
To close out the bear case, I want to dive deeper into sell-side pressure, and this includes both coins locking in profit, and loss.
We still have a very significant volume of profit taking underway, currently sitting at a sizeable $1.7B/day.
We also have a meaningful uptick in realised loss, tagging the third highest level of the cycle so far at $430M/day.
The losses make a lot of sense to me given the recent sell-off event no doubt spooked a sub-set of investors. However, it is the sustained, and unrelenting profit taking that is of the most interest, because that may signal investors are de-risking their winning position into market weakness.
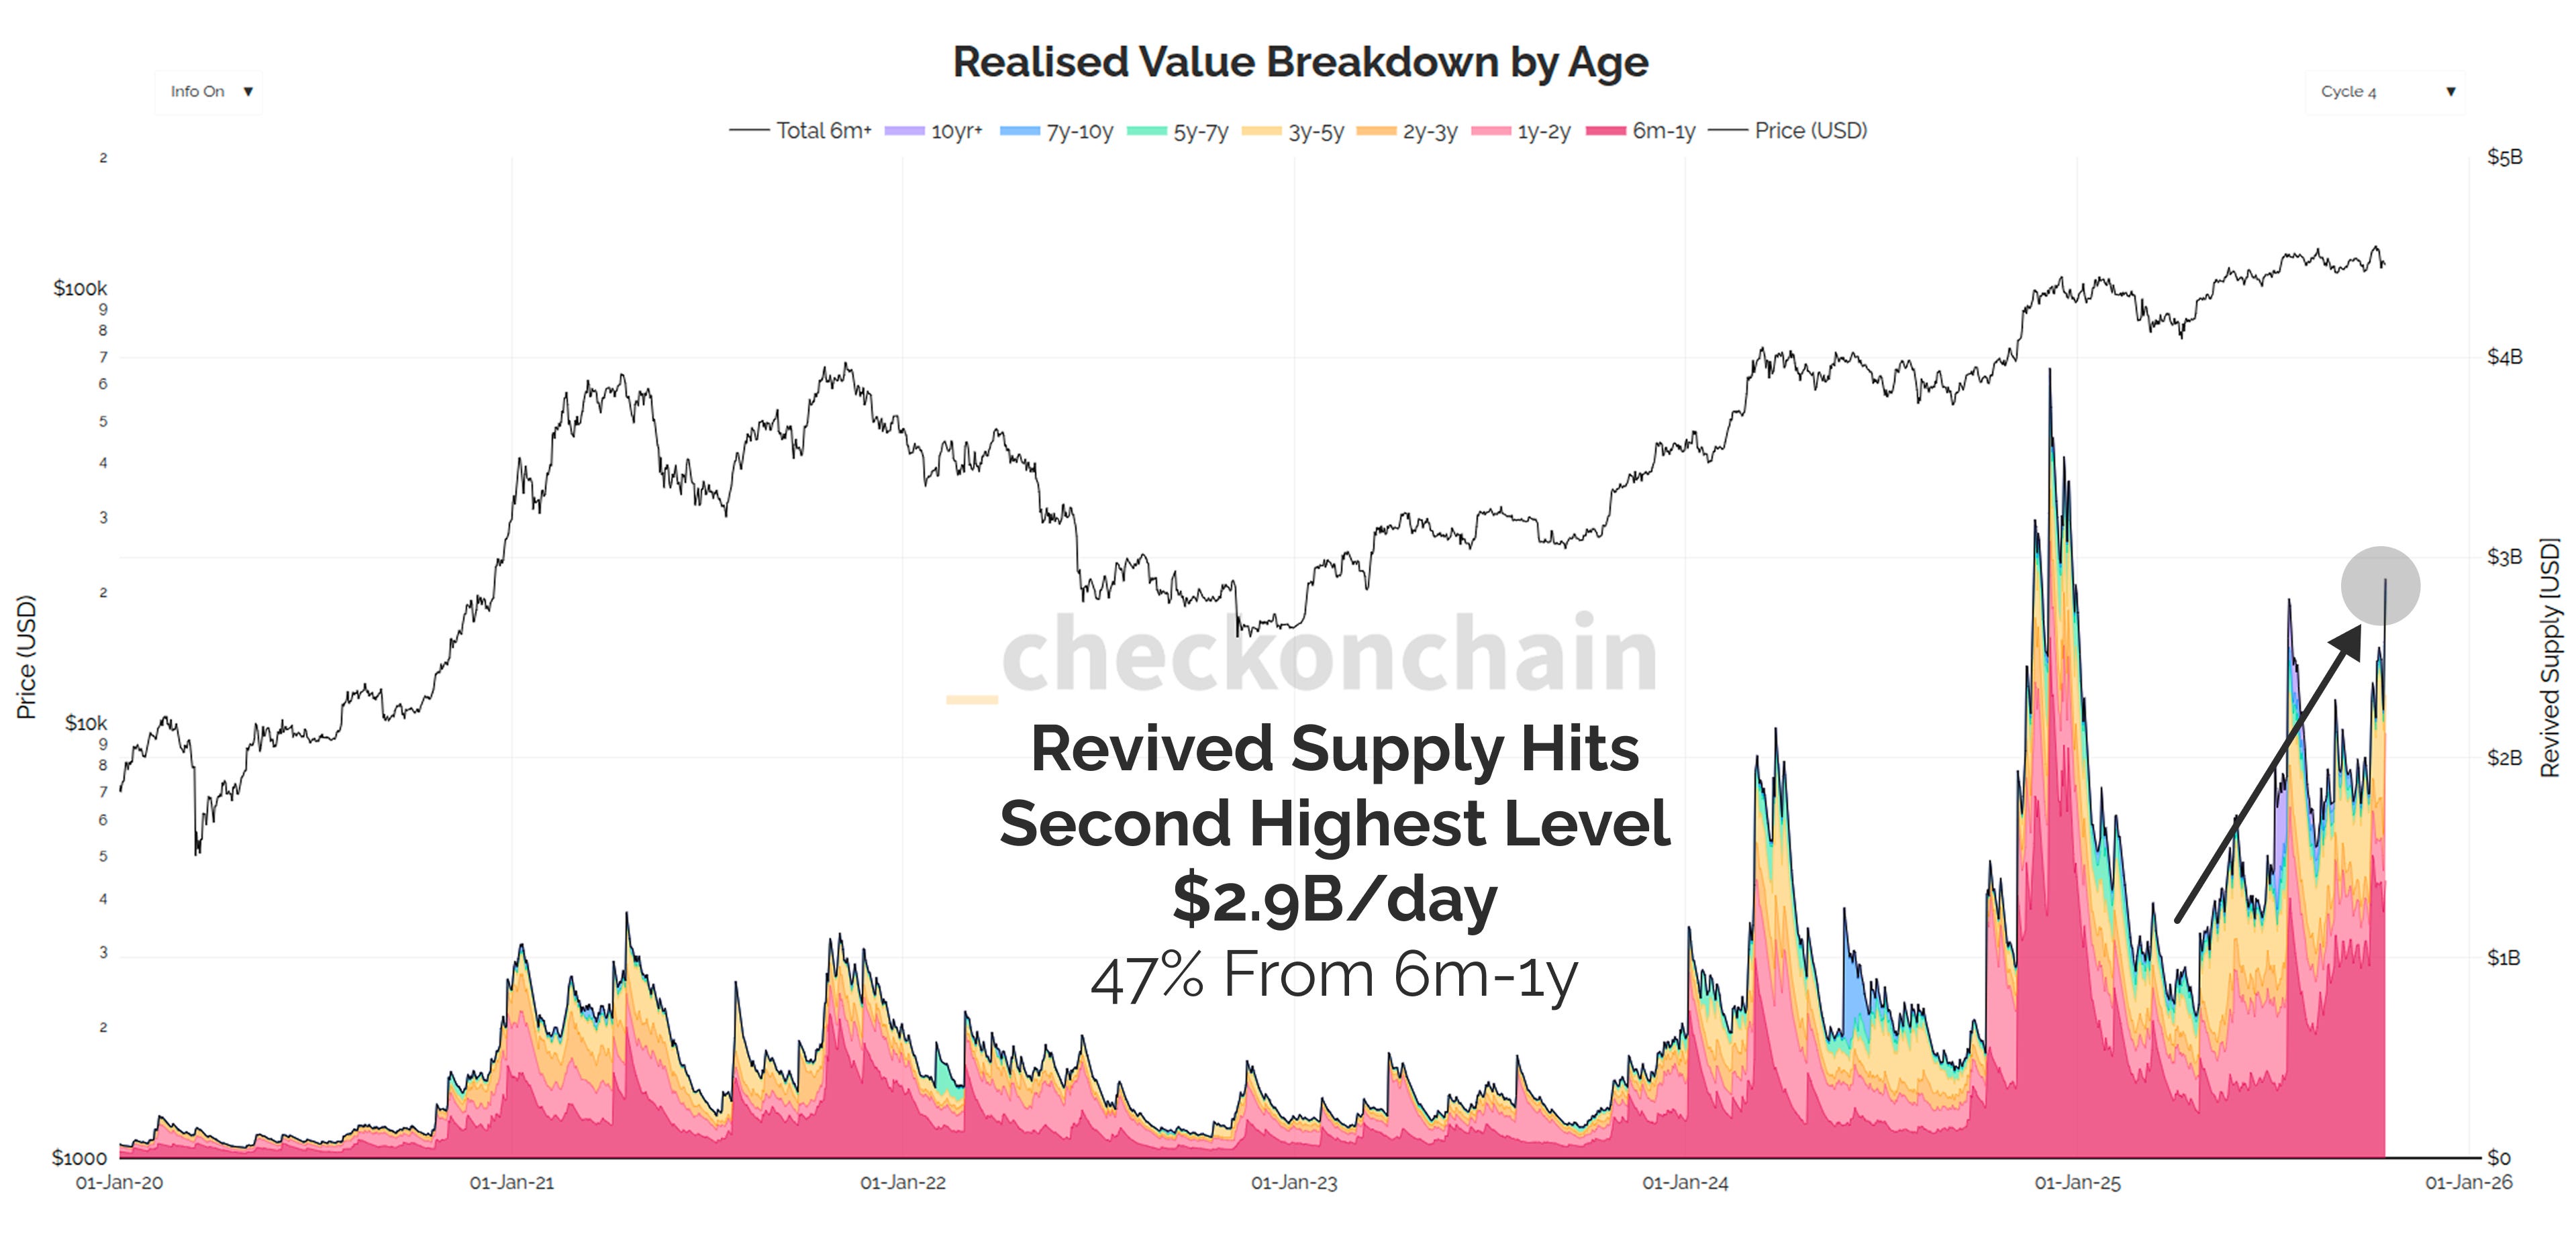
Revived supply just keeps ripping higher.
Folks on twitter love to pretend this is just a HODLer moving their coins into a different wallet…but are we really seeing $2.9 Billion in wallet management per day?
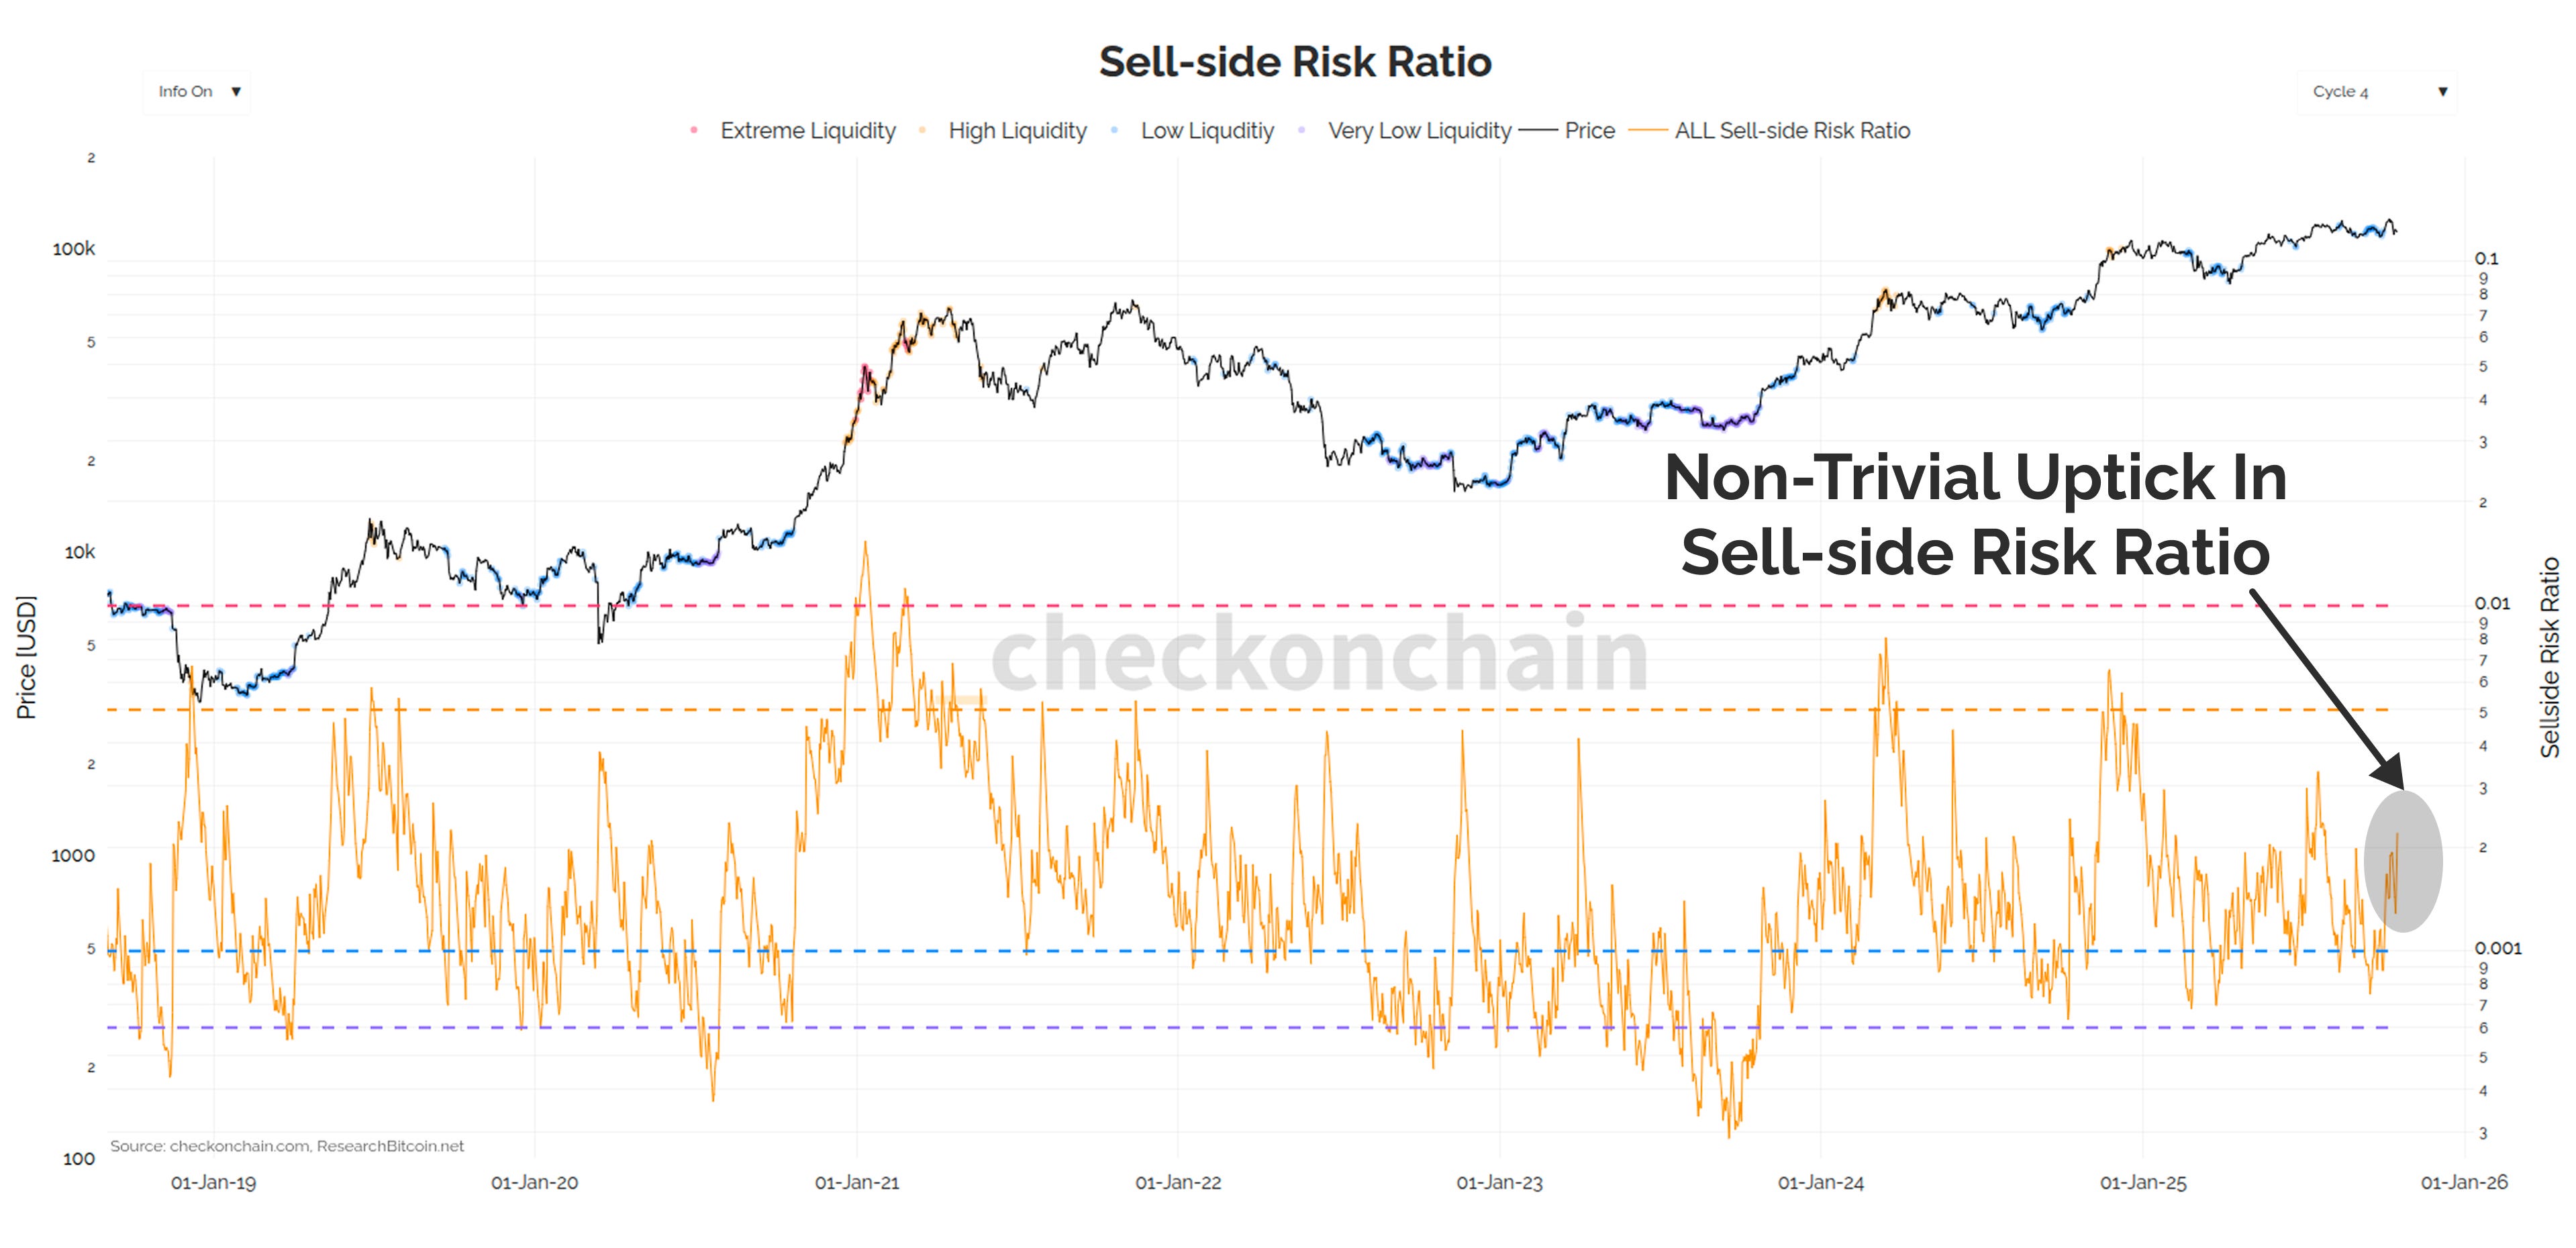
We’re experiencing the second highest peak in sell-side pressure of the cycle, and just under half of it is coming from 6m-1y old coins.
In my opinion, the heavy dominance from these ‘young Long-Term Holders’ is another piece of evidence that we have de-risking behaviour underway in response to market conditions.
We shouldn’t dismiss this magnitude of sell-side pressure, as it is causing the Sell-side Risk Ratio to tick higher and higher. This means that the combined volume of profit and loss being locked in is getting larger relative to the size of Bitcoin as an asset.
The bad news is this is still sell-side pressure, and it is meaningful in size.
The good news, at least to my eye, is I still don’t believe this resembles ‘I have lost my conviction in Bitcoin’ behaviour, but instead, ‘I am concerned about my portfolio value in the near term’.
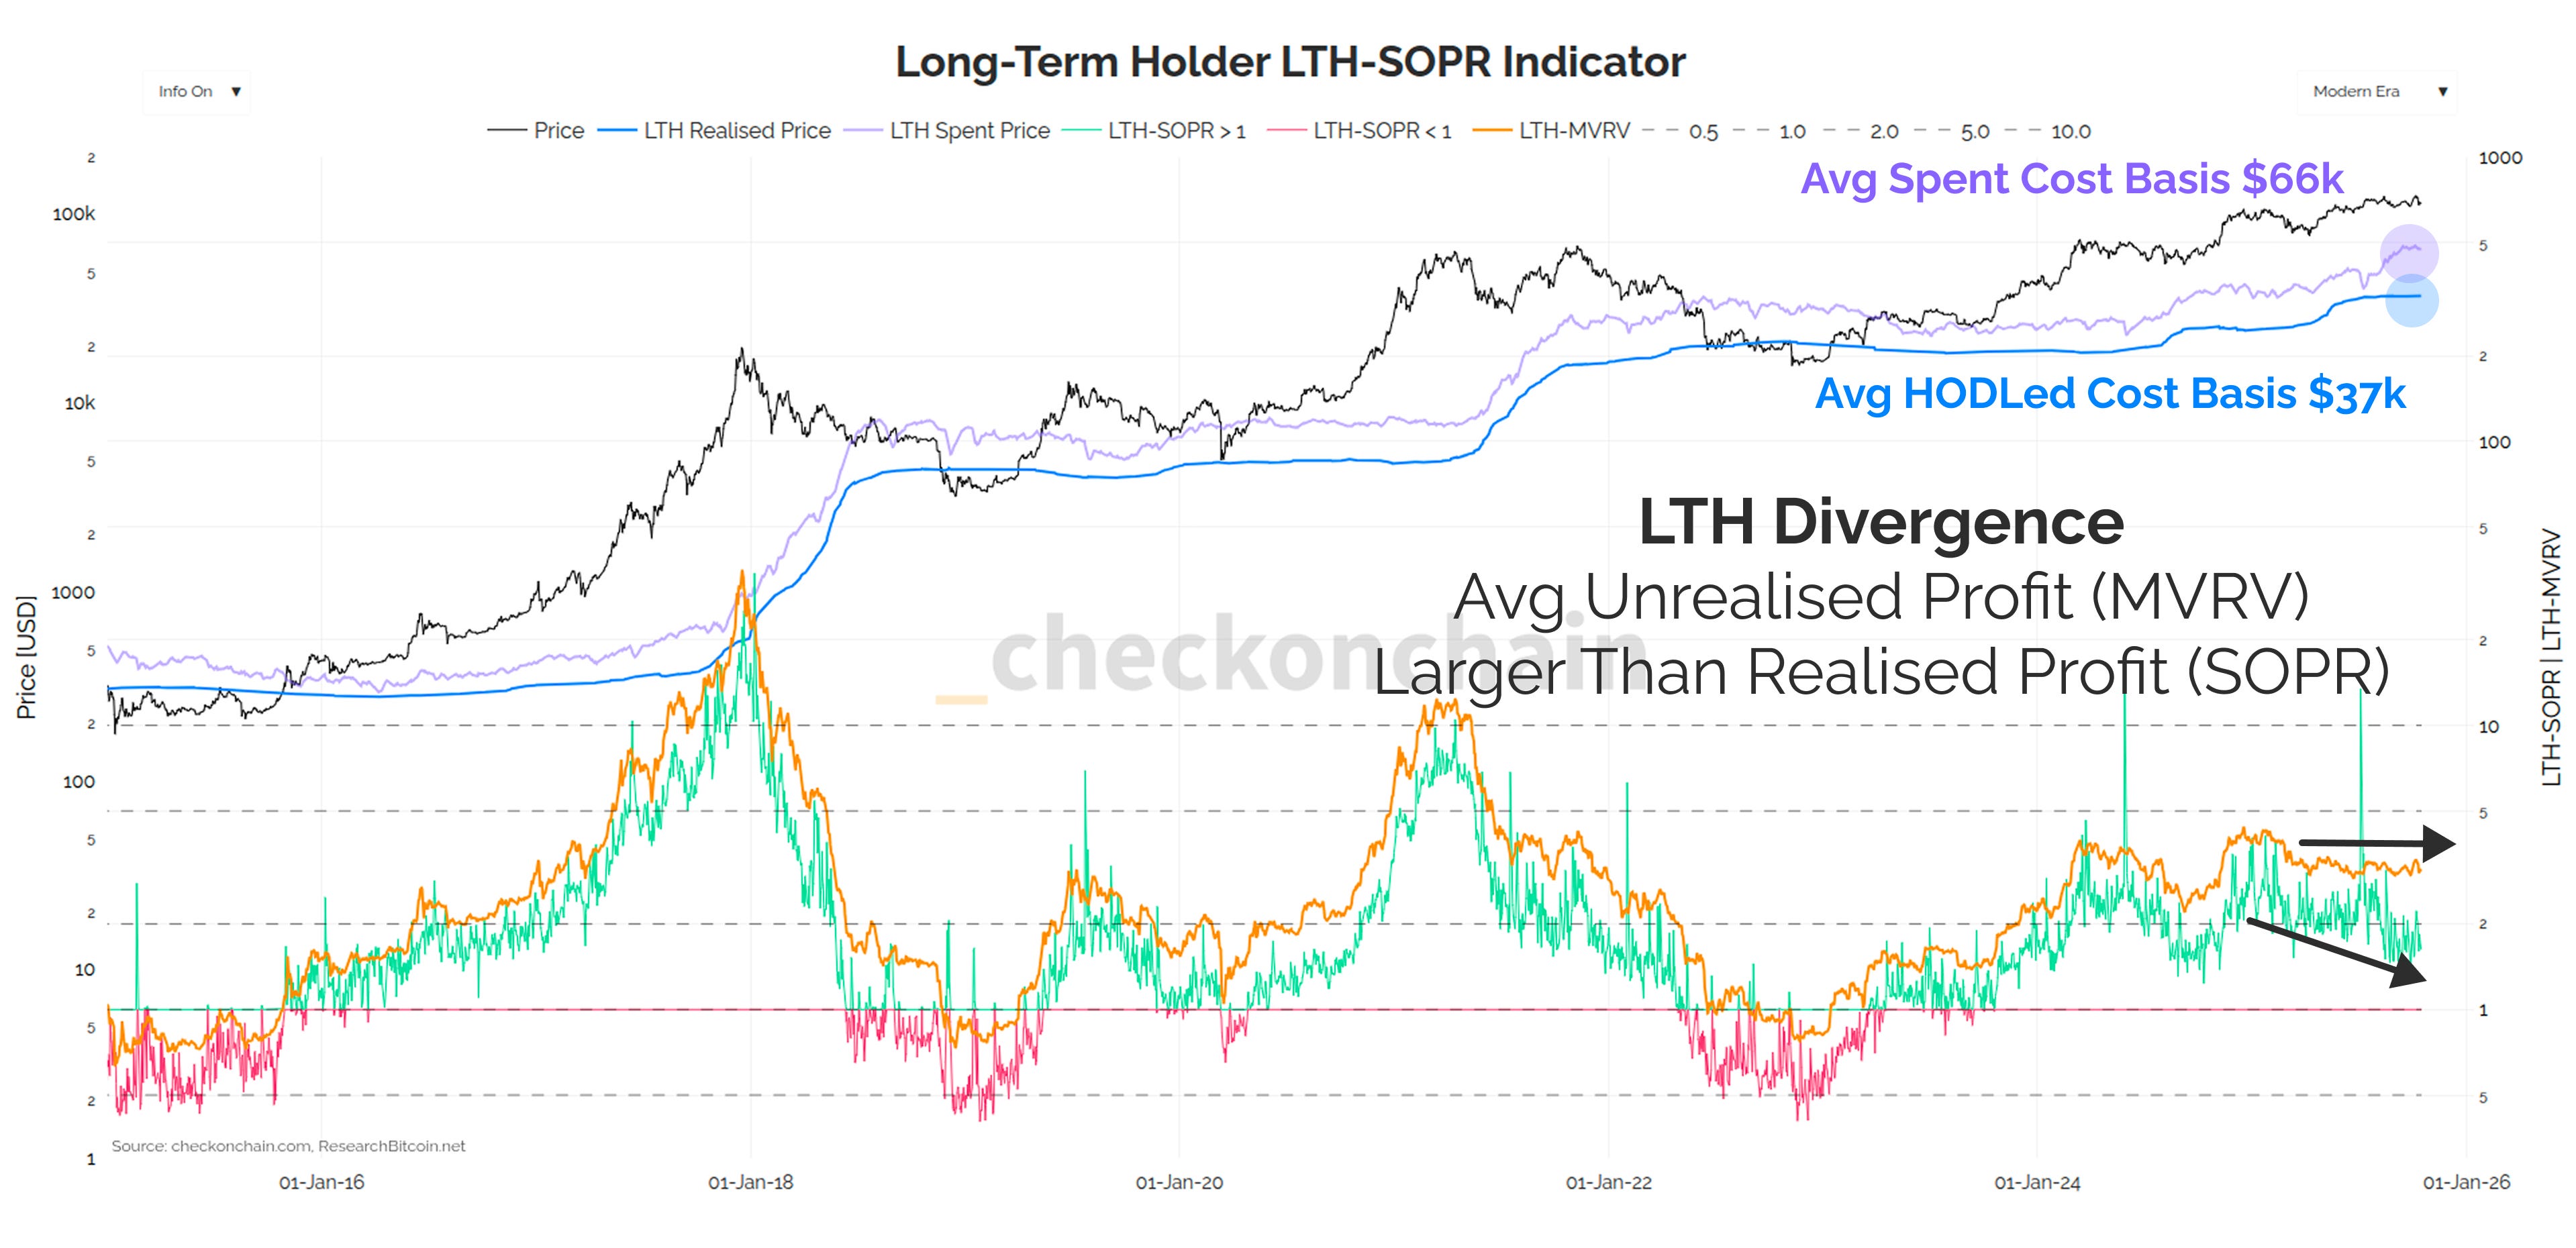
As a result of the heavier dominance of 6m-yr old coins, we are seeing a fairly uncommon divergence between MVRV, and SOPR for Long-Term Holders.
LTH-MVRV shows the average profit multiple held by HODLed LTH coins, with an average cost basis of around $37k.
LTH-SOPR shows the average profit multiple locked in by spent LTH coins, with a spent cost basis of $66k and rising.
In other words, the average Long-Term Holder who is selling right now, is someone who bought at a relatively high price during this cycle (aka swing/cycle traders).
However, as we know, one sold Bitcoin is still one sold Bitcoin. Sell-side at the current magnitude will require persistent and increasingly large demand to absorb it, should the pressure continue.
Concluding Thoughts
As you can probably tell, the bear case is actually a fairly robust one right now, and definitely more credible than the last two Devil’s Advocate pieces (2024 and 2025).
We have weaker momentum, a more price sensitive (almost ‘Top Heavy’) supply structure, and persistently heavy sell-side pressure.
Honestly, it’s pretty impressive Bitcoin is still trading at $110k.
Over the last few weeks, I have had a growing gut feeling that global markets are on the cusp of some kind of spasm. It is a hunch, but it is based on my aggregate absorption of information from podcasts, headlines, and my personal experience studying price and market conditions.
I don’t know if it will be cracks in the US economy, or an AI boom-bust, or another tweet from Mr President, but I am wary of ignoring these gut feelings when they show up.
If I was to summarise by current instincts and gut feelings:
The Bitcoin market is clearly weaker than we would like, and has a sufficient number of headwinds to take it seriously.
Bitcoin isn’t strictly in a Top Heavy condition, and the damage isn’t as bad as it was in the 2024, nor 2025 corrections. That said, the journey between ‘we’re ok’, to ‘it’s a bit of a shitshow’ is in my opinion a quick one, being a sell-off from $110k to $95k, or below.
I don’t believe Bitcoin is weak because investors don’t like Bitcoin. I actually think Bitcoin is sending a signal that economic / liquidity conditions are not as rosy as many believe.
It feels to me like the market is looking for any excuse to flush out some excesses, perhaps because AI is running too hot, or perhaps there is simply too much uncertainty in the system.
Gold has already told us the trade-after-the-trade is debasement of fiat, and none of this changes the macro reason I hold yellow metal and orange internet coins.
Bitcoin might just be telling us the road between here and there is a bit uglier than ‘Up-tober’ might suggest.
We absolutely could recover from here, and make no mistake, there is every chance we sell-off, and then rip- higher off the back of a short squeeze…
…But I think it would probably require a ‘down to go up’ V-shape recovery scenario, and the market will have to convincingly clear $118k before I take off my cautious goggles.
Check the HODLer remains optimistic, but Check the Analyst is increasingly cautious about the current market conditions. If we’re destined to fall into a bearish trend, I don’t expect it to be a -75% bloodbath like prior cycles. Check the HODLer is a happy stacker the further we fall below $95k, and I’ll be taking nibbles between here and there.
The onus remains on the bears to prove their case…but after this study, I think it would be a mistake to not take their current threat seriously.
Check the Investor: I wanted to close with what I have personally done with my own portfolio as of yesterday, given this current market setup. My hope is that it will help illustrate how I am feeling about the current market in a more practical sense (but certainly NOT a recommendation, just being very transparent):
I am NOT selling my Bitcoin. I don’t care to trade my BTC, even if we have hit a cycle peak. The reason is even in the bear market scenario I talked through above, once I factor in taxes, it just doesn’t make any sense. I don’t think Bitcoin will fall enough to justify the stress, anxiety, and certainly not the tax burden.
I thought about trimming 5-10% of my gold, but decided against it. I do believe gold is soon to set a meaningful interim peak, and has run too far too fast. Whilst having extra cash would be nice, I also don’t expect a ‘tax efficient’ pullback in the yellow metal.
The-trade-after-the-trade is still debasement and fiscal dominance. Nothing about this market structure changes my macro view on where this is all going. I remain a structural buyer of both gold and Bitcoin on any major dips. Dips and bears are opportunities, so long as you’re not surprised by their arrival.
I did sell my personal MSTR holdings at $300. MSTR was always my risk position at 2% of my portfolio, and if my case above is true, that thesis is wrong. Whilst I took a minor loss on this trade (again), I decided that this was going to be my source of liquidity.
Since I don’t think Bitcoin falls that far, MSTR probably won’t totally implode, but the down move will be very volatile. As a result, I actually opted to allocate half of my MSTR sale into WNTR as a hedge, which is a short MSTR options ETF (basically the inverse of MSTY, covered here).
If the MSTR price trades down -25% to -30% for example, volatility will be higher, and this ETF would pay larger dividends (sat stacking cash).
If Bitcoin reaches a bear market floor, I will sell all of the WNTR and buy spot Bitcoin, to position for the next phase of the bull.
If Bitcoin and MSTR rip higher, I will sell all my WNTR hedge once Bitcoin clears $118k. WNTR will take a large loss in this case, but that is the price of hedging (and the rest of my wealth will do just fine).
My experience with MSTY was that it is a horrible investment, namely because it gets slaughtered during chopsolidation (which is the norm). On the downside however, WNTR is interesting as a targeted hedge against my predominantly Bitcoin portfolio during what could be volatile and stormy seas ahead.
If Bitcoin sells off, MSTR will get rekt, and WNTR will do well.
If Bitcoin rallies higher, I take a loss on my hedge, and move on.
I thought about using put options, but I wanted to test this thesis out.
I expect to lose money on this trade, because every single time I touch something MSTR related, this has been the result. However, Check the Investor is a student of his losses, and I always learn the most from my mistakes. Hopefully, this is where I buck the trend of losing positions (or perhaps I will learn a new lesson).
Remember, dips and bears are opportunities for those that are prepared, and not surprised by their arrival.
Thanks for reading,
James