

Why HODLers Put Floors In
Bear markets are a gruelling process where coin ownership rotates back to high conviction, strong handed holders. We can use this idea to construct a powerful price model for bear market floors.

G’day Folks,
Earlier this week, we had a fantastic question dropped into our Subscriber chat, and it really got my onchain nerd gears turning.
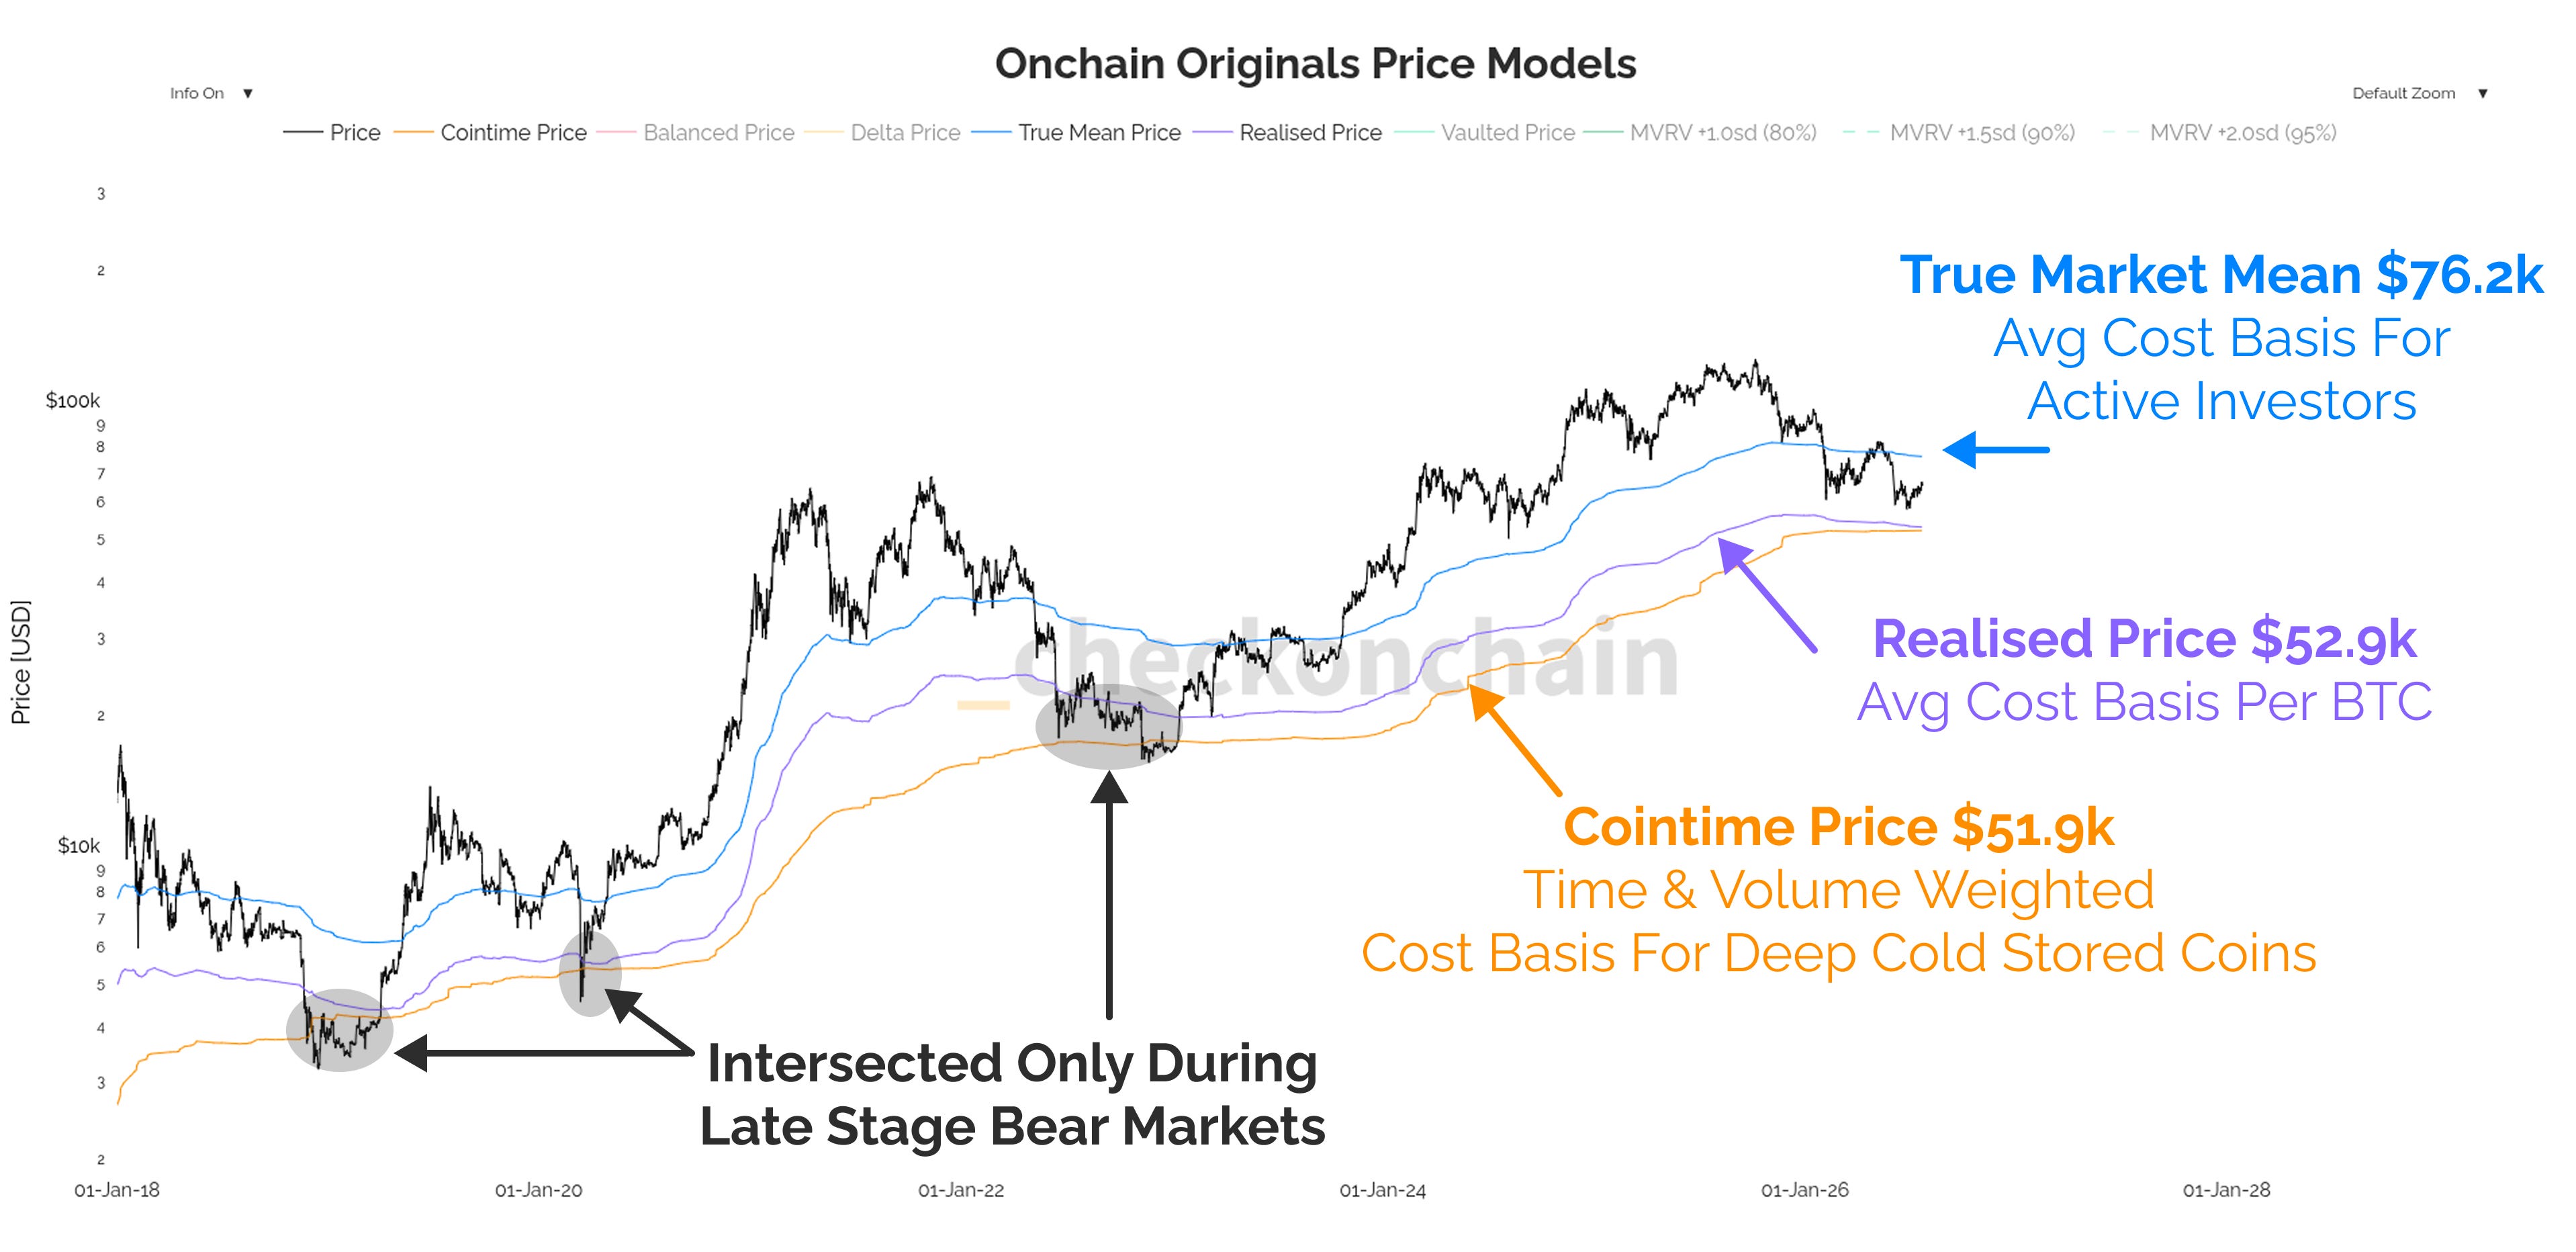
The question was asking what the significance is of the Cointime Price and Realised Price almost intersecting around $52k.
Does this tell us something about the role Long-Term Holders play in setting market floors?
Does it indicate that Bitcoin has developed or lost monetary premium value?
Can we expect bear markets to be defended at higher levels?
Today’s piece is going to help subscribers think about these questions, and analyse why the Long-Term Holder cohort is arguably the most important to study at the current stage of this bear market.
Disclaimer: This article is general in nature and is for informational and entertainment purposes only, and it shall not be relied upon for any investment or financial decisions.
📈 You can find the charts from our articles on the Checkonchain Charting Website, and a guide in our Charts Tutorial Video.
Reintroducing Cointime Price
There are a few key points that Ian addressed in his question, which I will paraphrase:
Does Cointime Price crossing above Realised Price signal a more mature monetary phase for Bitcoin?
Are recent buyers such as ETFs and Strategy becoming more important than dormant buyers from prior years?
Does the implied change in coin activity suggest that a permanent repricing to higher levels has occurred in recent cycles?
In my opinion, the answers to these questions are Yes, Yes & No, and Yes.
I will also add, that my answer to those questions would remain the same no matter which part of Bitcoin’s history we were talking about.
Every market cycle, Bitcoin sees coins repriced to higher levels. We also see a maturing market landscape, with more people realising that Bitcoin is a sound asset which is here to stay.
Recent buyers are always more important than dormant supply, with the one exception being around market extremes (bull peaks and bear floors).
The reason the Realised Price reprices significantly higher every cycle is because dormant coins took profit, and a new buyer acquired them at higher prices.
The reason Cointime Price reprices significantly higher every cycle is because even top buyers eventually come around to respecting that much cheaper prices are likely now a relic of history.
We will return to explore these two price models later in the piece. For now, think about these two price models as follows:
Realised Price: Onchain value weighted average cost basis per unit of BTC in the supply (every coin is included).
Cointime Price: Onchain holding time and volume weighted average cost basis for the coins which refused to spend in both the bull and bear.
Coins Are Rocks
Many of you know that my background is in geotechnical engineering, which is anything to do with the ground (basements, tunnels, excavations, mines, etc).
As a Sydneysider in Australia, I have worked with my fair share of Hawkesbury Sandstone, which is a very beautiful, and very strong sedimentary rock. Sedimentary rocks are formed when layers of soil are deposited over one another by wind or water, with the lower layers being under more pressure than higher ones.
As the rock becomes exposed to the elements, the upper layers start to degrade from the effects of de-stressing, erosion and water pressure entering the cracks and joints that open up between sections of rock.

We can think about the dormancy of the Bitcoin supply in a very similar way.
More recently moved coins are more likely to move again, and represent almost all of the daily trade volume and network activity.
The older a coin is, the more likely it stays dormant. Coins from Bitcoin’s earlier years are rarely spent, and disproportionately come back to life during raging bull markets.
This chart shows the proportion of the ~20M circulating BTC based on the year when they last transacted. You can see how the 2009-2016 coins still represent around 18.2% of the BTC supply, but their proportional dominance decays over time (they are either spent into a new year, or ‘diluted’ by both those that are, and newly mined supply).
Modern supply (2023+) currently represents the lion’s share of the supply at 59.3%, whilst Bitcoin’s middle years (2017-22) are an additional 22.5%.
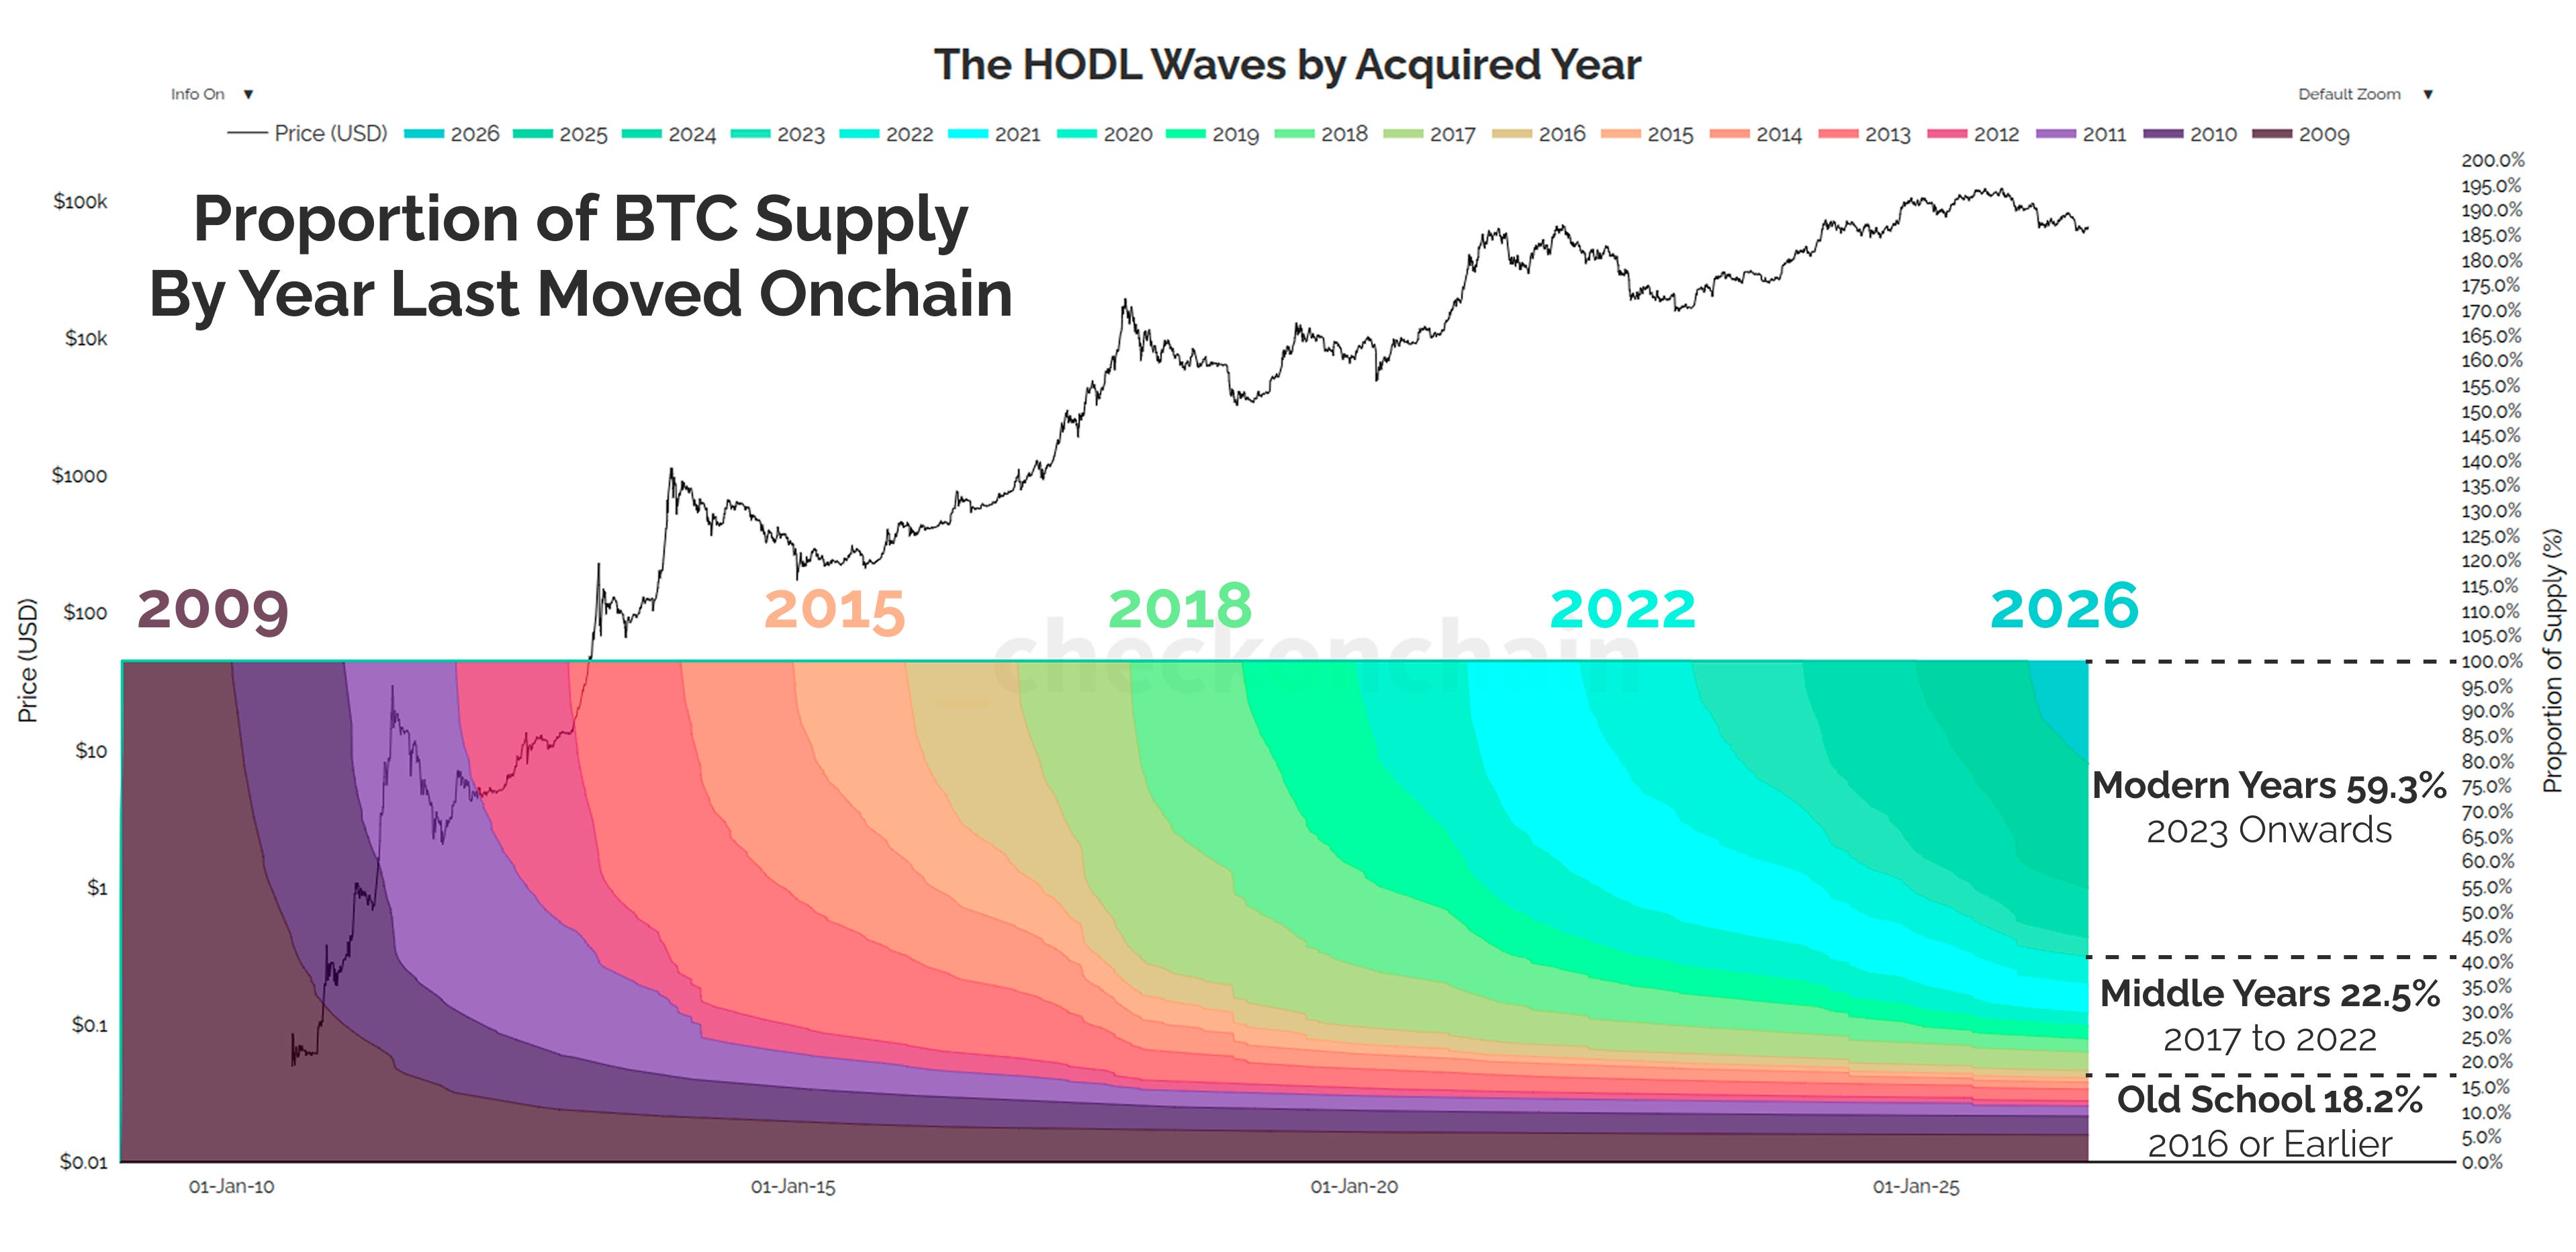
Whilst those coins from prior cycles represent a very meaningful chunk of the BTC supply, they were last moved at historically cheap USD realised prices.
Coins last moved before 2020 represent 27% of the BTC supply, but are less than 1% of the total realised capital invested in the network.