

Water At The Top Of The Wall
The Bitcoin bears have managed to drive the price down to $112k, putting 25% of the supply in The HODLers Wall underwater, but as yet have still failed to break the bull's first line of defence.

G’day Folks,
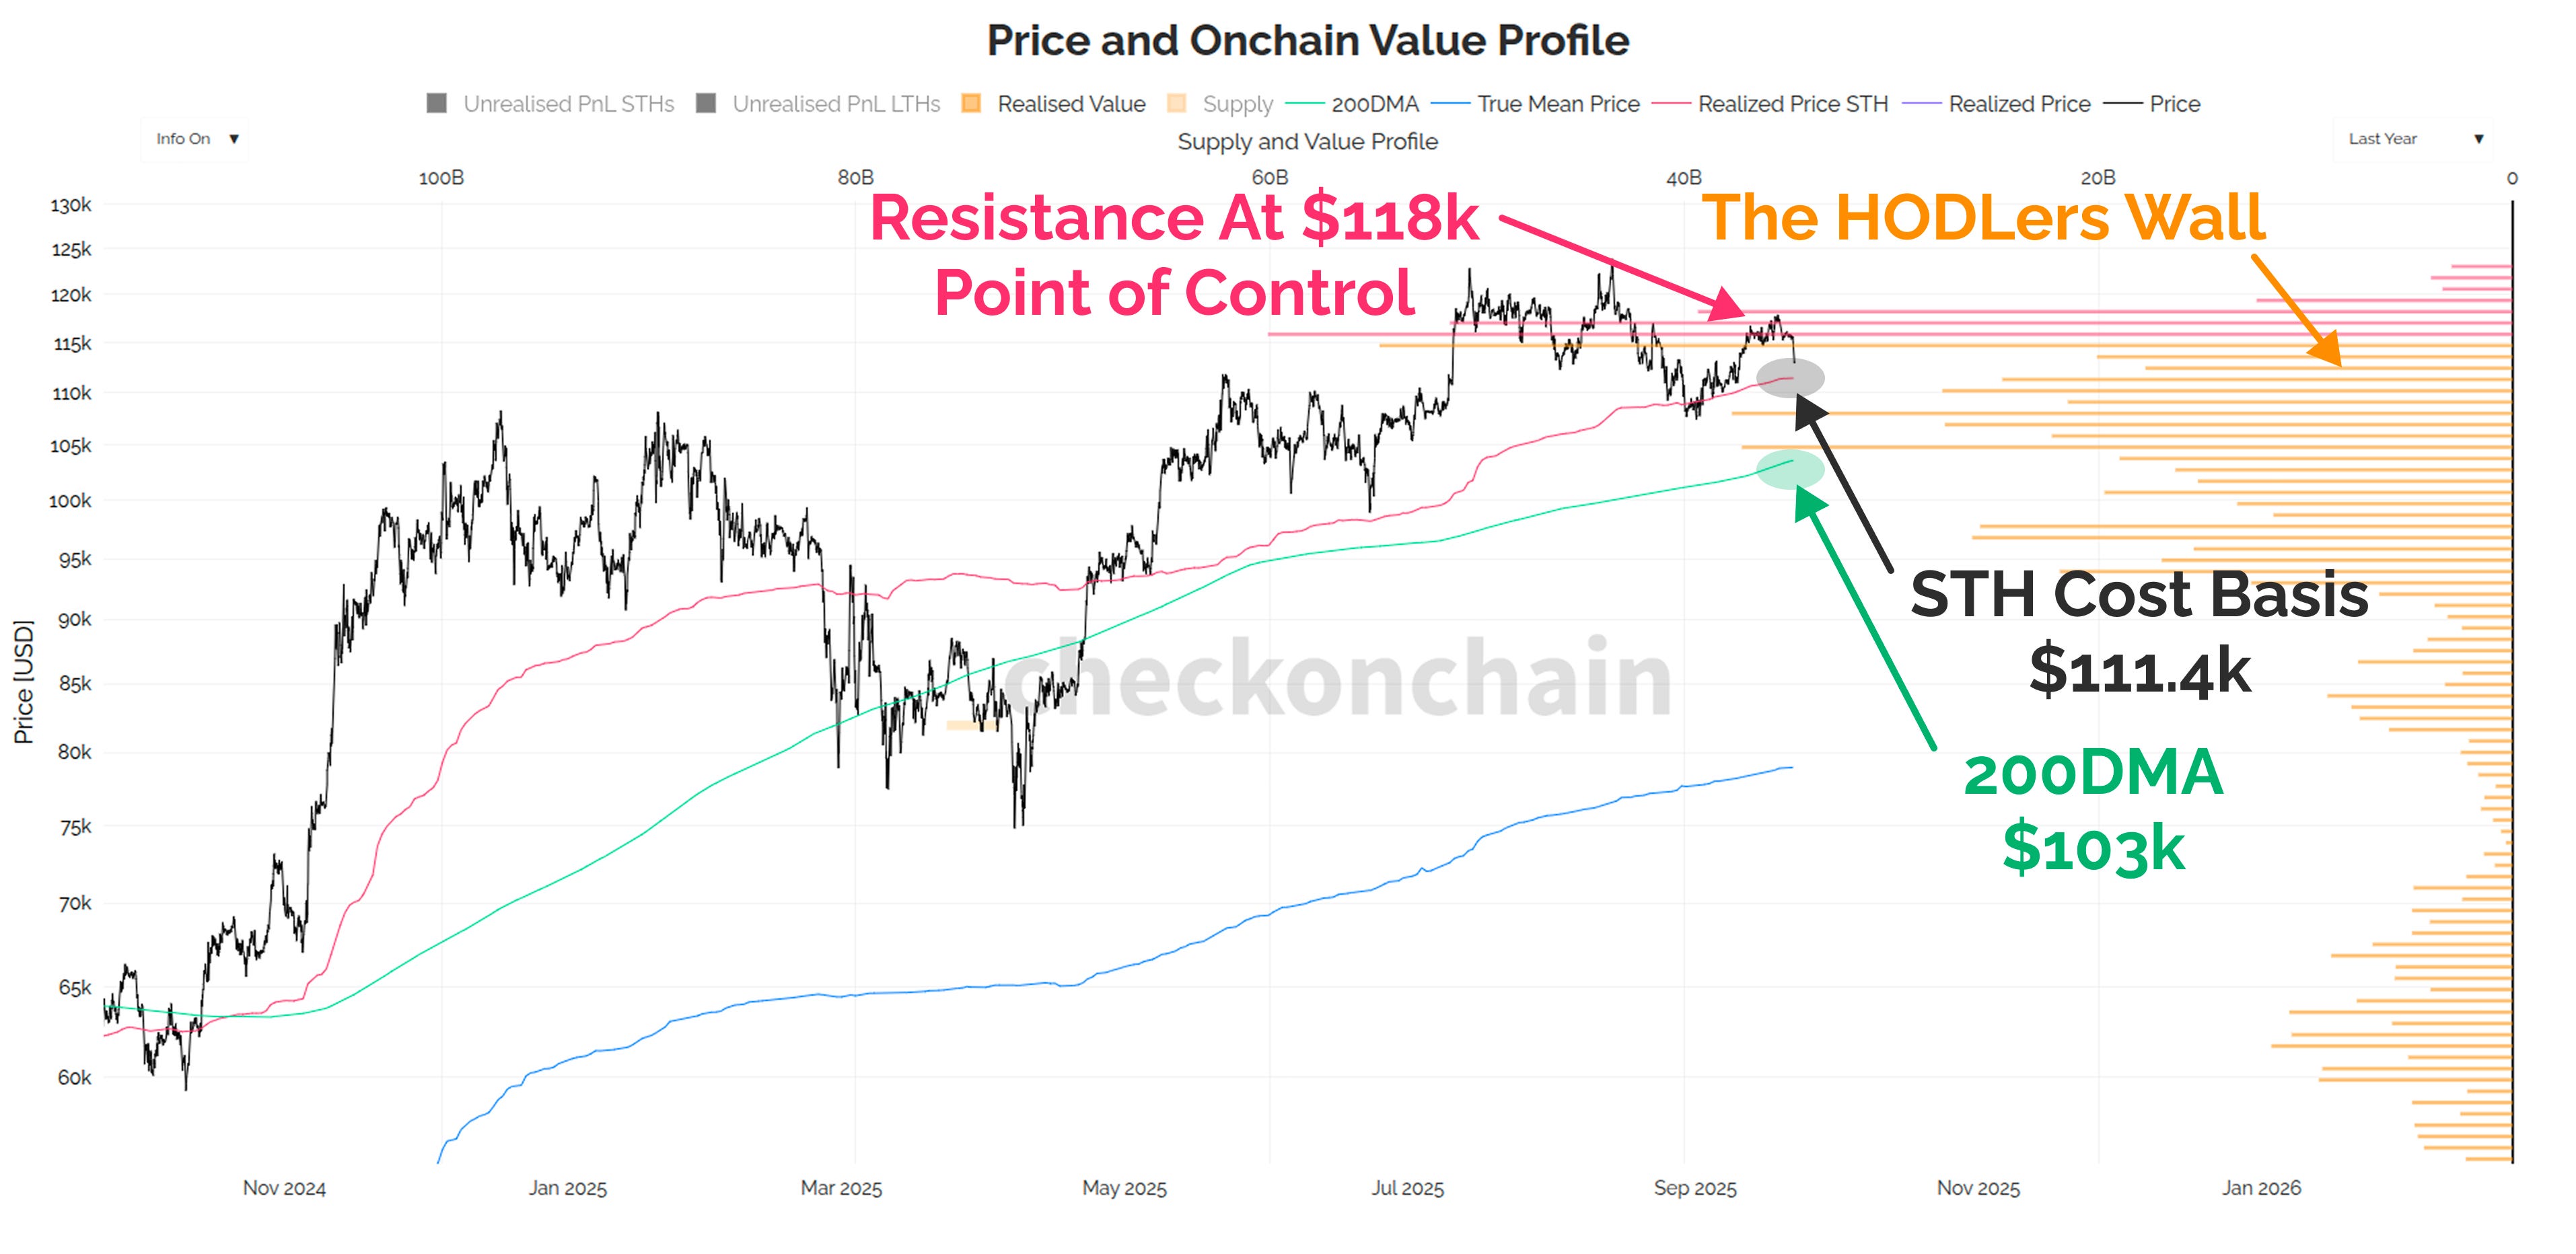
Last week in The HODLers Wall, we established a framework for thinking about the massive concentration of coins which have a cost basis above $95k. The working thesis is that this zone represents a price range of significant historical demand, and should therefore continue to act as support.
What we also framed up, was how quickly the risk can mount for a more serious bear market trend as The HODLers Wall starts showing cracks as price falls.
The bears have gained some ground over the weekend, with the price selling off to $112k. The market appears to have found resistance at the $118k point of control we discussed in mid-August, right after the latest ATH break-out failed to establish serious upside momentum.
Today’s post is going to continue my analysis of the current market setup, with a focus on three key elements:
With the price at $112k, the water level has now risen to the top of The HODLers Wall, and the question is whether too much pressure is building up behind it.
At what price level do I think the pressure will grow to be too much, and cause the wall to fail (which I think would signal the start of a protracted bearish trend).
Are we seeing a meaningful degree of panic or even cautious behaviour amongst Bitcoin investors, and is the sell-pressure building, or dying down.
Engineering helmets back on.
📈 Reminder: you can find the charts from our articles on the Checkonchain Charting Website, and a guide in our Charts Tutorial Video.
Premium Members will find the TL:DR summary, video update and the rest of the written post below. Consider upgrading to premium today to unlock the rest of the content!