

True Market Resistance
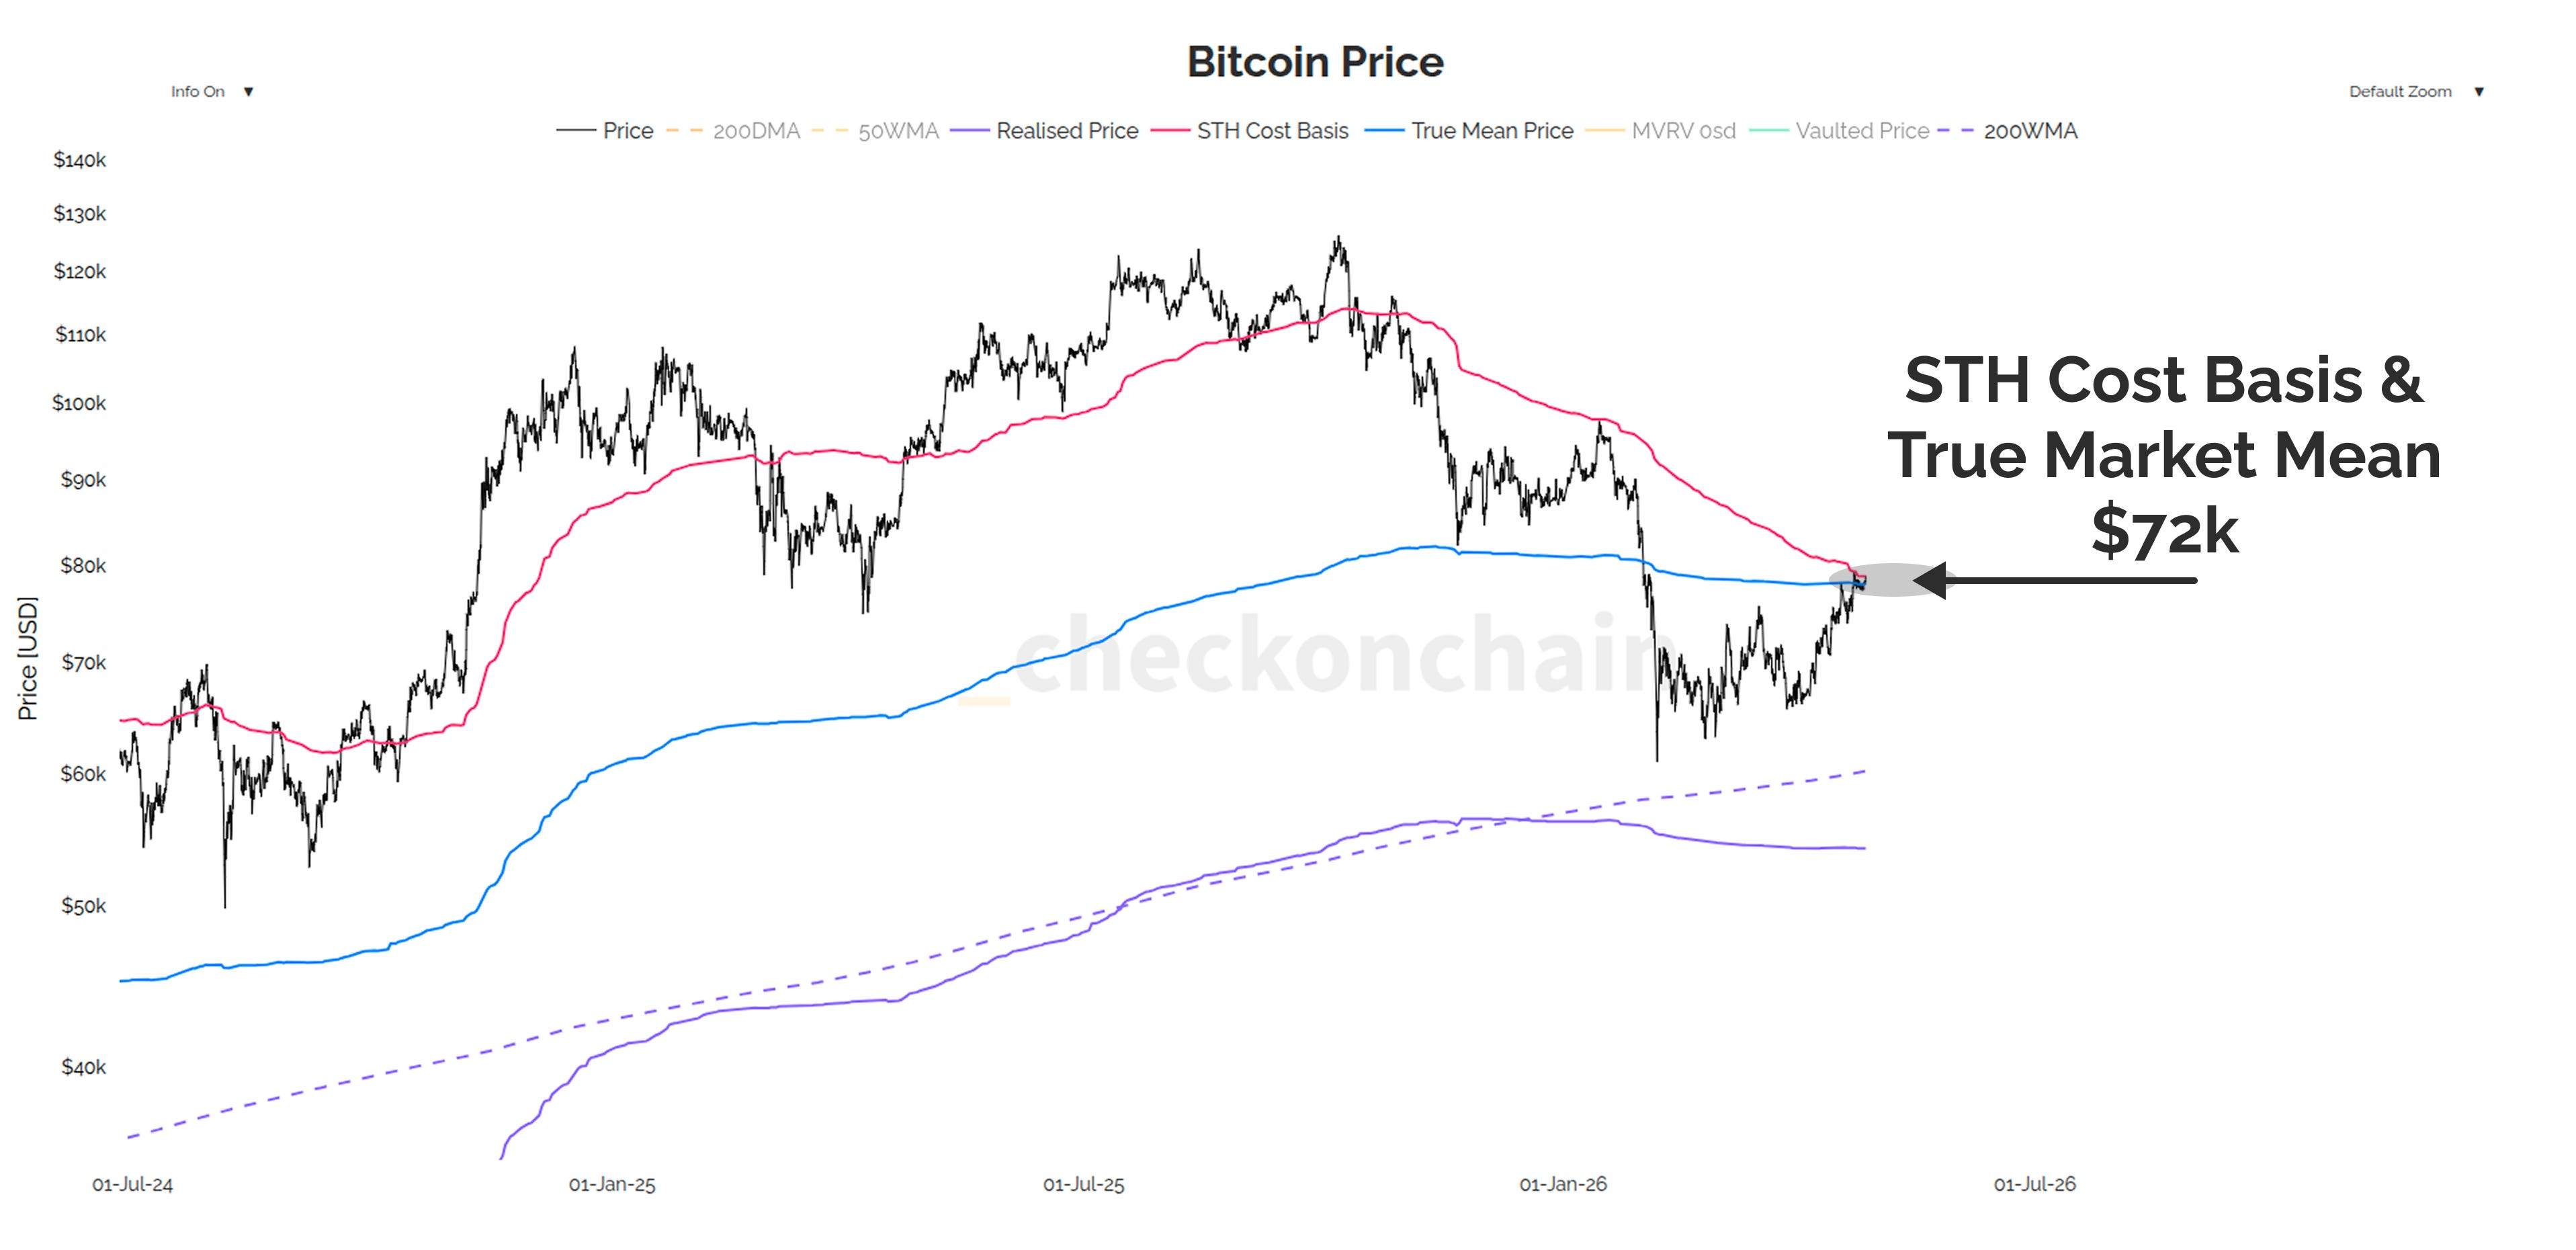
Bitcoin has the bears sweating, threatening to punch above both the True Market Mean, and STH cost basis located at $79k. Historically, flipping these levels has been the line between bears and bulls.
G’day Folks,
The primary reason I always track where price is trading relative to onchain cost basis levels, is they provide a direct read on the centre of gravity for market sentiment.
Breaking above $79k would put both the average active investor, the average recent buyer, and almost put the average ETF investor back into a state of profit.
For the last few months, the default investor behaviour has been to nurse their losses, and sell into whatever liquidity price rips offer. This sell-the-rip behaviour is typical of downtrends, and naturally creates market resistance, and emboldens the bears.
However, there is a tipping point. At some stage, price has rallied enough to put enough people back into the money, and they start feeling more energised to buy-the-dip instead.
At the same time, the bears, many of which were bulls until just a few weeks ago, start leveraging up to make it all back in one trade, as Bitcoin goes to zero.
We’re at the critical juncture, where the bears are in disbelief, and are leveraging up heavily on the short side. At the same time, the bulls have not cracked the True Market Mean and STH cost basis threshold, moving us into buy-the-dip dominance.
Today’s post provides my breakdown of this setup, and how I expect these two competing forces to duke it out at this critical point in the recovery process.
Become a Premium subscriber to access today’s Video Update (39 mins) and TL;DR Summary.