

The Treasury Company Correction
Bitcoin continues consolidating in what looks like a high and tight bull flag, yet many Treasury Company stocks have taken a punch, with some trading more than -50% off the highs.

G’day Folks,
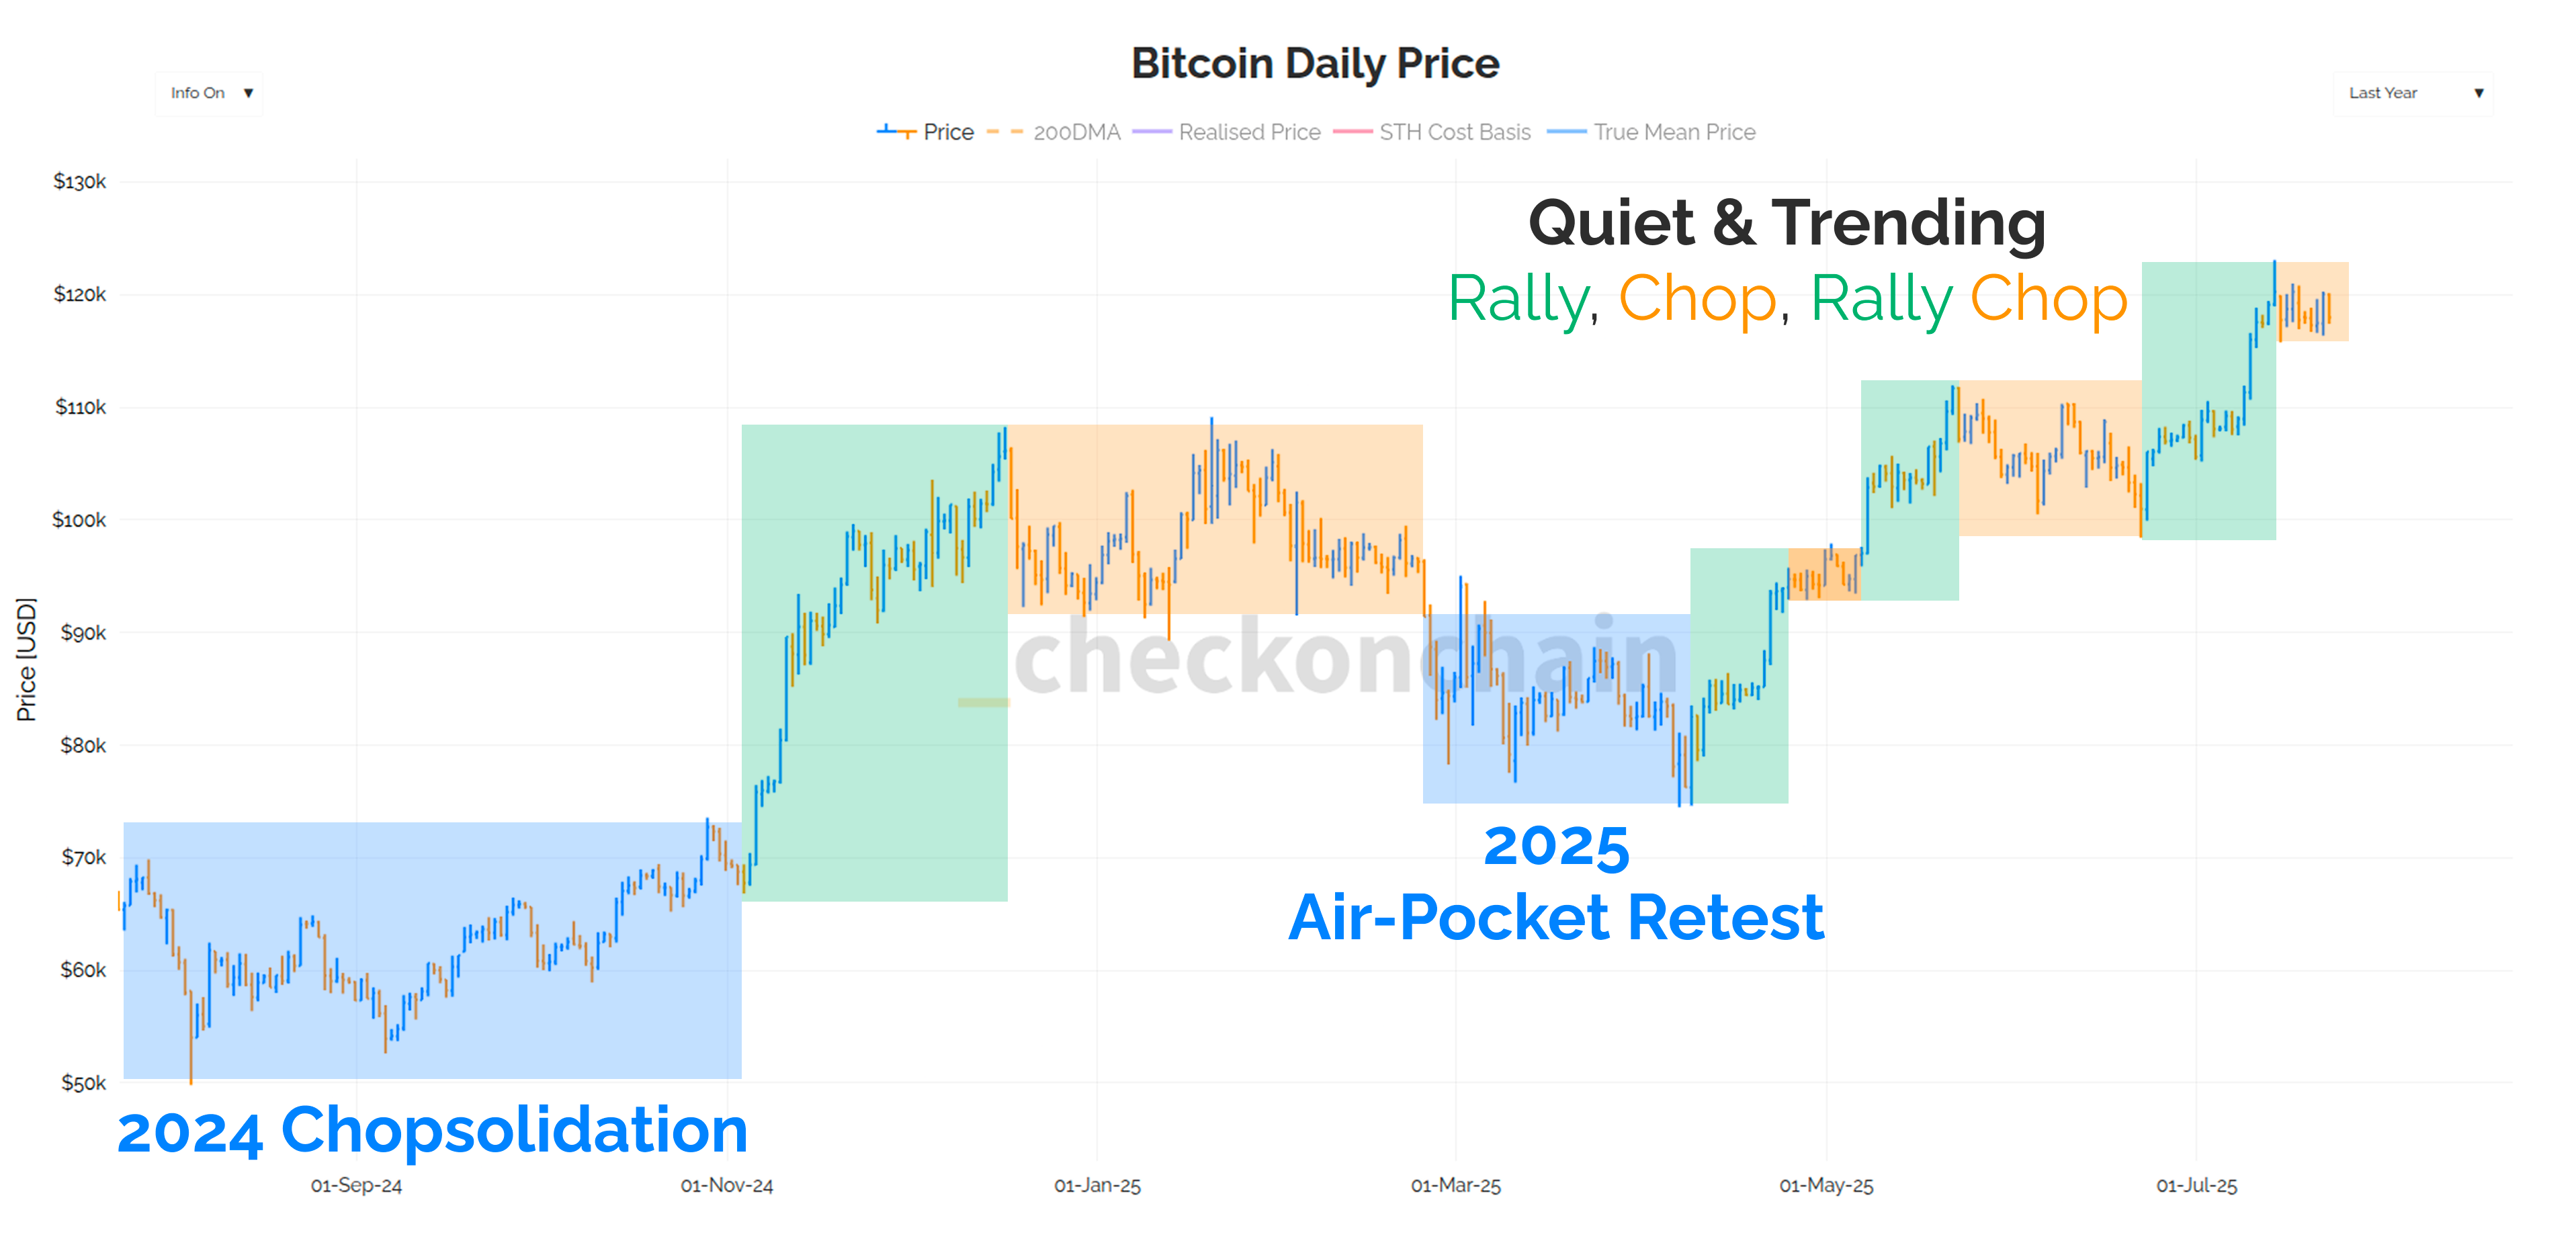
The Bitcoin price chart continues to look like a thing of beauty, trading in a Quiet & Trending sequence of rallies, and periods of chop to recharge the batteries.
This is what stable, healthy price action looks like in my book.
Despite Bitcoin’s price looking so strong, we have seen a pretty meaningful correction in most of the Treasury Company stocks, with many trading -30% to -60% below their recent highs.
The default assumption many have is that strength in the underlying should be translating into strength for these derivative instruments.
In today’s post, I want to cover several topics, including the general setup I see for Bitcoin, my thoughts on how Treasury companies are trading, and the state of leverage building up in the system.
📈 Reminder: you can find the charts from our articles on the Checkonchain Charting Website, and a guide in our Charts Tutorial Video.
Premium Members will find the TL:DR summary, video update and the rest of the written post below. Consider upgrading to premium today to unlock the rest of the content!