

The Right Kind of Correction
The volatility and narratives around Bitcoin can make it hard to distinguish 'a top' from 'the top', so we introduce a simple framework we use to tell them apart, and assess where we are in the cycle.

‘Past performance is not an indicator of future results’ — Literally every financial publication ever written…
Markets are all about probabilities. No matter how hard we have tried as humanity, we’re yet to construct a working crystal ball that successfully predicts the future.
What we do have is an infinite supply of folks who claim to have an Almanac however, but that is a different topic…

Disclaimer: This article is general in nature, and is for informational, and entertainment purposes only, and it shall not be relied upon for any investment or financial decisions.
Rather than getting swept up in the noise and narratives, we prefer to base our analysis of Bitcoin on what is actually happening under the hood. We then add in some relatively simple statistics to get a sense of the probabilities for where we currently sit.
In this edition, I want to explore a simple framework I use with popular metrics like the Mayer Multiple and MVRV to assess whether the market is hot, cold, exploding or imploding. This framework and tools can help every HODLer navigate the cycle, and assign their own risk tolerance to interpret when the MVRV is too hot…or not.
A quick note: The Bitcoin halving went off without a hitch over the weekend, with block 840,000 being mined with an incredible 37.626 BTC in fees. Whilst the halving is an important anniversary in the Bitcoin calendar, the impact on the market is likely to be very small in the short term, but somewhat larger in the long term.
We explored these ideas in last weeks post; Is the Bitcoin Halving Priced in?

KISS My Mayer Multiple
The Mayer Multiple is by far one of the simplest metrics for Bitcoin, being a ratio between price and the 200DMA. Now whilst it is simple at face value, it is actually extremely powerful for a few reasons:
The 200DMA is widely observed by traders and investors across all markets.
Analysts often use the 200DMA as a bull/bear transition indicator.
Humans can hardly remember what they had for dinner yesterday, let alone what the Bitcoin price was 200-days ago.
The 200DMA acted as support and resistance for Bitcoin long before it even had a price chart on TradingView. Why is this?

There is something about that 200-day period which is just long enough that we consider prices back then to be a distant memory.
When the market peaked in 2021 - Bitcoin felt cheap 200-days before.
When FTX imploded - Bitcoin definitely felt expensive 200-days earlier.
Right now - Bitcoin prices 200-days ago feel cheap...we miss them.
If we consider the 200DMA as a natural anchor for our collective price memory, large deviations towards, or away from it can feel like the market has reached some kind of decision point, or an extreme.
This is why we believe the Mayer Multiple is a useful tool for Bitcoin.
We can also see the various phases of a Bitcoin bull plotted out in the Mayer Multiple structure, and I have assigned a set of emotions to them (see if it feels right to you).
🟩 Exhaustion - the bear has worn you out, but it’s actually the point of maximum opportunity.
🟦 Enthusiasm - The first green candles, you’re hopeful, but the bear market PTSD is strong, and we could crash any second...
🟧 Euphoria - Nothing like fresh ATH to get you fired back up…but wait…was that the top?
🟥 Excess - There is no top! Bitcoin is a new paradigm! HFSP!…don’t worry man, it’s just another correction, it will come back even stronger!…
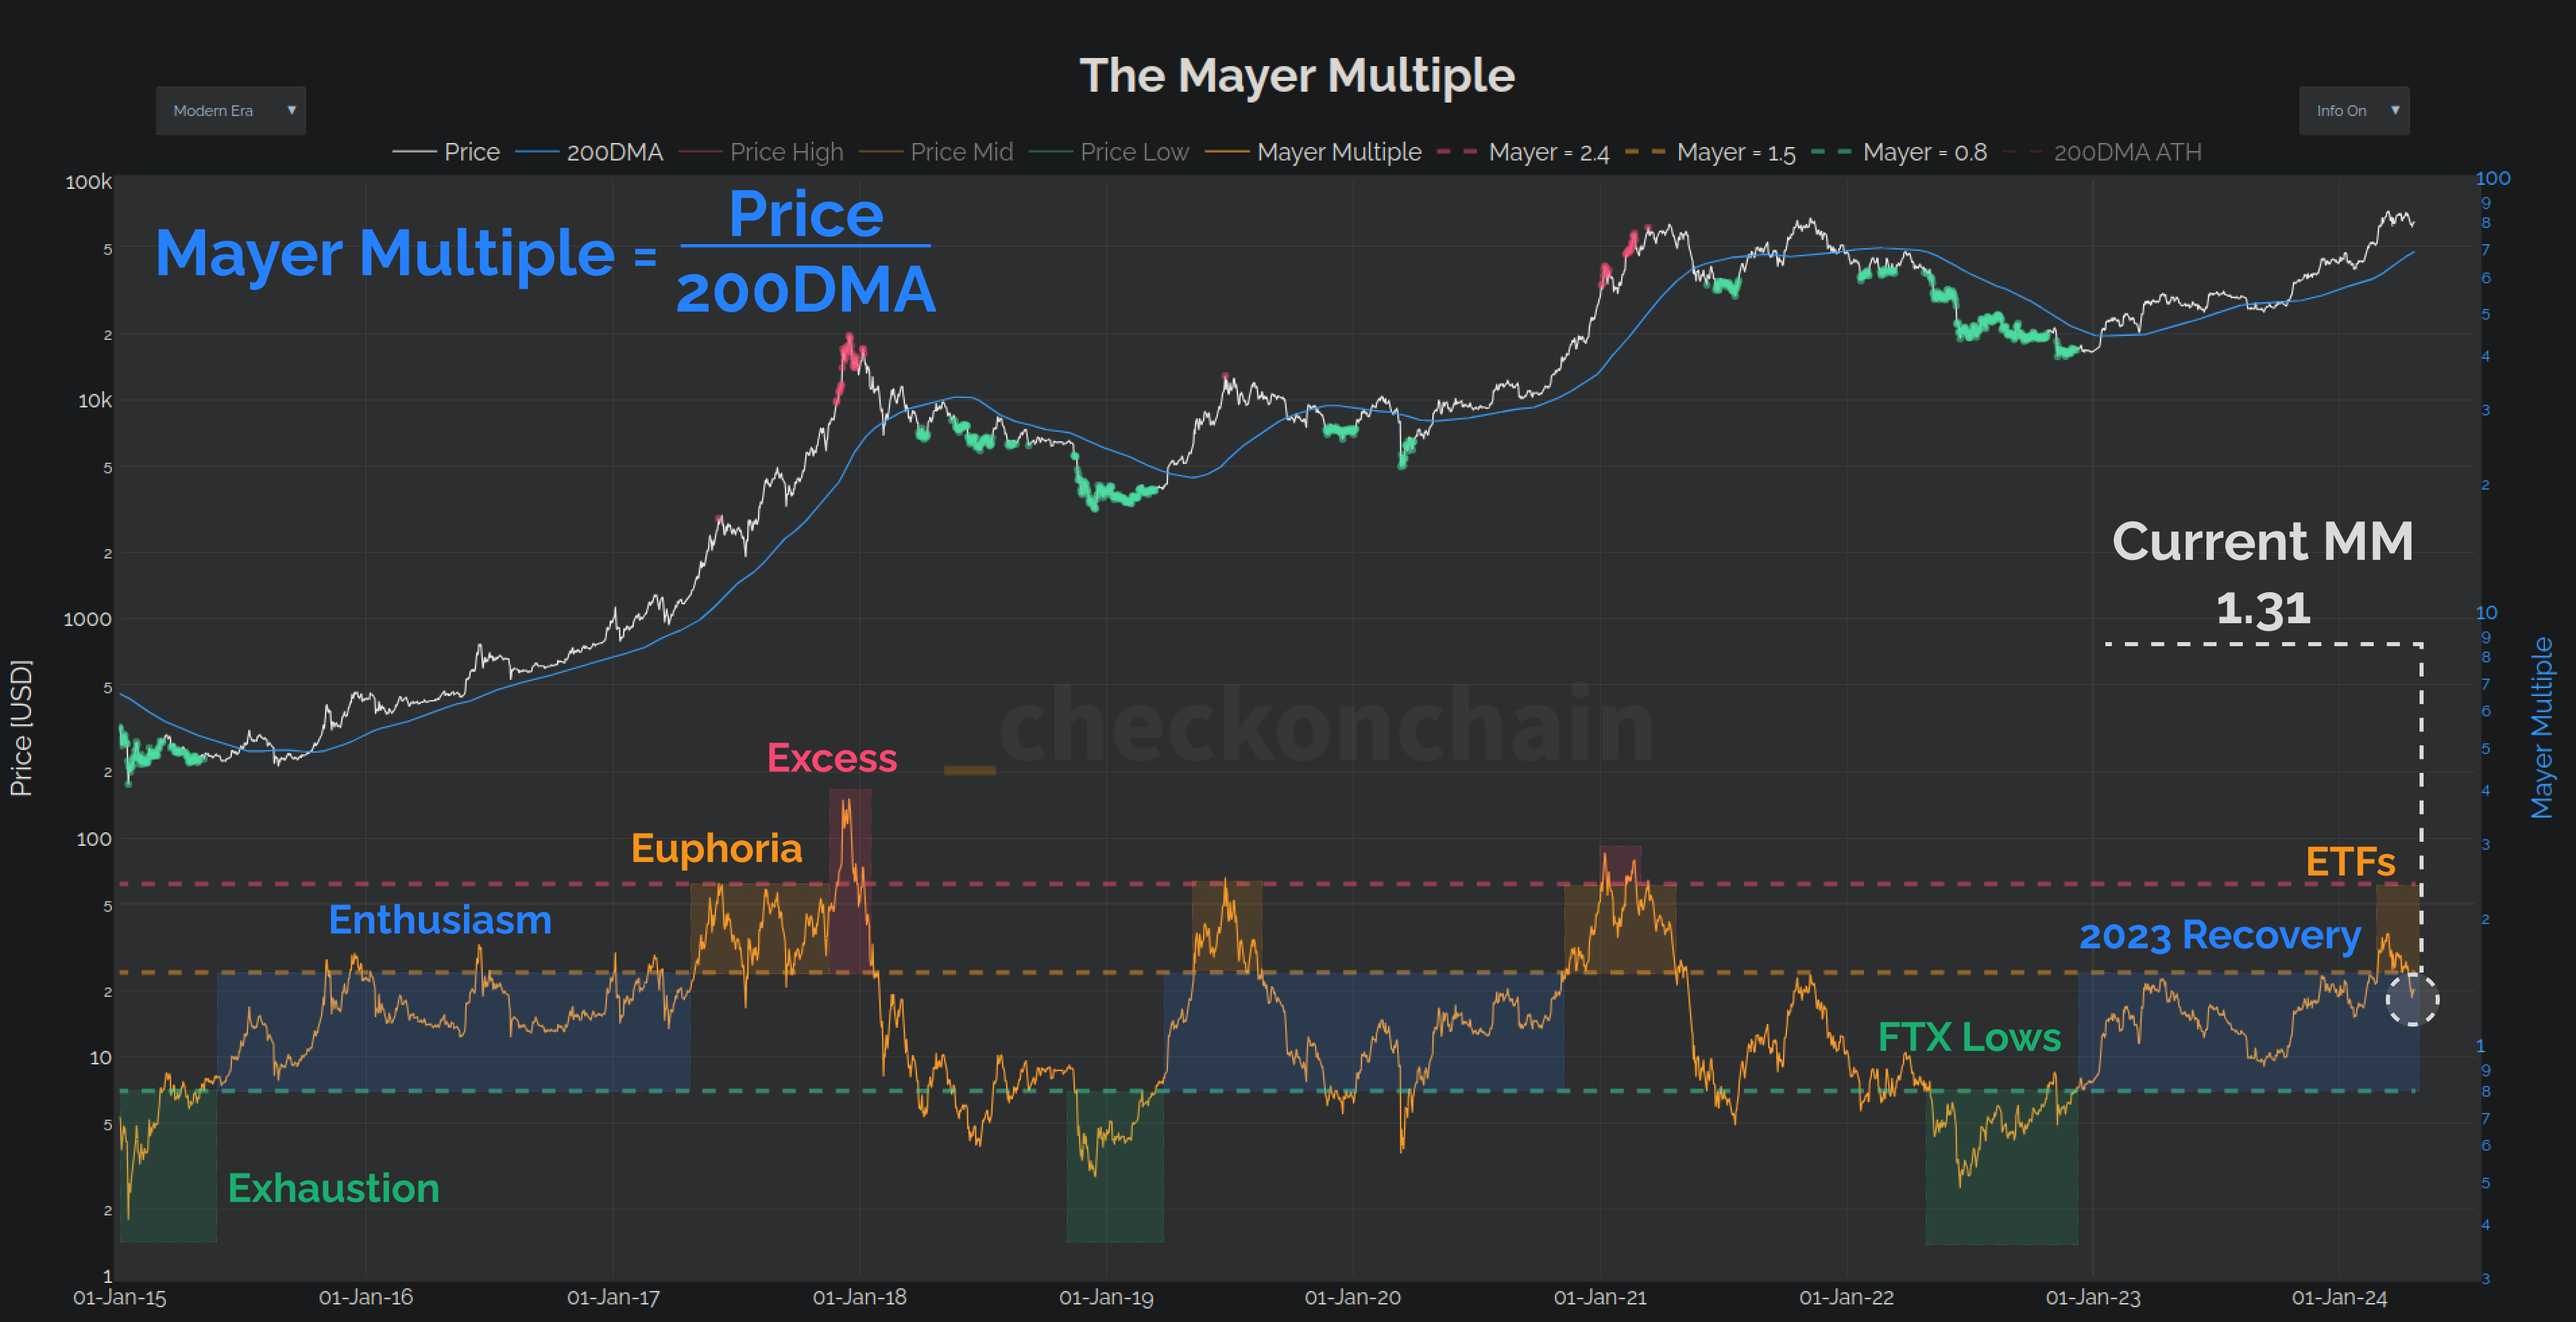
If we make an assessment of the current market, we can see that the Mayer Multiple made a very brief excursion into Euphoria 🟧 as we broke to new $73k ATHs.
Have you noticed how during this correction, sentiment has brought back just a little bit of bear market PTSD? Feels a bit more like the Enthusiasm 🟦 phase from 2023 to me. This cooling off is very healthy, as it resets expectations, and chills out all the calls for the moon.
Let’s put some numbers to all of this, and then bring in the MVRV, and STH-MVRV to establish where we are in the market cycle.
Note: Our paid subscribers will find our full analysis below, and Parts 1&2 of the video at the end of this report (Part 1 can be found on our Youtube channel).