Masterclass #5: The MVRV Ratio
The MVRV Ratio is the original onchain oscillator, describing the average unrealised profit or loss held by Bitcoin investors. This makes it an ideal mean reversion model for tracking cycles.

There are very few constants in markets, but one of the few reliable ones is that investors and traders respond to the profit and loss of their portfolio. With the transparency of Bitcoin onchain data, we can use this insight to our advantage.
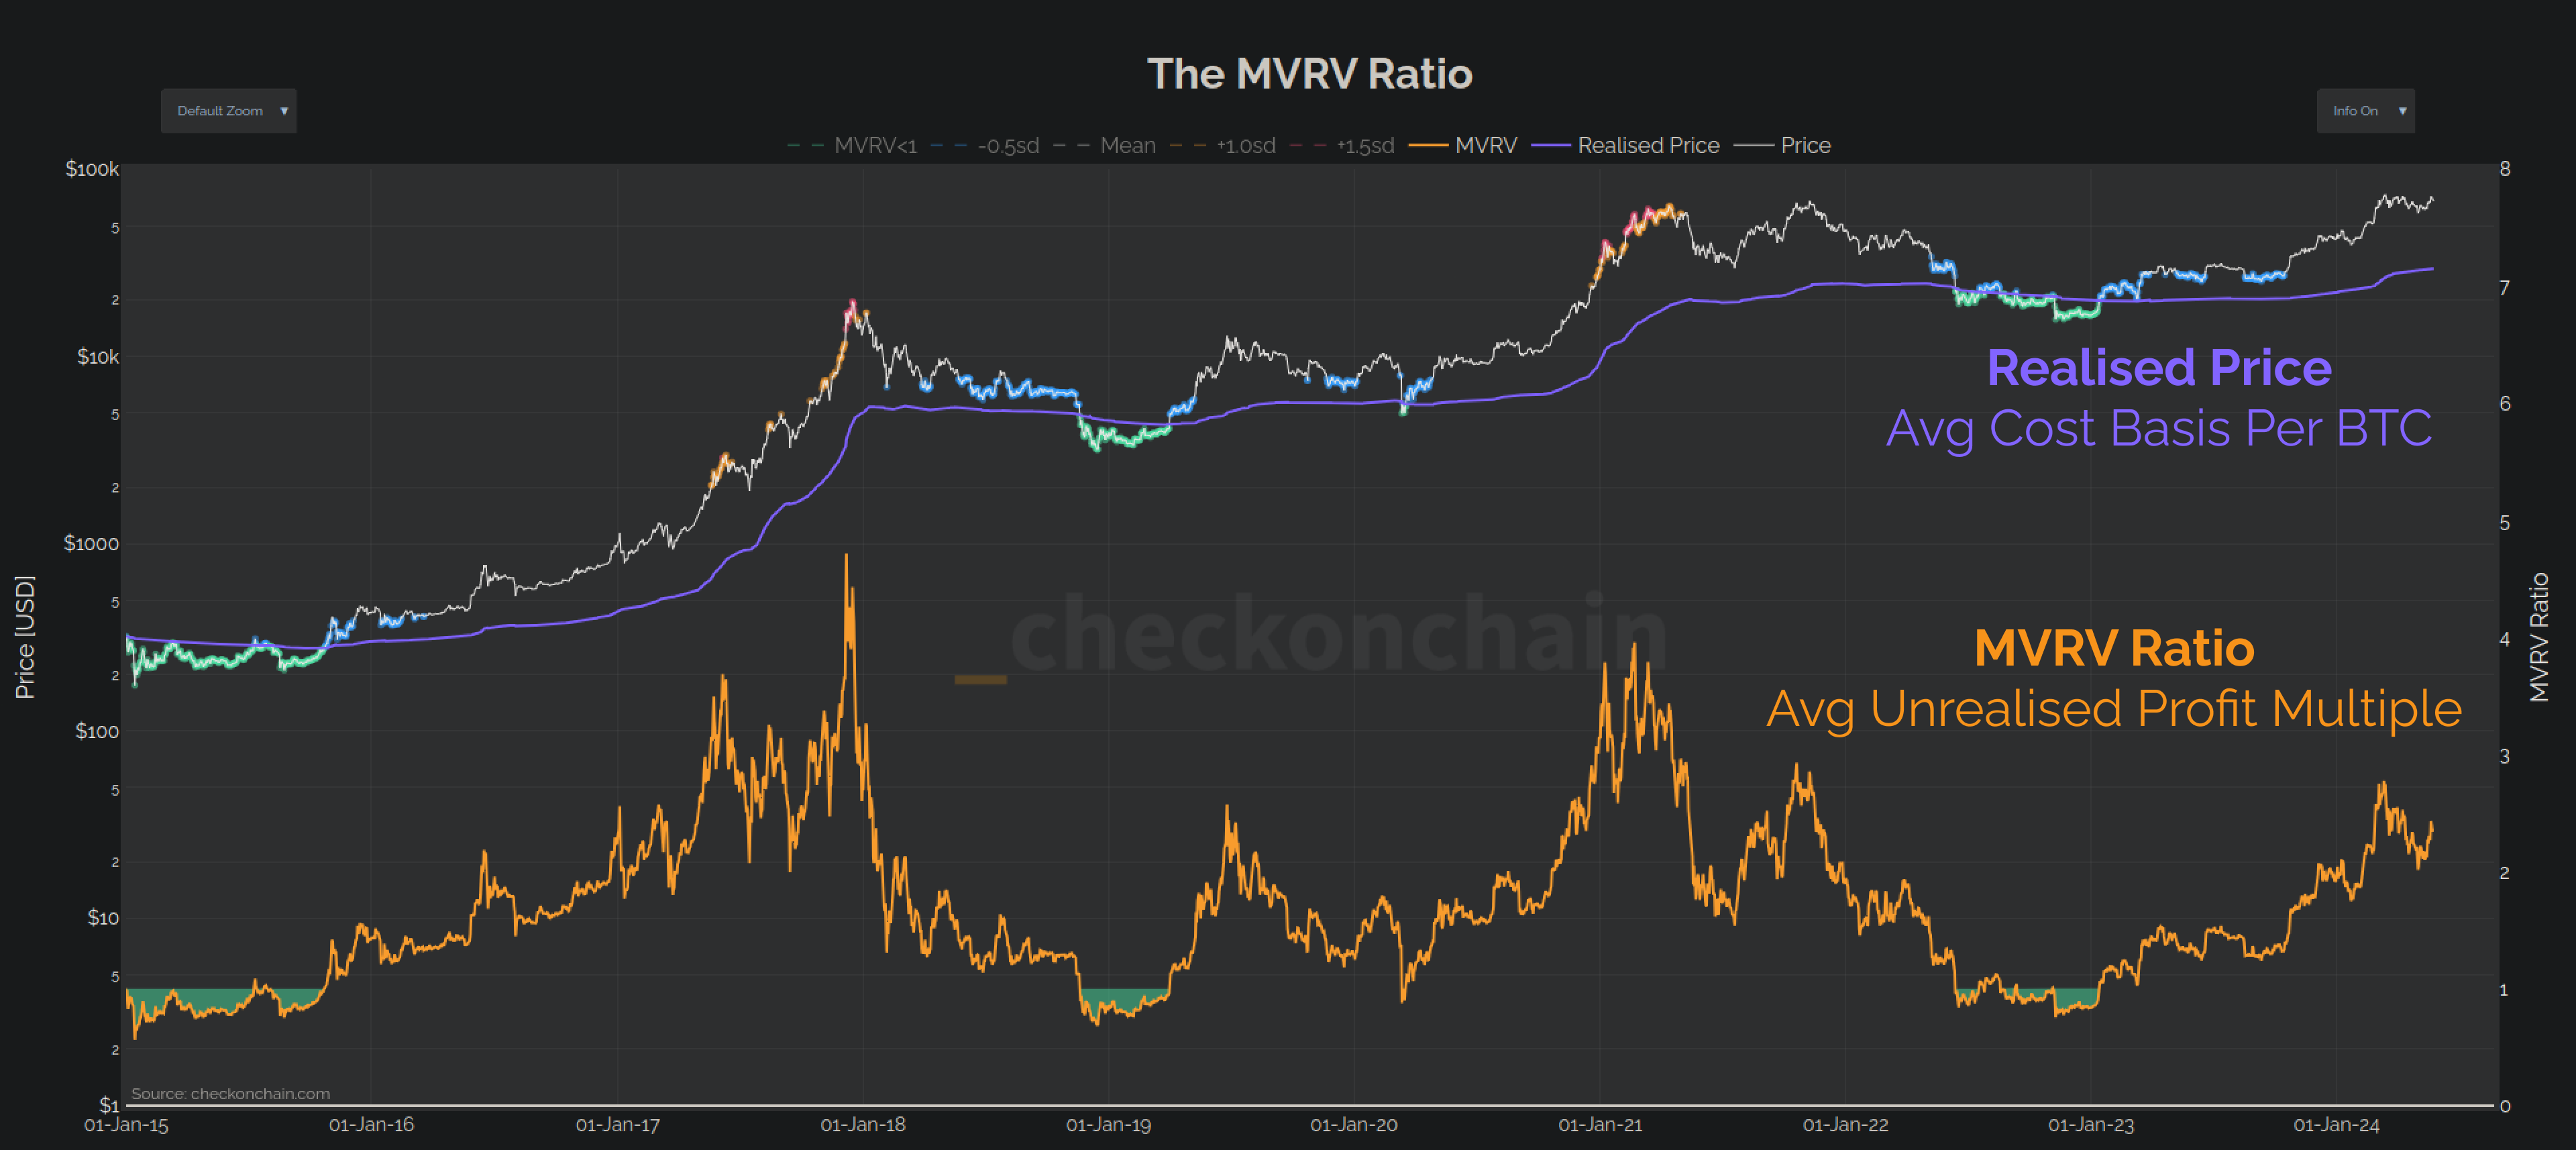
By pricestamping every coin in the Bitcoin supply, we can track the average cost basis where coins were acquired (the realised price). We can then compare this cost basis to the spot price and calculate the magnitude of unrealised (paper) profit or loss held across the market.
This is how we arrive at the Market Value to Realised Value (MVRV) Ratio, which is one of the oldest, and most widely recognised onchain metrics. It is calculated as the ratio between the Market Cap and the Realised Cap (or between the spot price and the realised price).
This powerful oscillator reflects the average unrealised profit/loss held per unit of BTC, and is an invaluable addition to the onchain analysis toolbox. In this article, we will explore the foundations of the MVRV Ratio, and how we can use it to model and analyse:
The magnitude of paper gains and profits held by Bitcoin investors.
Points of seller exhaustion near cycle lows.
Periods of maximum HODLer sell-side pressure near cycle tops.
Pricing levels where investor sentiment and behaviour is likely to change.
Market inflection points and shifts in momentum.