Diagnosing the Dip
This Bitcoin market simply won't go down. Every dip appears to be getting bought, and this tells us a lot of information about the demand profile, despite what should be serious macro headwinds.
G’day Folks,
This damn Bitcoin price just won’t go down…despite plenty of reasons why it should.
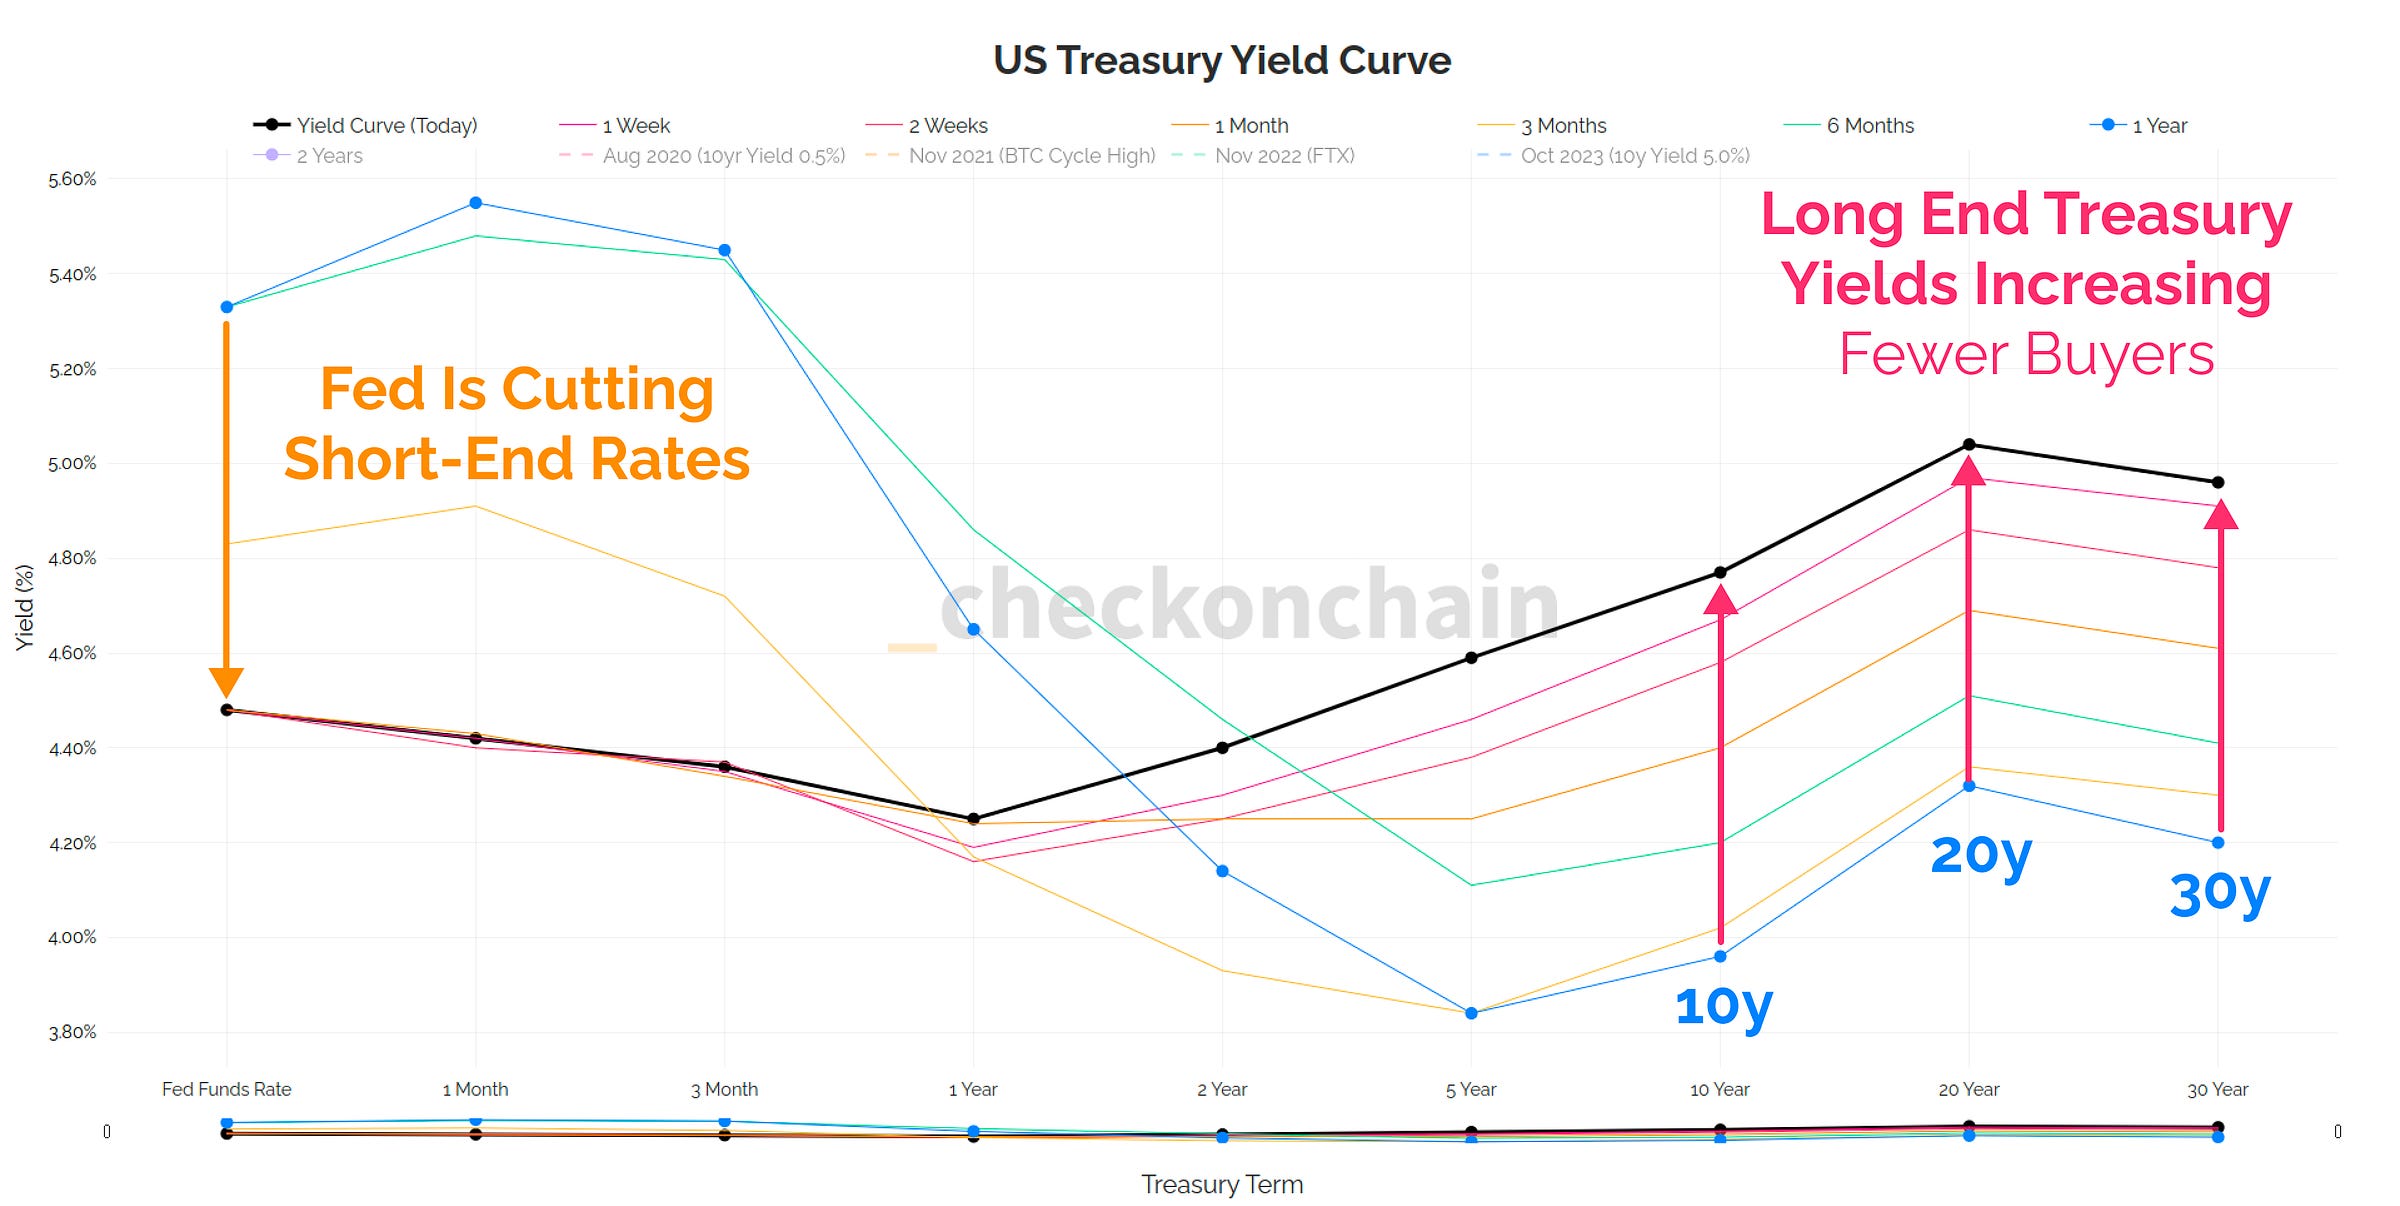
Equities are taking a hit, the USD is extremely strong (DXY hit 110), and yields on the long-end of the US treasury curve are ripping higher.
A strong dollar, and rising long-end rates should, all things being equal, be very negative for risk-on assets.
The fact that BTC is still hovering above $94k at the time of writing is incredible, and I can’t yet tell whether this is just a temporary divergence waiting to close up…or if we’re watching something much bigger starting to play out.
When the long-end of the Treasury curve climbs like this, even though the Fed is cutting short-end rates, it feels like the bond market is starting to call bullshit on the cutting cycle, and perhaps on the over-indebted fiat system itself.
My instinct is that this may also have a lot to do with questions surrounding the incoming Trump administration. What policies will he prioritise? What policies will Congress support? Is he serious about Tariffs? Are they really going to cut billions in spending via DOGE? How well will the markets and economy react and adapt?
These are all unanswered questions, and we’re a few days away from finding out which direction things will go.
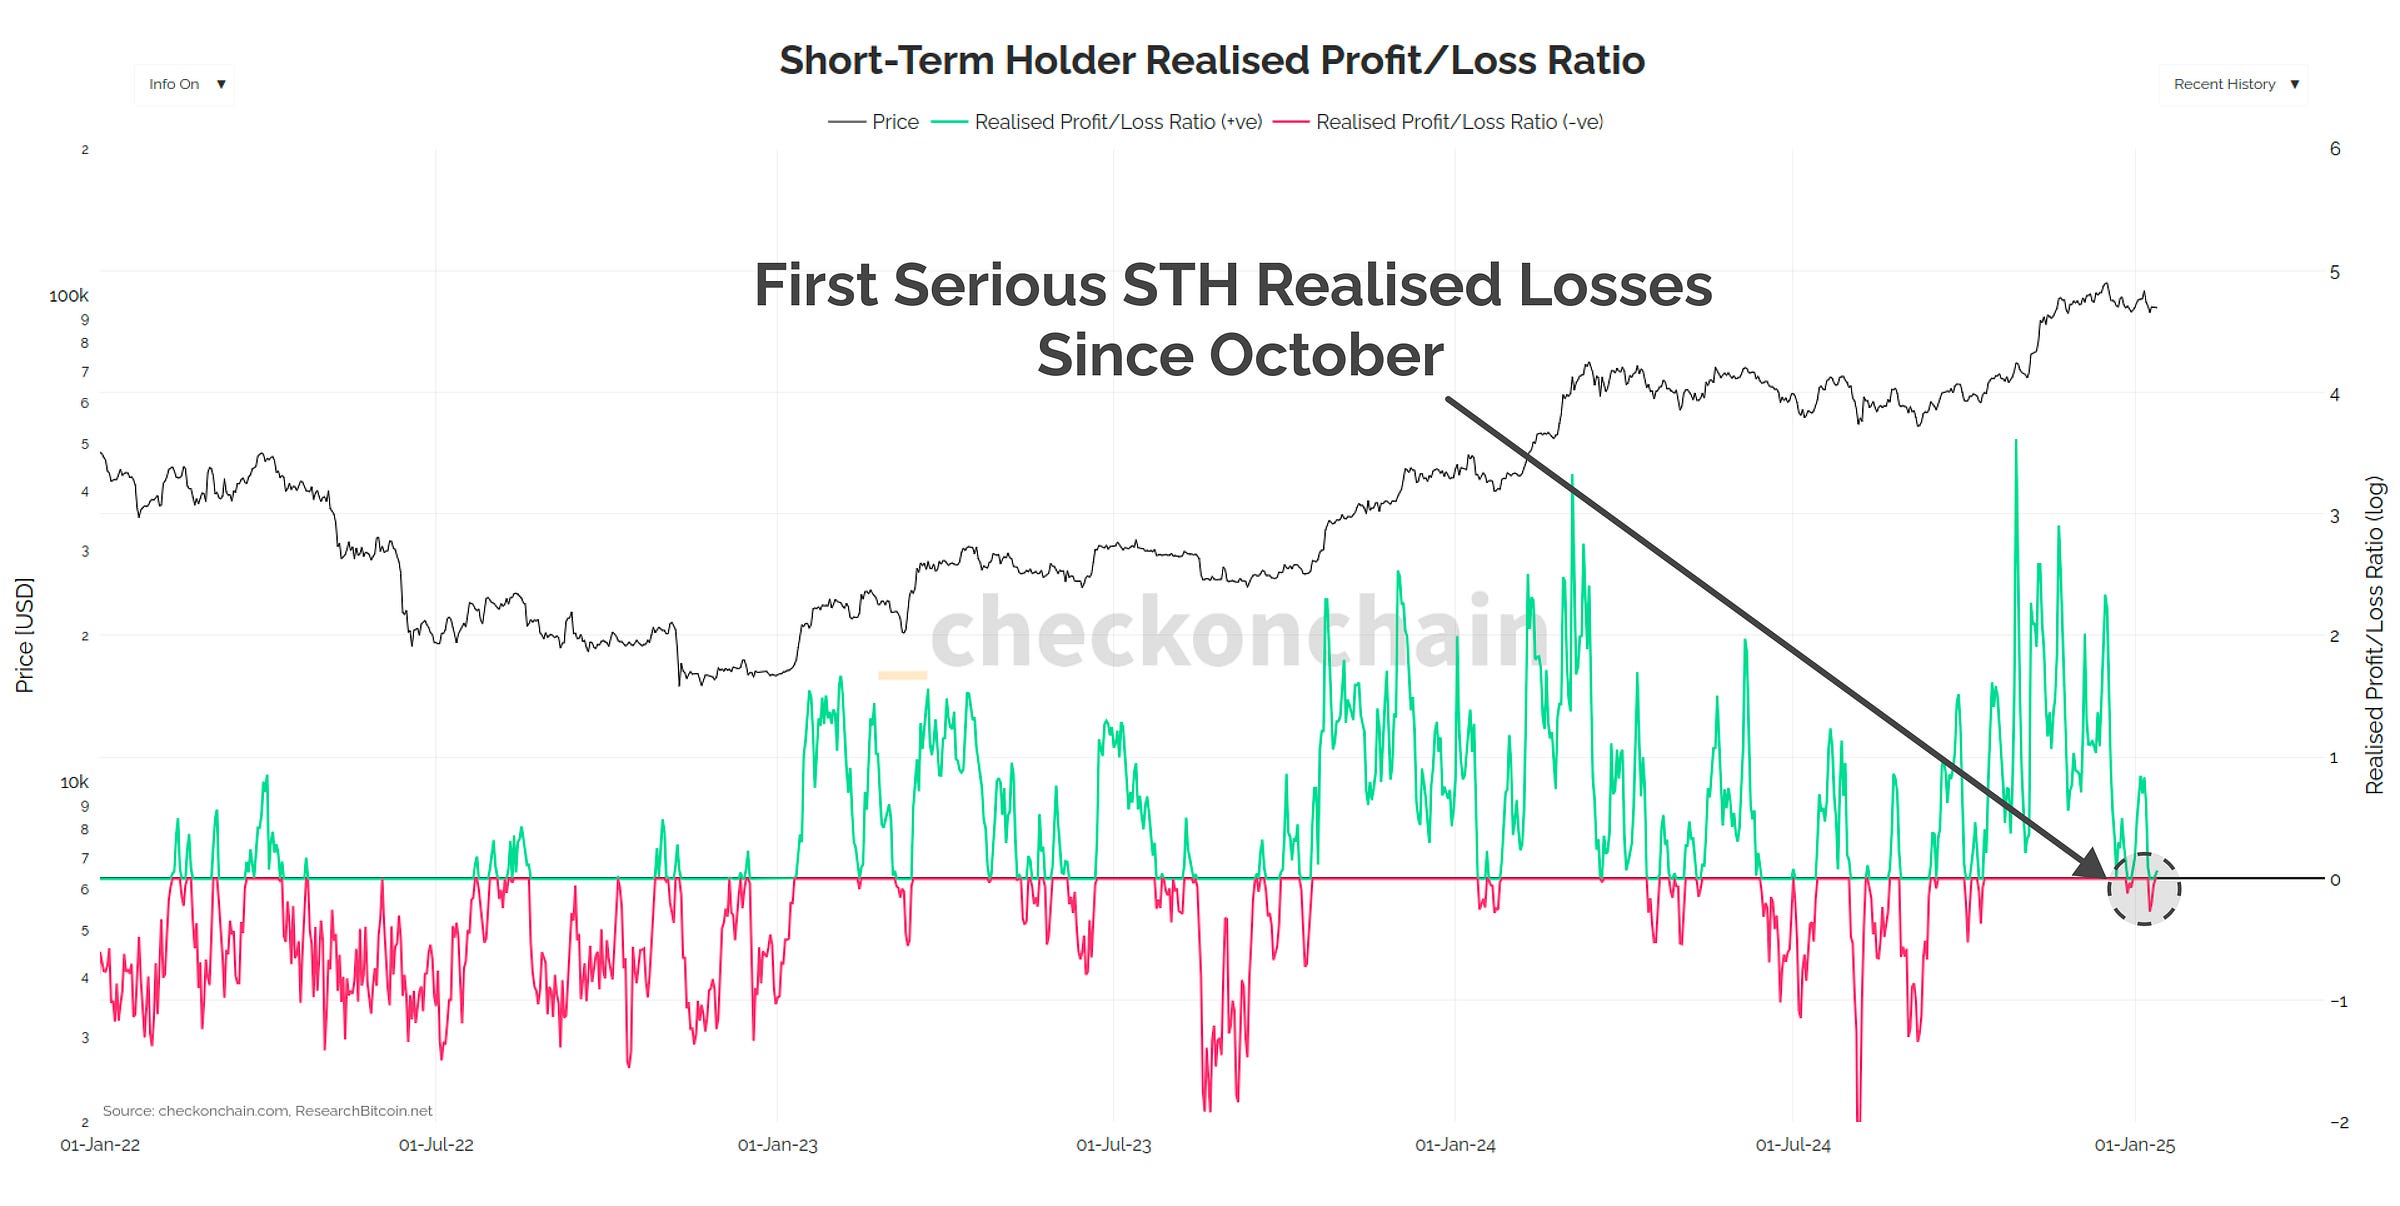
In the meantime, Bitcoin briefly pulled back as far as $89k, although the dip was promptly snapped up, reaching back above $94k. We even have our first significant batch of Short-Term Holder top buyers taking losses, which is great to see.
I continue to be impressed with the resilience of the BTC demand profile this cycle, and it continues to provide a robust floor.
In today’s edition, I will cover two key topics, seeking to diagnose this dip:
A market situation report, providing my view on the price dip and subsequent rebound.
Analysis of the distribution of supply to gauge the severity of further drawdown risk.
📈 Reminder: you can find the charts from our articles on the Checkonchain Charting Website, and a guide in our Charts Tutorial Video.
Premium Members will find the TL:DR summary, video update and the rest of the written post below. Consider upgrading to premium today to unlock the rest of the content!


